Thresholding Overview
Thresholding on the system is used to monitor the system for conditions that could potentially cause errors or outage. Typically, these conditions are temporary (i.e. high CPU utilization, or packet collisions on a network) and are quickly resolved. However, continuous or large numbers of these error conditions within a specific time interval may be indicative of larger, more severe issues. The purpose of thresholding is to help identify potentially severe conditions so that immediate action can be taken to minimize and/or avoid system downtime.
-
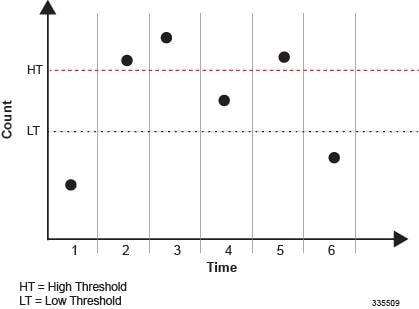
Alert: A value is monitored and an alert condition occurs when the value reaches or exceeds the configured high threshold within the specified polling interval. The alert is then generated and/or sent at the end of the polling interval.
In the example shown in the figure below, this model generates alerts during period 2, 3, and 5 at the point where the count exceeded HT.
-
Alarm: Both high and low thresholds are defined for a value. An alarm condition occurs when the value reaches or exceeds the configured high threshold within the specified polling interval. The alert is then generated and/or sent at the end of the polling interval.
The alarm is cleared at the end of the first interval where the measured value is below the low threshold.
In the example shown in in the figure below, this model generates an alarm during period 2 when the count exceeds HT. A second alarm is generated in period 6 when the count falls beneath LT. The second alarm indicates a "clear" condition.

 Note |
Note that for certain values, the alert or alarm serves to warn of low quantities (i.e. memory, session licenses, etc.). In these cases, the low threshold is the condition that must be met or exceeded within the polling interval to generate the alert or alarm. Once the high threshold is exceeded during an interval, the low quantity condition is cleared. |
-
AAA: -
Archive size
-
Number of authentication failures
-
Authentication failure rate
-
Number of accounting failures
-
Accounting failure rate
-
Retry rate
-
AAA Manager request queue usage
-
-
ASN GW Service: -
Number of ASN GW Authentication failures
-
Number of ASN GW hand-off denials
-
Maximum number of EAP retries
-
Number of network entry denials
-
Number of Network Access Identifier (NAI) in R6 message
-
ASN GW timeout duration during session setup
-
ASN GW session timeout duration
-
-
FA Service registration reply errors
-
HA Service: -
Call setup rate
-
Registration Reply, Re-registration Reply, and De-registration Reply errors
-
-
HNB-GW Service Sessions: -
Total HNB Sessions
-
Total UE Sessions
-
Total Iu Sessions
-
-
PDSN Service: -
Call setup rate
-
A11 Messages failed and discarded
-
PPP send packets discarded
-
-
Call setup: -
Number of calls setup
-
Number of call setup failures
-
RP setup failure rate
-
PPP setup failure rate
-
Number of calls rejected due to no processing resources being available
-
-
MME Service -
Number of MME Authentication failures
-
Number of MME Session Attachment failures
-
Number of MME sessions
-
-
PAC/PSC CPU resource availability: -
10 second sample utilization
-
Percent utilization
-
Available memory
-
Load
-
Memory usage
-
Session throughput
-
-
SPC/SMC CPU resource availability: -
Memory usage
-
Percent utilization
-
ORBS software task utilization
-
-
IP address pool utilization
-
Licensed session utilization
-
Packet processing: -
Number of packets filtered/dropped
-
Number of packets forwarded to CPU
-
-
Per-service session count
-
Port utilization: -
High activity
-
Transmit utilization
-
Receive utilization
-
-
Subscriber number: -
Total number
-
Number active
-
-
Total session count
-
SPC/SMC CompactFlash memory utilization
-
SNMP traps: SNMP traps have been created that indicate the condition (high threshold crossing and/or clear) of each of the monitored values. Complete descriptions and other information pertaining to these traps is located in the starentMIB(8164).starentTraps(2) section of the SNMP MIB Reference.
The generation of specific traps can be enabled or disabled on the system allowing you to view only those traps that are most important to you.
-
Logs: The system provides a facility called threshold for which active and event logs can be generated. As with other system facilities, logs are generated Log messages pertaining to the condition of a monitored value are generated with a severity level of WARNING.
Refer to the System Administration Guide for additional information on system logging functionality.
-
Alarm System: High threshold alarms generated within the specified polling interval are considered "outstanding" until a the condition no longer exists and/or a condition clear alarm is generated.
"Outstanding" alarms are reported to through the system\'s alarm subsystem and are viewable through the system\'s CLI.
| Model | SNMP Traps | Logs | Alarm System |
|---|---|---|---|
| Alert | X | X | |
| Alarm | X | X | X |
 Feedback