Cisco Nexus Dashboard Data Sheet
Bias-Free Language
The documentation set for this product strives to use bias-free language. For the purposes of this documentation set, bias-free is defined as language that does not imply discrimination based on age, disability, gender, racial identity, ethnic identity, sexual orientation, socioeconomic status, and intersectionality. Exceptions may be present in the documentation due to language that is hardcoded in the user interfaces of the product software, language used based on RFP documentation, or language that is used by a referenced third-party product. Learn more about how Cisco is using Inclusive Language.
Cisco Nexus Dashboard transforms hybrid data center operations by providing a single pane of glass from which to operate and manage your infrastructure.
Cisco Nexus Dashboard revolutionizes operations in today’s modern datacenter environments. Network operations teams are struggling to reconcile fragmented toolchains, an inconsistent user experience, and siloed processes in order to manage complex data center environments that include on-premises infrastructure and public cloud sites. Cisco Nexus Dashboard specifically addresses this pain point by providing a single pane of glass from which to manage a unified operations infrastructure based on the Cisco Nexus Dashboard platform. Based on a horizontal scale-out architecture, Cisco Nexus Dashboard can unify operations from the on-premises infrastructure (Cisco Application Centric Infrastructure [Cisco ACI] or Cisco NX-OS with Cisco Nexus Dashboard Fabric Controller (NDFC)) to colocations and to the public cloud. Cisco Nexus Dashboard provides a seamless user experience for the operator whether it is to rapidly troubleshoot issues or execute change window actions with a high degree of confidence. Operators spend more time on the “logistics ladder” of traditionally fragmented toolchains before any operational value is realized. With the frictionless user experience of Cisco Nexus Dashboard, operators can focus on what they do best—troubleshooting, triaging, or executing change windows with a high degree of confidence, rather than figuring out URLs, credentials, or access controls.
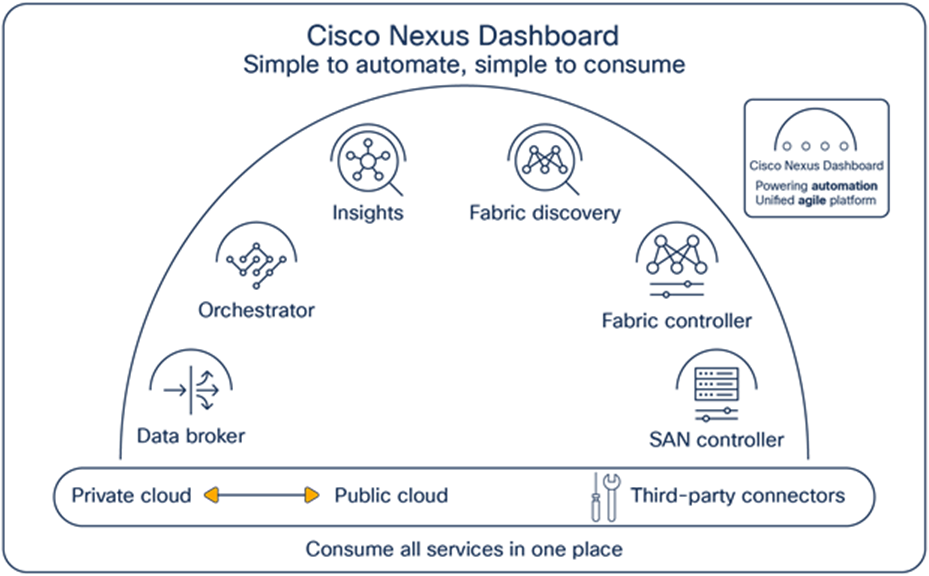
The intuitive Cisco Nexus Dashboard platform provides services such as Cisco Nexus Dashboard Insights, Cisco Nexus Dashboard Orchestrator, Cisco Nexus Dashboard Data Broker, and a single operational view of your geographically dispersed multicloud environments. The platform enables the acceleration of NetOps and DevOps capabilities while scaling into the cloud. And it aligns seamlessly with third-party ecosystem tools from HashiCorp Terraform, ServiceNow, and Splunk, with other integrations to come.
Cisco Nexus Dashboard Orchestrator (formerly Cisco ACI Multi-Site Orchestrator [MSO]), the Cisco Nexus Dashboard Insights (formerly Nexus Insights [NI]), and Cisco Nexus Dashboard Data Broker (formerly Nexus Data Broker) services are being integrated into the Cisco Nexus Dashboard as native services as part of simplifying the overall consumption experience for our customers.
● Cisco Nexus Dashboard Orchestrator (formerly Cisco ACI Multi-Site Orchestrator) allows operators to push policies and templates and set up intersite connectivity at scale. Besides delivering high-level policies to the local data center controller—also referred to as the domain controller—it enables separation of fault domains, federation of datacenter and cloud networks, and business resiliency at a global scale. Nexus Dashboard Orchestrator also enables end-to-end change-management workflows, centralized fabric management and upgrades, multicloud/hybrid-cloud connectivity, normalized segmentation, and security policies across the data center, SD-WAN, and enterprise branch and campus networks. For example, the SD-WAN integration provides application-aware SLA-based routing (policy-based path selection and QoS treatment) in the SD-WAN infrastructure used for interconnecting sites.
● Cisco Nexus Dashboard Insights (formerly Nexus Insights) allows operators to consume the entire insights and assurance stack as a unified offering but also to take advantage of the integrated services to set up automated workflows such as upgrade assist and automated Splunk SIEM integration. It incorporates a set of advanced alerting, baselining, correlation, and forecasting algorithms to provide a deep understanding into the behavior of the network. It also analyzes flow telemetry data streamed from Cisco Nexus 9000 Series Switches to provide perfect introspection into hybrid cloud infrastructure. The Insights service and AppDynamics are tightly integrated to pinpoint exactly where and when an application issue originated from a network perspective.
● Cisco Nexus Dashboard Data Broker (formerly Nexus Data Broker) is now a part of Cisco Nexus Dashboard, which provides pervasive packet and network visibility for NetOps and SecOps to programmatically manage aggregating, filtering, and forwarding complete workflows to custom analytics tools. It is a multitenant-capable solution that can be used with both Nexus and Cisco Catalyst fabrics. It replaces the traditional purpose-built network packet broker appliances with high-throughput Cisco Nexus switches, enabling IT to create cost-effective and scale-out packet broker fabrics.
● Third-party applications: Cisco Nexus Dashboard offers a rich suite of services for third-party developers to build applications. REST APIs allow third-party tools to authenticate and integrate with key services such as Nexus Dashboard Insights and Nexus Dashboard Orchestrator. Currently supported third-party integrations in the Nexus Dashboard ecosystem include ServiceNow ITSM/ITOM, Splunk SIEM, HashiCorp Terraform,[1] and Red Hat Ansible.[2]
● Cisco Nexus Dashboard Fabric Controller: Cisco Nexus Dashboard can also host Cisco NDFC similar to the hosting of operational services. This unified capability gives customers a single touch point on their journey from installation to operations. This brings the controller for fabrics based on Cisco NX-OS under the Cisco Nexus Dashboard platform and unleashes the benefits of faster time to deploy and upgrade and an improved overall user experience to Cisco NDFC.
The operations’ team now has to deal with a single stack and one operations toolkit—whether they are running Cisco ACI or Cisco NDFC in their hybrid cloud infrastructures.
Operational infrastructure standardization and toolchain unification directly lead to operational excellence and savings and free up resources for business innovation.
Table 1. Features and benefits
| Feature |
Benefit |
| Single sign-on (SSO) |
|
| Multifactor authentication |
Reduce risk of static passwords and increase security with DUO supported multifactor authentication |
| Clustered, highly available, and scale-out platform infrastructure to host all applications Minimizes maintenance and lifecycle management vs. siloed operations infrastructure |
|
| Single pane of glass to manage the operations infrastructure |
A single pane of glass to manage Cisco Nexus Dashboard services and infrastructure |
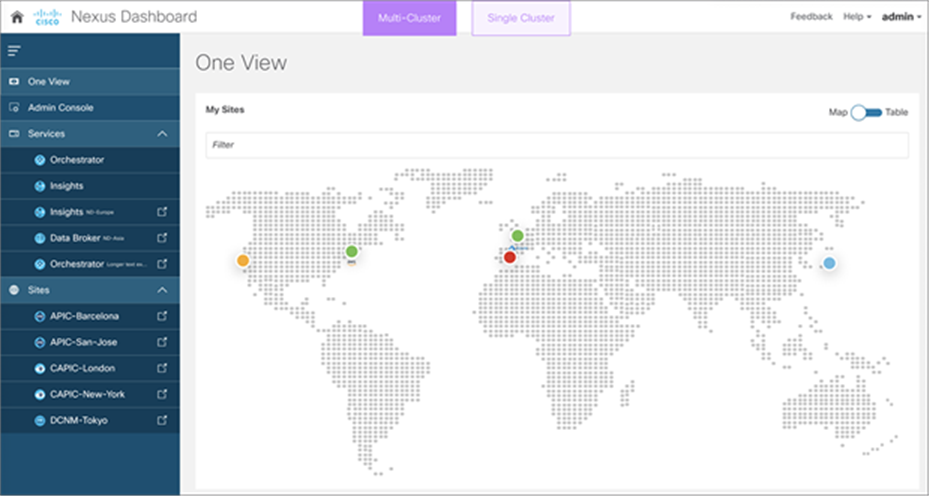
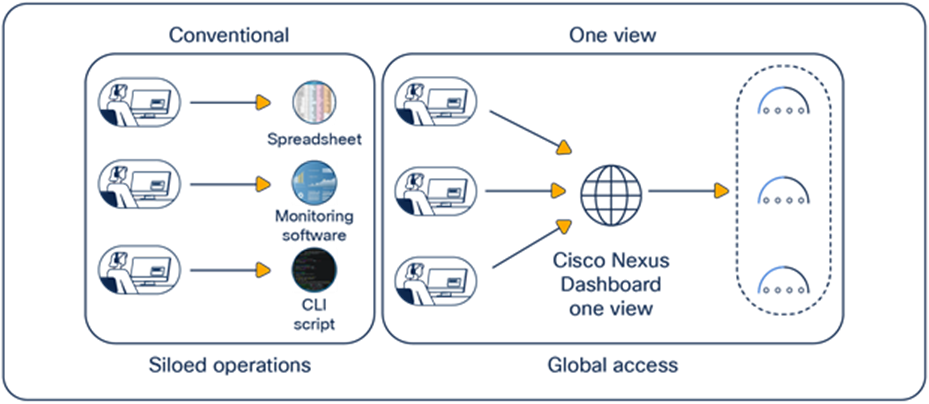
| Cisco Nexus Dashboard One View |
With Cisco Nexus Dashboard One View, operators seamlessly consume services they have access to, regardless of where the services are running. |
| Deploy Cisco Nexus Dashboard in any form factor—physical, virtual, or cloud |
|
| Jump start installation with prepackaged Cisco Nexus Dashboard Insights, Cisco Nexus Dashboard Orchestrator, Cisco Nexus Dashboard Fabric Controller, and Cisco Nexus Dashboard Data Broker services |
|
| Cloud-site onboarding |
Onboard and manage multicloud environments with site onboarding for Amazon AWS, Microsoft Azure, and Google Cloud |
| Air-gap support |
Offline customers can utilize Insight’s Advisory features to better identify risks to their infrastructure (PSIRTS, defects, EoX notices, field notices). |
Seamless operator experience powered by Cisco Nexus Dashboard
Too often the network operations team spends most of its time gathering troubleshooting data to triage and root cause an issue. The burden of tying together siloed insights from a fragmented operational toolkit often lies with the operations team. As the company’s data-center footprint extends from the on-premises data center to the cloud, and as modern application architectures become the de-facto standard, the operations team needs a unified operations toolchain with a seamless user experience to maintain and operate such complex environments.
Cisco Nexus Dashboard unifies these disparate toolsets and experiences for the operations teams to consume the rich and powerful capabilities of day-2 operations solutions and executes multisite policies from a single pane of glass. Unnecessary handoffs between toolchains and dealing with multiple portals and credentials to get to troubleshooting data and insights have become a thing of the past. An operator logs in once to Cisco Nexus Dashboard and is able to go straight to the Discover, Analyze, Remediate, Automate workflow from a single launchpad. Cisco Nexus Dashboard offers a powerful and rich set of capabilities, such as:
● Single sign-on (SSO): SSO powers the frictionless interaction between Cisco Nexus Dashboard and the hosted services. The operator logs in once and is able to switch seamlessly between services and also site controllers such as Cisco APIC, Cloud APIC, or NDFC.
● Unified operations platform: The Cisco Nexus Dashboard platform is a powerful unified platform capable of scaling out horizontally to accommodate application needs. With a modern microservices infrastructure services stack on a clustered architecture, the same underlying platform can be used to cohost the entire day-2 applications portfolio, thus reducing the burden of the underlying software and hardware lifecycle maintenance.
Cisco Nexus Dashboard
● Persona-based dashboard—Cisco Nexus Dashboard has two primary personas:
◦ The administrator, who is able to manage all the Cisco Nexus Dashboard platform infrastructure services and hardware from a single pane of glass. The administrator is also able to install, upgrade, and launch all services on the Cisco Nexus Dashboard platform. This role can set up common sites and services for the applications to use from a single pane of glass.
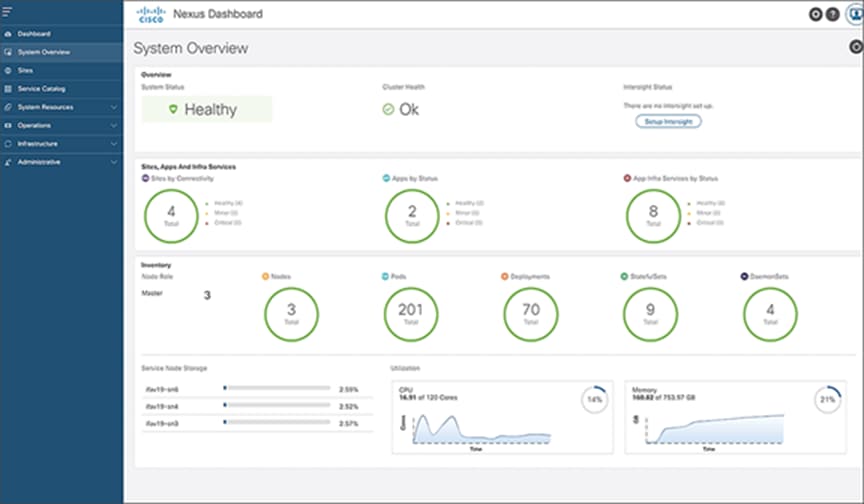
Administrator role—system overview
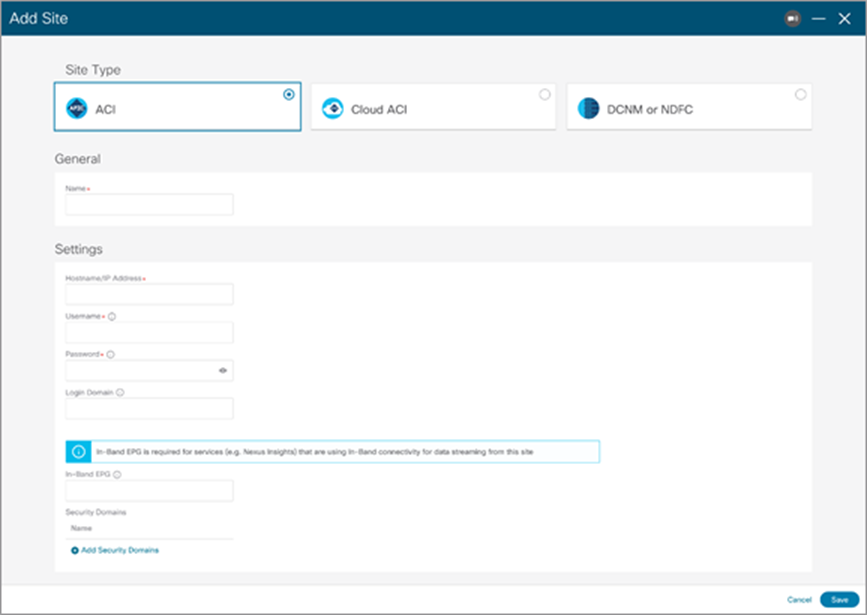
Set up common sites and services from a single pane of glass
The operator, who is able to get an aggregate view of the health of the sites and, with a single click, navigate to the Insights service, gain more information about critical anomalies, or scroll through the temporal view to get historical context. If the operator then needs to make changes to policy, they can easily switch to the Cisco Nexus Dashboard Orchestrator and roll out changes to multiple sites, including public cloud environments. All from a single portal—Cisco Nexus Dashboard.
● Common infrastructure services: Cisco Nexus Dashboard provides a host of common infrastructure services, such as common site onboarding, authentication domains, role-based access control (RBAC), notification services, and API services.
● Flexible deployment options: Cisco Nexus Dashboard portfolio comprises physical, virtual, and cloud form factors, giving customers unprecedented flexibility while deploying their operations infrastructure and at the same time ensuring a common and unified operator experience through a single pane of glass.
● Programmable infrastructure: Third-party automation tools are critical to improving reporting workflows and responding to issues encountered by distributed workloads. Cisco Nexus Dashboard has built-in integrations with many third-party services such as ServiceNow, one of the most prevalent IT service management platforms. With the ServiceNow integrations, NetOps and DevOps teams can open and track tickets from within Nexus Dashboard. From one portal, operations teams get visibility into the status of open tickets, resulting in the automation of troubleshooting for faster resolutions across fabrics.
● SR-MPLS with Nexus Dashboard Orchestrator: With Cisco Nexus Dashboard Orchestrator, SR-MPLS policies can be centrally automated across 5G telco cloud sites (central, regional, and edge data centers). Cisco Nexus Dashboard with Insights and Orchestrator services is the most comprehensive way to automate distributed data centers―overcoming the challenges of managing the infrastructure, applications, and data sources distributed over disparate locations.
With these services integrated in Cisco Nexus Dashboard, NetOps teams can achieve command and control over global network fabrics, optimizing performance and attaining insights into datacenter and cloud operations.
● Cisco Nexus Dashboard One View: Deploy and manage the Cisco Nexus Dashboard operations infrastructure at scale by presenting a single pane of glass through which to manage the operation’s infrastructure.
Cisco Nexus Dashboard One View
For detailed platform and compatibility support, refer to: https://www.cisco.com/c/dam/en/us/td/docs/Website/datacenter/day2ops/index.html.
Table 2. Platform support
| Cisco Nexus Dashboard |
Form factor |
Cluster scale |
Sites supported |
Applications supported |
| Release 2.0.1 |
Physical platform cluster |
7 |
Cisco ACI, NDFC |
NI, Cisco Network Assurance Engine (NAE), MSO |
| Release 2.0.2 |
Physical, virtual, and cloud form factor |
7 |
Cisco ACI, NDFC, public cloud |
NI, NAE (physical only) MSO |
| Release 2.1 |
Physical, virtual, and cloud form factor in cluster |
7 |
Cisco ACI, NDFC, public cloud |
Cisco Nexus Dashboard Orchestrator (NDO), Nexus Dashboard Insights, Nexus Dashboard Data Broker, ServiceNow |
| Release 2.2 |
Physical, virtual, and cloud form factor in cluster |
7 |
Cisco ACI, NDFC, public cloud |
Cisco Nexus Dashboard Orchestrator (NDO), Nexus Dashboard Insights, Nexus Dashboard Data Broker, ServiceNow, VMware vCenter, Cisco DNA Center |
| Release 2.3 |
Physical, virtual, and cloud form factor in cluster |
7 |
Cisco ACI, NDFC, public cloud |
Cisco Nexus Dashboard Orchestrator (NDO), Nexus Dashboard Insights, Nexus Dashboard Data Broker, ServiceNow, VMware vCenter, Cisco DNA Center |
For exact application versions and services co-hosting requirements, please refer to the compatibility matrix.
Licensing: There are no licensing requirements for Cisco Nexus Dashboard. For a guide to ordering, please refer to Ordering Guide.
Please refer to the sizing guide for physical and virtual cluster size guidelines.
Table 3. SE-CL-L3—(based on Cisco UCS M5 Server)—Cisco Nexus Dashboard platform cluster hardware specifications
| Hardware specifications |
Cisco Nexus Dashboard platform cluster node specifications |
| Memory |
256 G |
| Processors |
2* |
| Hard disk |
4* 2.4 TB each = 9.6 TB total |
| SSD |
400 G |
| NVMe |
1.6 TB |
| Power supply |
1050 Watts |
| Software |
Nd-uni-dk9.2.0.2.aiso/ nd-uni-dk9.2.1.iso |
Table 4. ND-CLUSTER-L4 (based on Cisco UCS M6 Server)—Cisco Nexus Dashboard platform cluster hardware specifications
| Hardware specifications |
Cisco Nexus Dashboard platform cluster node specifications |
| Memory |
256 GB |
| Processors |
1 |
| Hard disk |
4* 2.4 TB each = 9.6 TB total |
| SSD |
960 GB |
| NVMe |
1.6 TB |
| Power supply |
1050 Watts |
| Software |
Nd-uni-dk9.2.0.4.aiso/ nd-uni-dk9.2.1.iso |
Table 5. Virtual form factor requirements
| Hardware specifications |
Cisco Nexus Dashboard virtual node specifications |
| Memory |
64 G |
| Processors |
16 vCPUs |
| Hard disk |
550 G application nodes |
| SSD or NVMe |
3 TB for data nodes only |
| Software |
nd-uni-dk9-2.0.2.qcow2 nd-uni-dk9-2.0.2.ova nd-uni-dk9-2.1.qcow2 nd-uni-dk9-2.1.ova ESXI 6.5/7 |
Table 6. Amazon AWS cloud form factor requirements per node of Cisco Nexus Dashboard
| AWS native resources |
Cisco Nexus Dashboard cloud node specifications |
| Amazon EC2 Instance Type |
m5.4xlarge (recommended), m4.4xlarge |
| Amazon Elastic Block Store (EBS) |
100G gp2 SSD, 300G gp2 SSD |
| Amazon Simple Storage Service (S3) |
Standard S3 storage |
| Marketplace link |
https://aws.amazon.com/marketplace/pp/prodview-agdixxd5lgi6q |
Table 7. Microsoft Azure cloud form factor requirements per node of Cisco Nexus Dashboard
| Microsoft Azure resource name |
Resource type |
Minimum requirement |
| Instance type |
Compute |
Standard_D16s_v3 |
| Azure management disk |
Storage |
OS disk 50 GB |
| Azure data disk |
Storage |
Data disk [250/500 GB] |
| Virtual networks |
Network |
2 |
| Static public IP addresses |
Network |
3 |
| Total public IP addresses (static public IP addresses and dynamic public IP addresses) |
Network |
3 |
| Network security groups |
Network |
3 |
| Application security groups |
Network |
3 |
| Application gateways |
Network |
1 |
| Virtual machines |
Compute |
3 |
| Marketplace link |
||
Table 8. Supported applications on Cisco Nexus Dashboard
|
|
Cisco ACI |
Cisco NDFC |
Public cloud |
| Cisco Nexus Dashboard Release 2.0.1 |
Yes |
Yes |
No |
| Cisco Nexus Dashboard Release 2.0.2 |
Yes |
Yes |
Yes |
| Cisco Nexus Dashboard Release 2.1 |
Yes |
Yes |
Yes |
| Nexus Insights Release 5.0 on Nexus Dashboard |
Yes |
No |
No |
| Nexus Insights Release 5.1 on Nexus Dashboard |
Yes |
Yes |
No |
| Nexus Insights Release 6.0 on Nexus Dashboard** |
Yes |
Yes |
No |
| Cisco ACI Multi-Site Orchestrator or Cisco Nexus Dashboard Orchestrator on Nexus Dashboard |
Yes |
Yes |
Yes |
| Cisco Nexus Dashboard Data Broker |
Yes |
Yes |
N/A |
| VMware vCenter integration (onboarding) |
Yes |
Yes |
No |
| ServiceNow, Splunk |
All controllers |
||
| HashiCorp Terraform, Red Hat Ansible |
|||
For exact application versions and services co-hosting requirements, please refer to the compatibility matrix.
Table 9. Ordering information
| Part number |
Product description |
| SE-CL-L3 |
Cisco Nexus Dashboard platform cluster based on Cisco UCS M5 server |
| ND-CLUSTER-L4 |
Cisco Nexus Dashboard platform cluster based on Cisco UCS M6 server |
| SE-NODE-G2= |
Cisco Nexus Dashboard platform node based on Cisco UCS M5 server |
| ND-NODE-L4= |
Cisco Nexus Dashboard platform node based on Cisco UCS M6 server |
| ND-UNI-DK9-2.0 |
Cisco Nexus Dashboard software |
| ND-VIRTUAL |
Cisco Nexus Dashboard virtual platform (OVA, KVM) |
Table 10. Cisco Nexus Dashboard third-party ecosystem
| Partner |
Integration capability |
Applications link |
| ServiceNow |
Ticketing automation for Cisco Nexus Dashboard Insights anomalies and advisories, including the ability to filter specific categories and severity |
Cisco Nexus Dashboard Insights App for ServiceNow Platform |
| ServiceNow incident visibility and management on Cisco Nexus Dashboard |
ServiceNow App for Cisco Nexus Dashboard |
|
| Visibility into network and application entities and policies defined on the Cisco Nexus Dashboard Orchestrator and business service mapping |
Cisco ACI/Nexus Dashboard Orchestrator App for ServiceNow Platform |
|
| Splunk |
Real-time and historical monitoring (organization-specific KPIs and dashboards), troubleshooting, cross-tier correlation, and alerting automation for Cisco Nexus Dashboard Insights |
Cisco Nexus Dashboard Insights App for Splunk Cisco Nexus Dashboard Insights Add-on for Splunk |
| HashiCorp Terraform |
Terraform provider to support Cisco Nexus Dashboard Orchestrator Automation |
Terraform Provider for Nexus Dashboard Orchestrator Automation |
| Red Hat Ansible |
Ansible module to support Cisco Nexus Dashboard Orchestrator Automation |
Ansible Collection for Nexus Dashboard Orchestrator Automation |
| VMware vCenter |
Virtual Machine telemetry and health visibility |
Cisco Nexus Dashboard Insights application |
Cisco Nexus Dashboard platform clusters have a 90-day limited liability warranty.
Cisco environmental sustainability
Information about Cisco’s environmental sustainability policies and initiatives for our products, solutions, operations, and extended operations or supply chain is provided in the “Environment sustainability” section of Cisco’s Corporate Social Responsibility (CSR) Report.
Reference links to information about key environmental sustainability topics (mentioned in the “Environment sustainability” section of the CSR Report) are provided in the following table:
Table 11. Cisco Nexus Dashboard environmental sustainability
| Sustainability topic |
Reference |
| Information on product-material-content laws and regulations |
|
| Information on electronic waste laws and regulations, including products, batteries, and packaging |
Reference links to product-specific environmental sustainability information that is mentioned in relevant sections of this data sheet are provided in Table 11.
Table 12. Cisco Nexus Dashboard environmental sustainability
| Sustainability topic |
Reference |
| General |
|
| Eco-design compliance (EU ErP Lot, etc.) Environmental certifications (EPEAT, Energy Star, etc.) |
Table AA. Product compliance Table BB. Product compliance or Platform features/benefits |
| Power |
|
| Idle, typical, or max product power Hardware-enabled energy features |
Table CC. Product specifications Table DD. Platform features/benefits |
| Software-enabled energy features Power supply information Power calculator |
Table EE. Platform features/benefits Table FF. Product specifications Table GG. Product specifications |
| Material |
|
| Unit weight System weight (product + packaging) Recycled content |
Table HH. Product specifications Table II. Product specifications Table JJ. Product specifications |
Cisco makes the packaging data available for informational purposes only. It may not reflect the most current legal developments, and Cisco does not represent, warrant, or guarantee that it is complete, accurate, or up to date. This information is subject to change without notice.
Power your digital operations transformation with Cisco Nexus Dashboard
Are your operations teams tasked with delivering security, uptime, and business continuity on a complex data center infrastructure? Do they have the right tools that provide proactive change management and precise troubleshooting information tied together in a unified, easy-to-consume user experience? Start powering the transformation of the networking operations teams by standardizing on the Cisco Nexus Dashboard experience. Meet and exceed critical business mandates of agility and availability as you operate your secure, intent-based data center from Cisco Nexus Dashboard.
Flexible payment solutions to help you achieve your objectives
Cisco Capital makes it easier to get the right technology to achieve your objectives, enable business transformation, and help you stay competitive. We can help you reduce the total cost of ownership, conserve capital, and accelerate growth. In more than 100 countries, our flexible payment solutions can help you acquire hardware, software, services, and complementary third-party equipment in easy, predictable payments. Learn more.
Table 13. Document history
| New or revised topic |
Described in |
Date |
| First draft |
|
5/1/2021 |
| Second draft |
|
5/12/2021 |
| Third Draft |
|
12/15/2021 |
| Fourth Draft |
|
3/14/2022 |