管理ポータル
|
1 |
メニューアイコン |
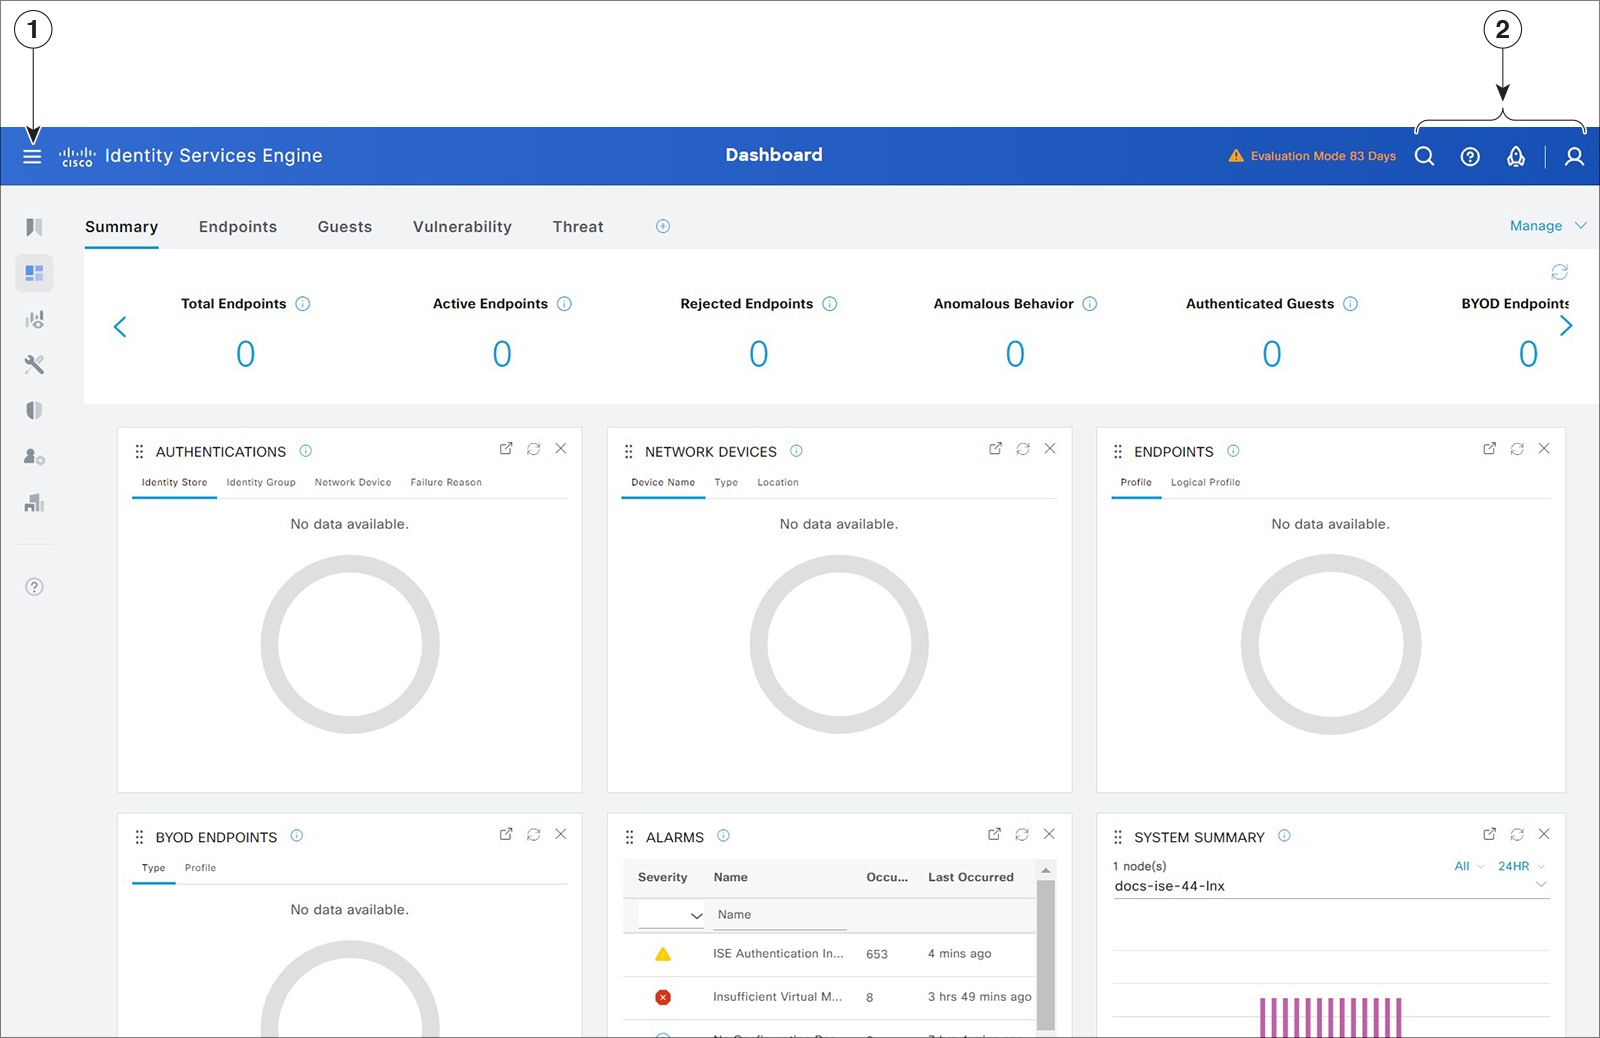
デフォルトでは、次のメニューオプションを含むペインがホームページの left サイドに表示されます。メニューアイコン( 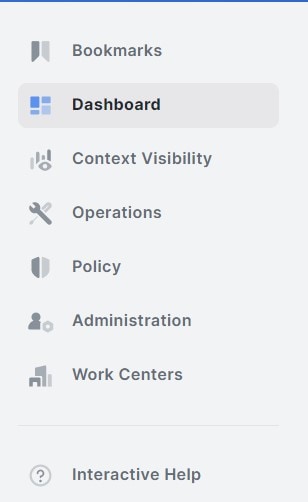
left ペインには、[ブックマーク(Bookmarks)] オプションもあります。それらのページをブックマークするには、最近表示した対応するページの横にある( leftペインが表示されているときにログアウトし、再度ログインすると、ペインは引き続き表示されます。ただし、ペインが非表示になった後にログアウトし、再度ログインした場合、ペインを再度表示するには、メニューアイコンをクリックする必要があります。 
left ペインのメニューオプションは次のとおりです。
|
|
2 |
右上のメニューアイコン |
|
インタラクティブヘルプ
インタラクティブヘルプを使用すると、簡単にタスクを完了するためのヒントとステップバイステップのガイダンスが提供され、ユーザーは Cisco ISE で効果的に作業することができます。
この機能はデフォルトで無効になっています。この機能を無効にするには、[メニュー(Menu)] アイコン(![]() )をクリックし、 を選択します。次に、[インタラクティブヘルプの有効化(Enable Interactive Help)] チェックボックスをオフにします。
)をクリックし、 を選択します。次に、[インタラクティブヘルプの有効化(Enable Interactive Help)] チェックボックスをオフにします。
[表示(Show)] ボタンをクリックして、[インタラクティブヘルプ(Interactive Help)] メニューを表示します。
Google Chrome シークレットウィンドウから Cisco ISE 管理者ポータルにアクセスする場合、インタラクティブヘルプを表示してアクセスするには、サードパーティの Cookie を有効にする必要があります。「Third-party cookie controls in Incognito mode」を参照してください。
カスタマー エクスペリエンス アンケート
Cisco ISE では管理ポータル内でユーザーに顧客満足度アンケートが提示されます。顧客満足度を定期的に評価することで、シスコではお客様の Cisco ISE のエクスペリエンスをより深く理解し、何が良好に機能しているかを追跡し、改善すべき領域を特定することができます。Cisco ISE 管理ポータルにログインすると、ダイアログボックスにアンケートが表示されます。アンケートを送信すると、その後 90 日間は別のアンケートは表示されません。
Cisco ISE アンケート機能は、すべての Cisco ISE 展開およびすべてのユーザーに対してデフォルトで有効になっています。この機能の設定は、管理ポータルの ページの [ISEアンケート(ISE Surveys)] 領域にあります。この機能を使用するには、*.qualtrics.com の URL にアクセスする必要があります。
Cisco ISE ユーザーは、次の手順を実行してアンケート機能を無効にすることができます。
-
Cisco ISE 管理ポータルの右上隅にあるプロファイルアイコンをクリックします。
-
[アカウント設定(Account Settings)] をクリックします。
-
[Cisco ISEの改善に役立つ顧客体験調査にご参加ください(Take customer experience surveys to help improve Cisco ISE)] チェックボックスをオフにします。
ユーザーまたは Cisco ISE 展開に対して Cisco ISE アンケート機能を無効にすると、この機能は再度有効にするまで無効のままになります。
デフォルトモードまたはダークモードの適用
手順
|
ステップ 1 |
右上隅にある |
|
ステップ 2 |
[アカウント設定(Account Settings)] をクリックします。 |
|
ステップ 3 |
[テーマ(Theme)] 領域で、[デフォルトモード(Default Mode)] または [ダークモード(Dark Mode)] のオプションボタンをクリックします。 |
|
ステップ 4 |
[保存(Save)] をクリックします。 Cisco ISE は、選択した表示モードをブラウザストレージにキャッシュします。したがって、表示モードを保存するブラウザキャッシュが使用できない次のシナリオでは、Cisco ISE GUI が数秒間ライトモードで表示されます。
|
Cisco ISE ホームのダッシュボード
Cisco ISE ホームダッシュボードには、効果的なモニタリングおよびトラブルシューティングに必要不可欠な、統合された相関性のあるライブ統計データが表示されます。ダッシュボード要素には通常、24 時間のアクティビティが表示されます。次の図に、Cisco ISE ダッシュボードで使用できる情報を例示します。Cisco ISE ダッシュボードデータはプライマリポリシー管理ノード(PAN)のポータルでのみ表示されます。
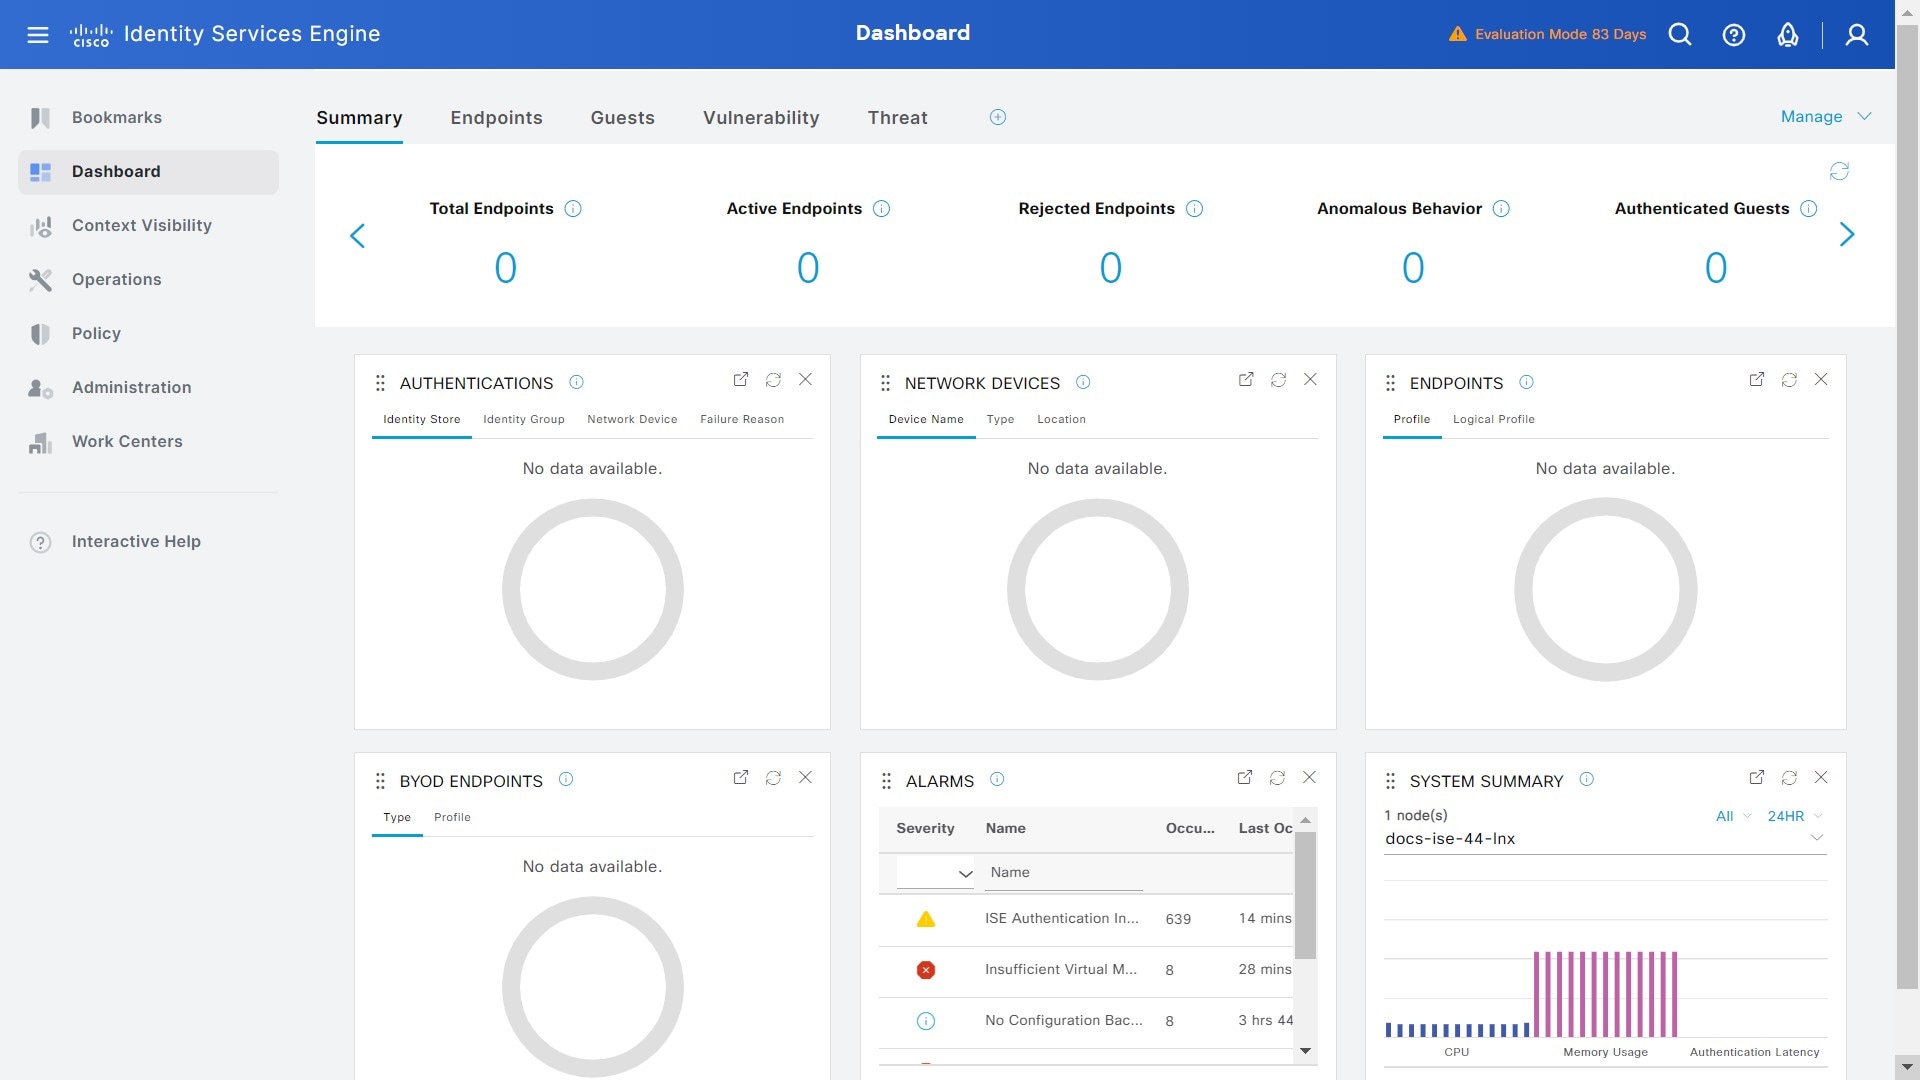
[ホーム(Home)] ページには、Cisco ISE データを表示する 5 つのデフォルトのダッシュボードがあります。これらの各ダッシュボードには、複数の事前定義ダッシュレットがあります。
-
[概要(Summary)]:このダッシュボードには、線形の [メトリック(Metrics)] ダッシュレット、円グラフダッシュレット、およびリストダッシュレットがあります。[メトリック(Metrics)] ダッシュレットは設定できません。このダッシュボードにはデフォルトでは、[ステータス(Status)]、[エンドポイント(Endpoints)]、[エンドポイントカテゴリ(Endpoint Categories)]、[ネットワークデバイス(Network Devices)] があります。
-
[エンドポイント(Endpoints)]:このダッシュボードにはデフォルトでは、[ステータス(Status)]、[エンドポイント(Endpoints)]、[(エンドポイントカテゴリ(Endpoint Categories)]、[ネットワークデバイス(Network Devices)] があります。
-
[ゲスト(Guests)]:このダッシュボードには、ゲストユーザータイプ、ログイン失敗、およびアクティビティのロケーションに関する情報を提供するダッシュレットがあります。
-
[脆弱性(Vulnerability)]:このダッシュボードには、脆弱性サーバーが Cisco ISE にレポートする情報が表示されます。
-
[脅威(Threat)]:このダッシュボードには、Cisco ISE に送信された脅威サーバーのレポートの情報が表示されます。
ホーム ダッシュボードの設定
ホームページダッシュボードをカスタマイズするには、ページの右上隅にある [管理(Manage)] アイコンをクリックします。

ドロップダウンリストには、次のオプションが表示されます。
-
[新しいダッシュボードの追加(Add New Dashboard)] では、新しいダッシュボードを追加できます。表示されたフィールドに値を入力し、[適用(Apply)] をクリックします。
-
[ダッシュレットの追加(Add Dashlet(s))] は、使用可能なダッシュレットのリストを含むダイアログボックスを表示します。ダッシュレットをダッシュボードに追加または削除するには、ダッシュレット名の横にある [追加(Add)] または [削除(Remove)] をクリックします。
-
[エクスポート(Export)] を選択すると、選択されているホームビューを PDF に保存します。
-
[レイアウトテンプレート(Layout Template)] を選択すると、このビューに表示されるカラムの数を設定します。
-
[ダッシュボード管理(Manage Dashboards)] には、次の 2 つのオプションがあります。
-
[デフォルトダッシュボードとしてマーク(Mark As Default Dashboard)]:このオプションを選択すると、[ホーム(Home)] を選択したときに現在のダッシュボードがデフォルトビューになります。
-
[すべてのダッシュボードをリセット(Reset All Dashboards)]:このオプションを使用すると、すべてのダッシュボードもリセットし、すべてのホームダッシュボードの設定を削除します。
-
[コンテキストの可視性(Context Visibility)] のビュー
[コンテキストの可視性(Context Visibility)] ウィンドウの構造はホームページに似ていますが、[コンテキストの可視性(Context Visibility)] ウィンドウでは次の点が異なります。
-
表示データをフィルタリングするときに、現在のコンテキストを維持する(ブラウザ ウィンドウ)
-
より細かなカスタマイズが可能である
-
エンドポイント データを中心としている
プライマリ PAN からのコンテキストの可視性データのみを表示できます。
[コンテキストの可視性(Context Visibility)] ウィンドウのダッシュレットには、エンドポイントと、エンドポイントから NAD への接続に関する情報が表示されます。現在表示されている情報は、各ウィンドウのダッシュレットの下にあるデータのリストの内容に基づいています。各ウィンドウには、タブの名前に基づいてエンドポイントデータが表示されます。データをフィルタリングすると、リストとダッシュレットの両方が更新されます。データをフィルタリングするには、1 つ以上の円グラフの特定部分をクリックするか、表で行をフィルタリングするか、またはこれらの操作を組み合わせて実行します。複数のフィルタを選択した場合、フィルタ結果は加算的になります。これはカスケード フィルタと呼ばれます。これにより、ドリルダウンして特定のデータを見つけることができます。また、リストでエンドポイントをクリックして、そのエンドポイントの詳細ビューを表示することもできます。
アカウンティングの開始と更新の情報が Cisco ISE に確実に送信されるように、ネットワーク アクセス デバイス(NAD)でアカウンティングの設定を有効にすることを推奨します。
Cisco ISE では、アカウンティングが有効になっている場合にのみ、最新の IP アドレス、セッションのステータス( [接続(Connected)]、 [切断(Disconnected)]、または [拒否(Rejected)])、エンドポイントの非アクティブな日数などのアカウンティング情報を収集できます。この情報は、Cisco ISE 管理ポータルの [ライブログ(Live Logs)]、[ライブセッション(Live Sessions)]、および [コンテキストの可視性(Context Visibility)] の各ウィンドウに表示されます。NAD でアカウンティングが無効になっている場合、[ライブセッション(Live Sessions)]、[ライブログ(Live Logs)]、および [コンテキストの可視性(Context Visibility)] の各ウィンドウ間でアカウンティング情報が欠落しているか、間違っているか、または一致していない可能性があります。
[コンテキストの可視性(Context Visibility)] の下には、4 つのメインメニューオプションがあります。
-
[エンドポイント(Endpoints)]:デバイスのタイプ、コンプライアンス ステータス、認証タイプ、ハードウェア インベントリなどに基づいて表示するエンドポイントをフィルタ処理できます。詳細については、ハードウェア ダッシュボードを参照してください。

(注)
Cisco ISE 管理ポータルのホームページで使用可能な [可視性の設定(Visibility Setup)] ワークフローでは、エンドポイント検出用の IP アドレス範囲のリストを追加できます。このワークフローの設定後に Cisco ISE はエンドポイントを認証しますが、設定した IP アドレス範囲内に含まれていないエンドポイントは、 ウィンドウと [エンドポイント(Endpoints)] のリストページ()に表示されません。
-
[ユーザー(Users)]:ユーザー ID ソースからのユーザーベースの情報を表示します。
ユーザー名またはパスワード属性が変更されると、認証ステータスが変更された時点で [ユーザー(Users)] ウィンドウに反映されます。
Microsoft Active Directory でユーザー名が変更されると、再認証後すぐに [ユーザー(Users)] ウィンドウに更新された変更が表示されます。
Microsoft Active Directory で電子メール、電話番号、部門など、その他の属性が変更されると、再認証から 24 時間後に [ユーザー(Users)] ウィンドウに更新された属性が表示されます。 (注)
AD からのユーザー属性の更新は、Active Directory プローブで設定されている間隔によって異なります。詳細については、「Active Directory プローブ」を参照してください。
-
[ネットワークデバイス(Network Devices)]:このウィンドウには、接続しているエンドポイントがある NAD のリストが表示されます。任意の NAD について、対応する [エンドポイント数(Number of endpoints)] 列に表示されるエンドポイントの数をクリックします。その NAD によってフィルタ処理されたすべてのデバイスをリストしたウィンドウが表示されます。
(注)
ネットワークデバイスに SNMPv3 パラメータを設定した場合、Cisco ISE モニタリングサービス()によって提供される [ネットワークデバイスセッションステータス概要(Network Device Session Status Summary)] レポートを生成できません。ネットワーク デバイスが SNMPv1 または SNMPv2c パラメータを使用して設定されている場合は、このレポートを正常に生成できます。
-
[アプリケーション(Application)]:このウィンドウを使用して、インストールされている特定のアプリケーションがあるエンドポイントの数を識別します。結果は、グラフ形式と表形式で表示されます。グラフ表示は、比較分析に役立ちます。たとえば、Google Chrome ソフトウェアを使用してエンドポイントの数をバージョン、ベンダー、カテゴリ(フィッシング詐欺対策、ブラウザなど)と共に、表や棒グラフで確認することができます。詳細については、「アプリケーションタブ」を参照してください。
[コンテキストの可視性(Context Visibility)] ウィンドウの新しいタブを作成し、カスタムリストを作成して、さらにフィルタリングを行います。カスタムビューではダッシュレットはサポートされていません。
ダッシュレット内の円形グラフのセクションをクリックすると、そのダッシュレットからフィルタ処理されたデータを含む新しいウィンドウが表示されます。この新しいウィンドウから、ビューに表示するデータのフィルタリングの説明に従って、表示されたデータを引き続きフィルタ処理できます。
エンドポイントデータを特定するための [コンテキストの可視性(Context Visibility)] ウィンドウの使用に関する詳細については、Cisco YouTube ビデオ(https://www.youtube.com/watch?v=HvonGhrydfg)を参照してください。
コンテキストの可視性の属性
コンテキストの可視性の属性を提供するシステムとサービスでは、同じ属性名に異なる値を使用していることがよくあります。次に、いくつかの例を示します。
オペレーティング システム
-
OperatingSystem:ポスチャ オペレーティング システム。
-
operating-system:NMAP オペレーティングシステム。
-
operating-system-result:プロファイラ統合オペレーティングシステム。
(注) |
Cisco ISE でエンドポイントに複数のプローブを有効にした場合、[コンテキストの可視性(Context Visibility)] ページに表示されるエンドポイントのオペレーティングシステムのデータにいくつかの不一致が生じることがあります。 |
ポータル名
-
Portal.Name:デバイス登録が有効な場合のゲストポータル名。
-
PortalName:デバイス登録が無効な場合のゲスト ポータル名。
ポータルユーザー
-
User-Name:RADIUS 認証のユーザー名。
-
GuestUserName:ゲストユーザー名。
-
PortalUser:ポータルユーザー名。
アプリケーション ダッシュボード
![[コンテキストの可視性アプリケーション(Context Visibility Application)] タブ](/content/dam/en/us/td/i/300001-400000/350001-360000/356001-357000/356762.jpg)
|
ラベル |
説明 |
|||||
|---|---|---|---|---|---|---|
|
1 |
[要約(Summary)] タブは、デフォルトでホームページに表示されます。棒グラフを含む [アプリケーション カテゴリ(Application Categories)] ダッシュレットが表示されます。アプリケーションは 13 のカテゴリに分類されます。これらのカテゴリに属さないアプリケーションは、[未分類(Unclassified)] としてグループ化されます。 利用可能なカテゴリは、[マルウェア対策(Anti-Malware)]、[フィッシング対策(Antiphishing)]、[バックアップ(Backup)]、[ブラウザ(Browser)]、[データ漏洩防止(Data Loss Prevention)]、[データ ストレージ(Data Storage)]、[暗号化(Encryption)]、[ファイアウォール(Firewall)]、[メッセンジャ(Messenger)]、[パッチ管理(Patch Management)]、[パブリック ファイル共有(Public File Sharing)]、[仮想マシン(Virtual Machine)]、[VPN クライアント(VPN Client)] です。 |
|||||
|
2 |
各バーは、分類されたカテゴリに対応します。各バーの上にマウスを置くと、選択したアプリケーションカテゴリに対応するアプリケーションとエンドポイントの合計数が表示されます。 |
|||||
|
3 |
分類されたカテゴリに該当するアプリケーションとエンドポイントは青色で表示されます。未分類のアプリケーションとエンドポイントはグレーで表示されます。分類されたカテゴリバーまたは分類されていないカテゴリバーの上にマウスを置くと、そのカテゴリに属するアプリケーションとエンドポイントの合計数が表示されます。[分類済み(Classified)] をクリックして、ウィンドウ内の棒グラフと表で結果を表示できます。[未分類(Unclassified)] をクリックすると、ウィンドウ内の棒グラフが無効になり(グレー表示)、表に結果が表示されます。 |
|||||
|
4 |
アプリケーションとエンドポイントは、選択されたフィルタに基づいて表示されます。異なるフィルタをクリックすると、パンくずリストを表示できます。[すべてのフィルタをクリア(Clear All Filters)] の順にクリックして、すべてのフィルタを削除できます。 |
|||||
|
5 |
複数のバーをクリックすると、対応する分類されたアプリケーションとエンドポイントが表に表示されます。たとえば、[マルウェア対策(Antimalware )] および [パッチ管理(Patch Management)] カテゴリを選択すると、次の結果が表示されます。 |
|||||
| アプリケーション | バージョン | ベンダー | カテゴリ | アプリケーション OS | このソフトウェアで使用するエンドポイント | |
|
Gatekeeper |
9.9.5 |
Apple Inc. |
マルウェア対策 |
windows 7 64 ビット、mac osx 10.10、mac osx 8、mac osx 9 | 5 | |
|
Gatekeeper |
10.9.5 |
Apple Inc. |
マルウェア対策 |
windows 8 64 ビット、mac osx 10.10 | 3 | |
|
ソフトウェア更新 |
2.3 |
Apple Inc. |
パッチ管理 |
windows 7 64 ビット、mac osx 10.10、mac osx 8、mac osx 9 |
5 |
|
|
6 |
表の [このソフトウェアで使用するエンドポイント(Endpoints With This Software)] 列のエンドポイントをクリックして、Mac アドレス、NAD IP アドレス、NAD ポート ID/SSID、IPv4 アドレスなどのエンドポイントの詳細を表示します。 |
|||||
|
7 |
アプリケーションのコンプライアンス条件と修復を作成するには、アプリケーション名を選択し、[ポリシー アクション(Policy Actions)] ドロップダウンリストから [アプリケーション コンプライアンスの作成(Create App Compliance)] オプションを選択します。 |
|||||
ハードウェア ダッシュボード
[コンテキストの可視性(context visibility)] の下の [エンドポイント ハードウェア(endpoint hardware)] タブは、短期間にエンドポイント ハードウェア インベントリ情報を収集、分析、およびレポートするのに役立ちます。メモリ容量が小さいエンドポイントの検出や、エンドポイントの BIOS モデル/バージョンの検出など、情報を収集することができます。これらの結果に基づいて、メモリ容量を増やしたり、BIOS バージョンをアップグレードすることができます。アセットの購入を計画する前に、要件を評価することができます。リソースを適時に交換することができます。モジュールをインストールしたりエンドポイントとやりとりすることなく、この情報を収集できます。要約すると、アセットのライフサイクルを効果的に管理できます。
(注) |
ハードウェア インベントリ データは、ISE GUI に表示されるまでに 120 秒かかります。ハードウェア インベントリ データは、ポスチャ準拠および非準拠の状態について収集されます。 |
ページには、[製造者(Manufacturers)] および [エンドポイント使用率(Endpoint Utilizations)] ダッシュレットが表示されます。これらのダッシュレットは、選択されたフィルタに基づく変更を反映します。[製造者(Manufacturers)] ダッシュレットには、Windows および Mac OS が搭載されたエンドポイントのハードウェア インベントリの詳細が表示されます。[エンドポイント使用率(Endpoint Utilizations)] ダッシュレットには、エンドポイントの CPU、メモリ、およびディスク使用率が表示されます。3 つのオプションのいずれかを選択すると、利用率をパーセンテージで表示できます。
-
[CPU 使用率が n% を超えるデバイス(Devices With Over n% CPU Usage)]
-
[メモリ使用率が n% を超えるデバイス(Devices With Over n% Memory Usage)]
-
[ディスク使用率が n% を超えるデバイス(Devices With Over n% Disk Usage)]
(注) |
|
エンドポイントとその接続された外部デバイスのハードウェア属性は表形式で表示されます。次のハードウェア属性が表示されます。
-
MAC アドレス
-
BIOS 製造元
-
BIOS シリアル番号
-
BIOS モデル
-
接続デバイス
-
CPU 名
-
CPU 速度(GHz)
-
CPU 使用率(%)
-
コア数
-
プロセッサ数
-
メモリサイズ(GB)
-
メモリ使用率(%)
-
内部ディスクの合計サイズ(GB)
-
内部ディスクの合計フリーサイズ(GB)
-
内部ディスクの合計使用率(%)
-
内部ディスク数
-
NAD ポート ID
-
ステータス
-
ネットワークデバイス名
-
Location
-
UDID
-
IPv4 アドレス
-
ユーザー名
-
ホスト名
-
OS タイプ
-
異常な動作
-
エンドポイントプロファイル
-
説明
-
エンドポイントタイプ
-
ID グループ
-
登録日
-
ID ストア
-
許可プロファイル
エンドポイントに対応する [接続デバイス(Attached Devices)] 列の番号をクリックすると、現在エンドポイントに接続されている USB デバイスの名前、カテゴリ、製造元、タイプ、製品 ID、およびベンダー ID を表示できます。
(注) |
Cisco ISE はクライアントのシステムのハードウェア属性をプロファイリングしますが、Cisco ISE がプロファイリングしないハードウェア属性がいくつか存在することがあります。これらのハードウェア属性は、[ハードウェア コンテキストの可視性(Hardware Context Visibility)] ページに表示されないことがあります。 |
ハードウェア インベントリ データの収集間隔は、 ページで制御できます。デフォルトの間隔は 5 分です。
ダッシュレット
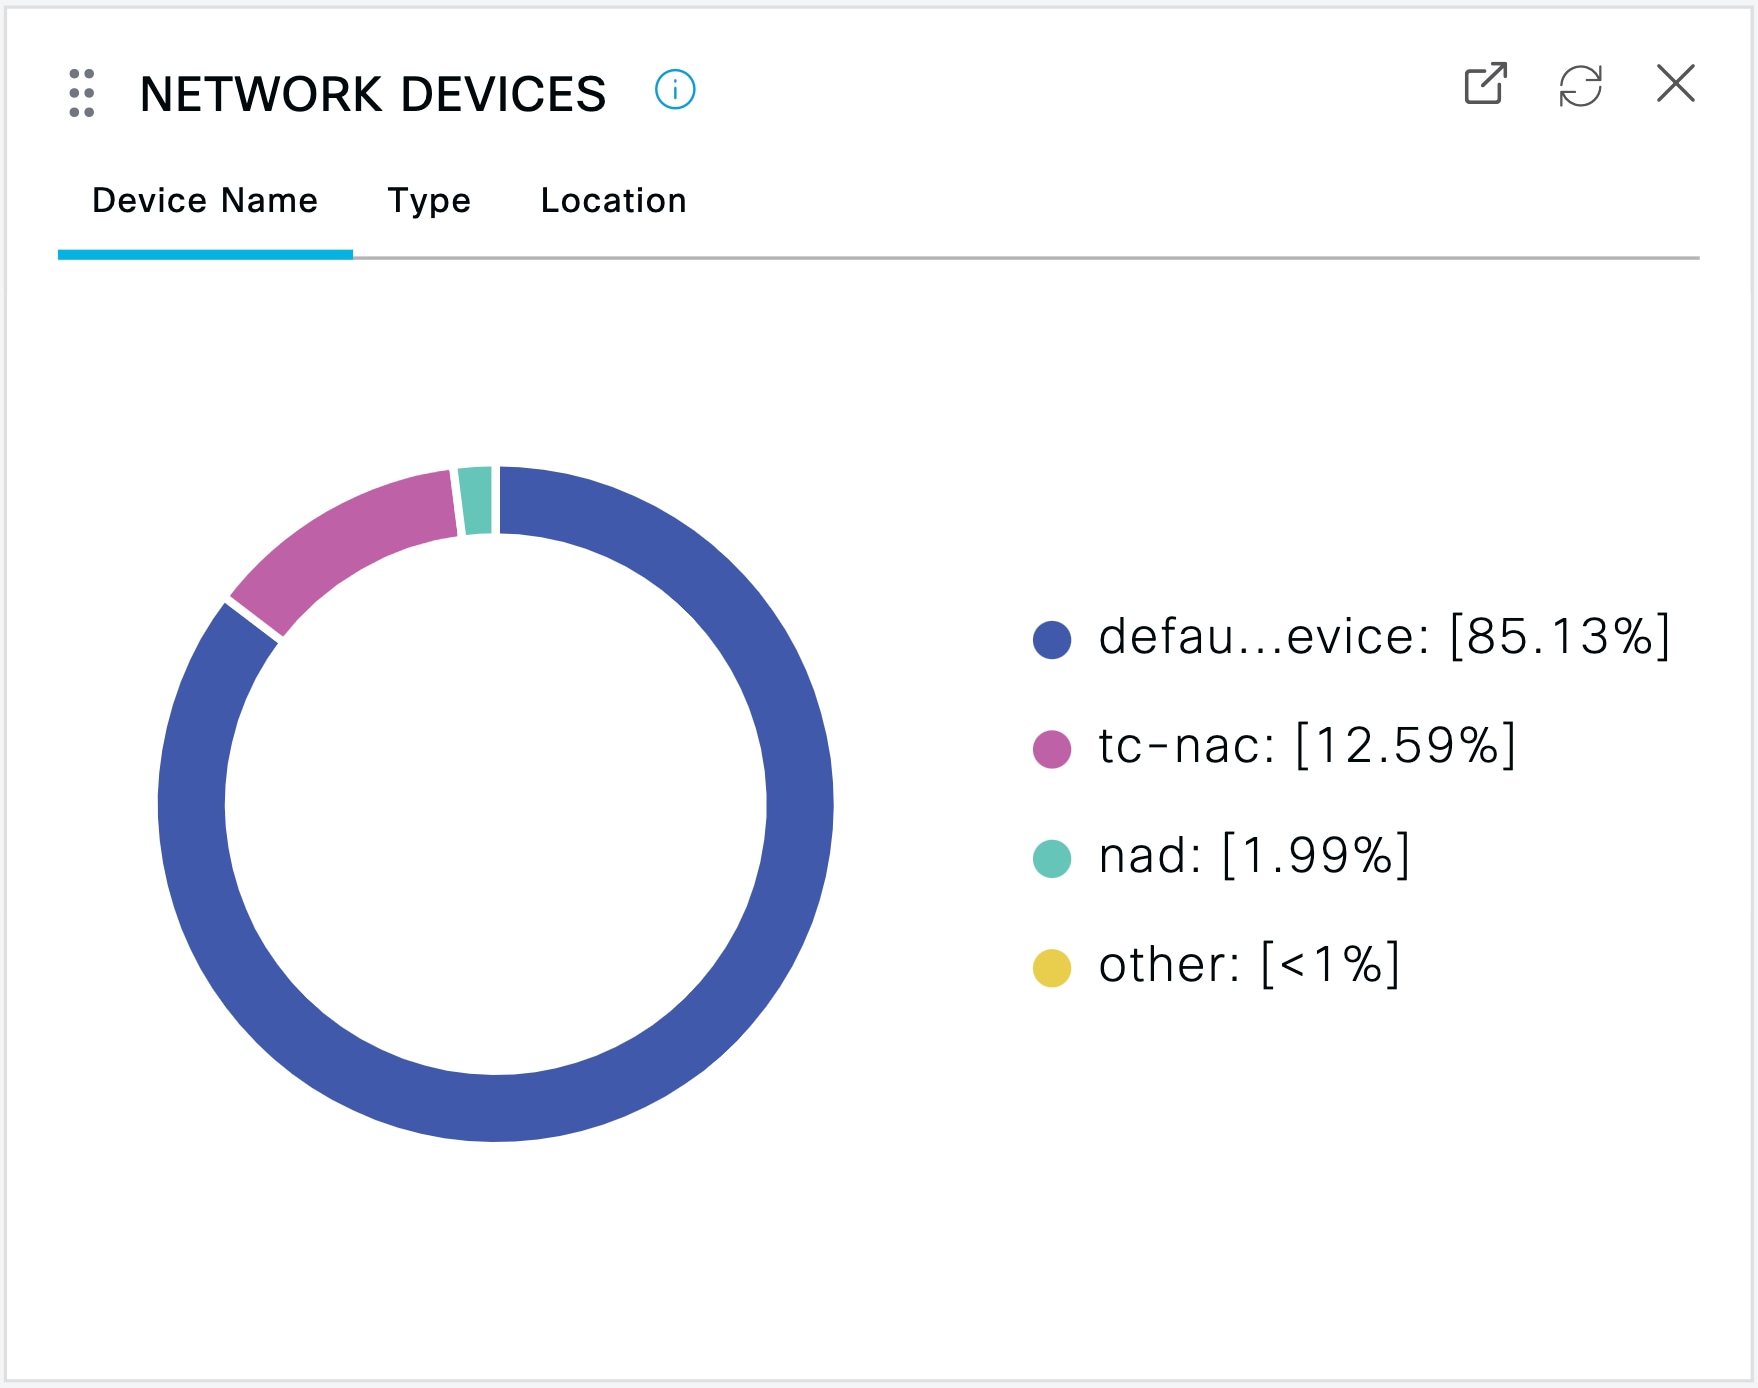
次のイメージは、ダッシュレットの例です。
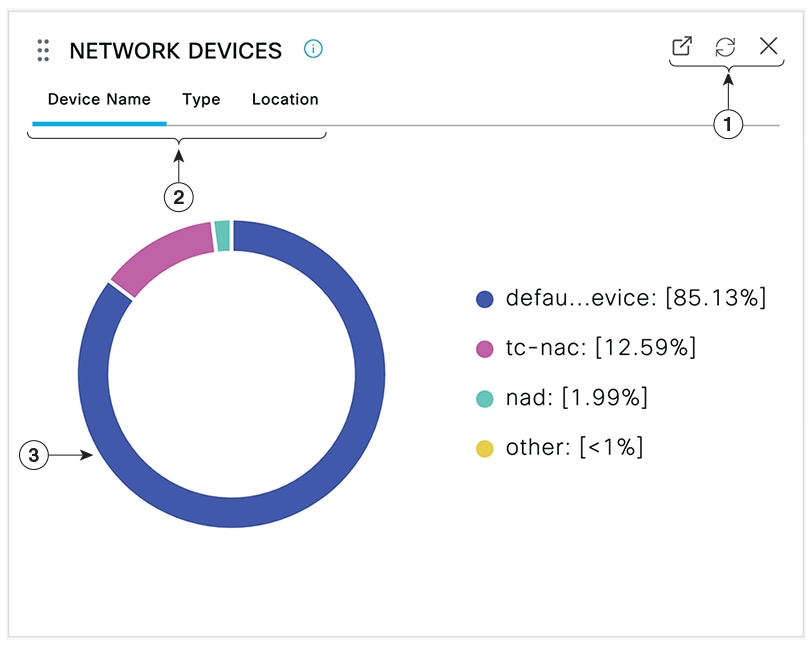
-
[新しいウィンドウを開く(Open New Window)] アイコンにより、新しいブラウザウィンドウでこのダッシュレットを開きます。円グラフが更新されます。このダッシュレットを削除するには、[X] をクリックします。このオプションは、ホームページでのみ使用できます。[コンテキストの可視性(Context Visibility)] ウィンドウでダッシュレットを削除するには、画面右上隅にある歯車のシンボルを使用します。
-
一部のダッシュレットには異なるカテゴリのデータが表示されます。カテゴリをクリックすると、そのデータセットの円グラフが表示されます。
-
円グラフには、選択したデータが表示されます。円グラフの 1 つのセグメントをクリックすると、新しいタブが開き、その円グラフセグメントに基づいてフィルタリングされたデータが表示されます。
ホームページダッシュボードの円グラフのセクションをクリックすると、新しいブラウザウィンドウでグラフを開きます。新しいウィンドウには、クリックした円グラフのセクションでフィルタリングされたデータが表示されます。
[コンテキストの可視性(Context Visibility)] ウィンドウで円グラフのセクションをクリックすると、表示されるデータはフィルタリングされますが、コンテキストは変更されません。フィルタリングされたデータは、同じブラウザウィンドウで表示されます。
ビューに表示するデータのフィルタリング
[コンテキストの可視性(Context Visibility)] ウィンドウでダッシュレットをクリックすると、対応するデータがクリックした項目でフィルタ処理されて表示されます。たとえば、円グラフのセクションをクリックすると、選択したセクションのデータがフィルタ処理されて表示されます。
[ネットワークデバイス(Network Devices)] ダッシュレットで defau...evice をクリックすると、次のイメージに示すように、新しいウィンドウにデータが表示されます。
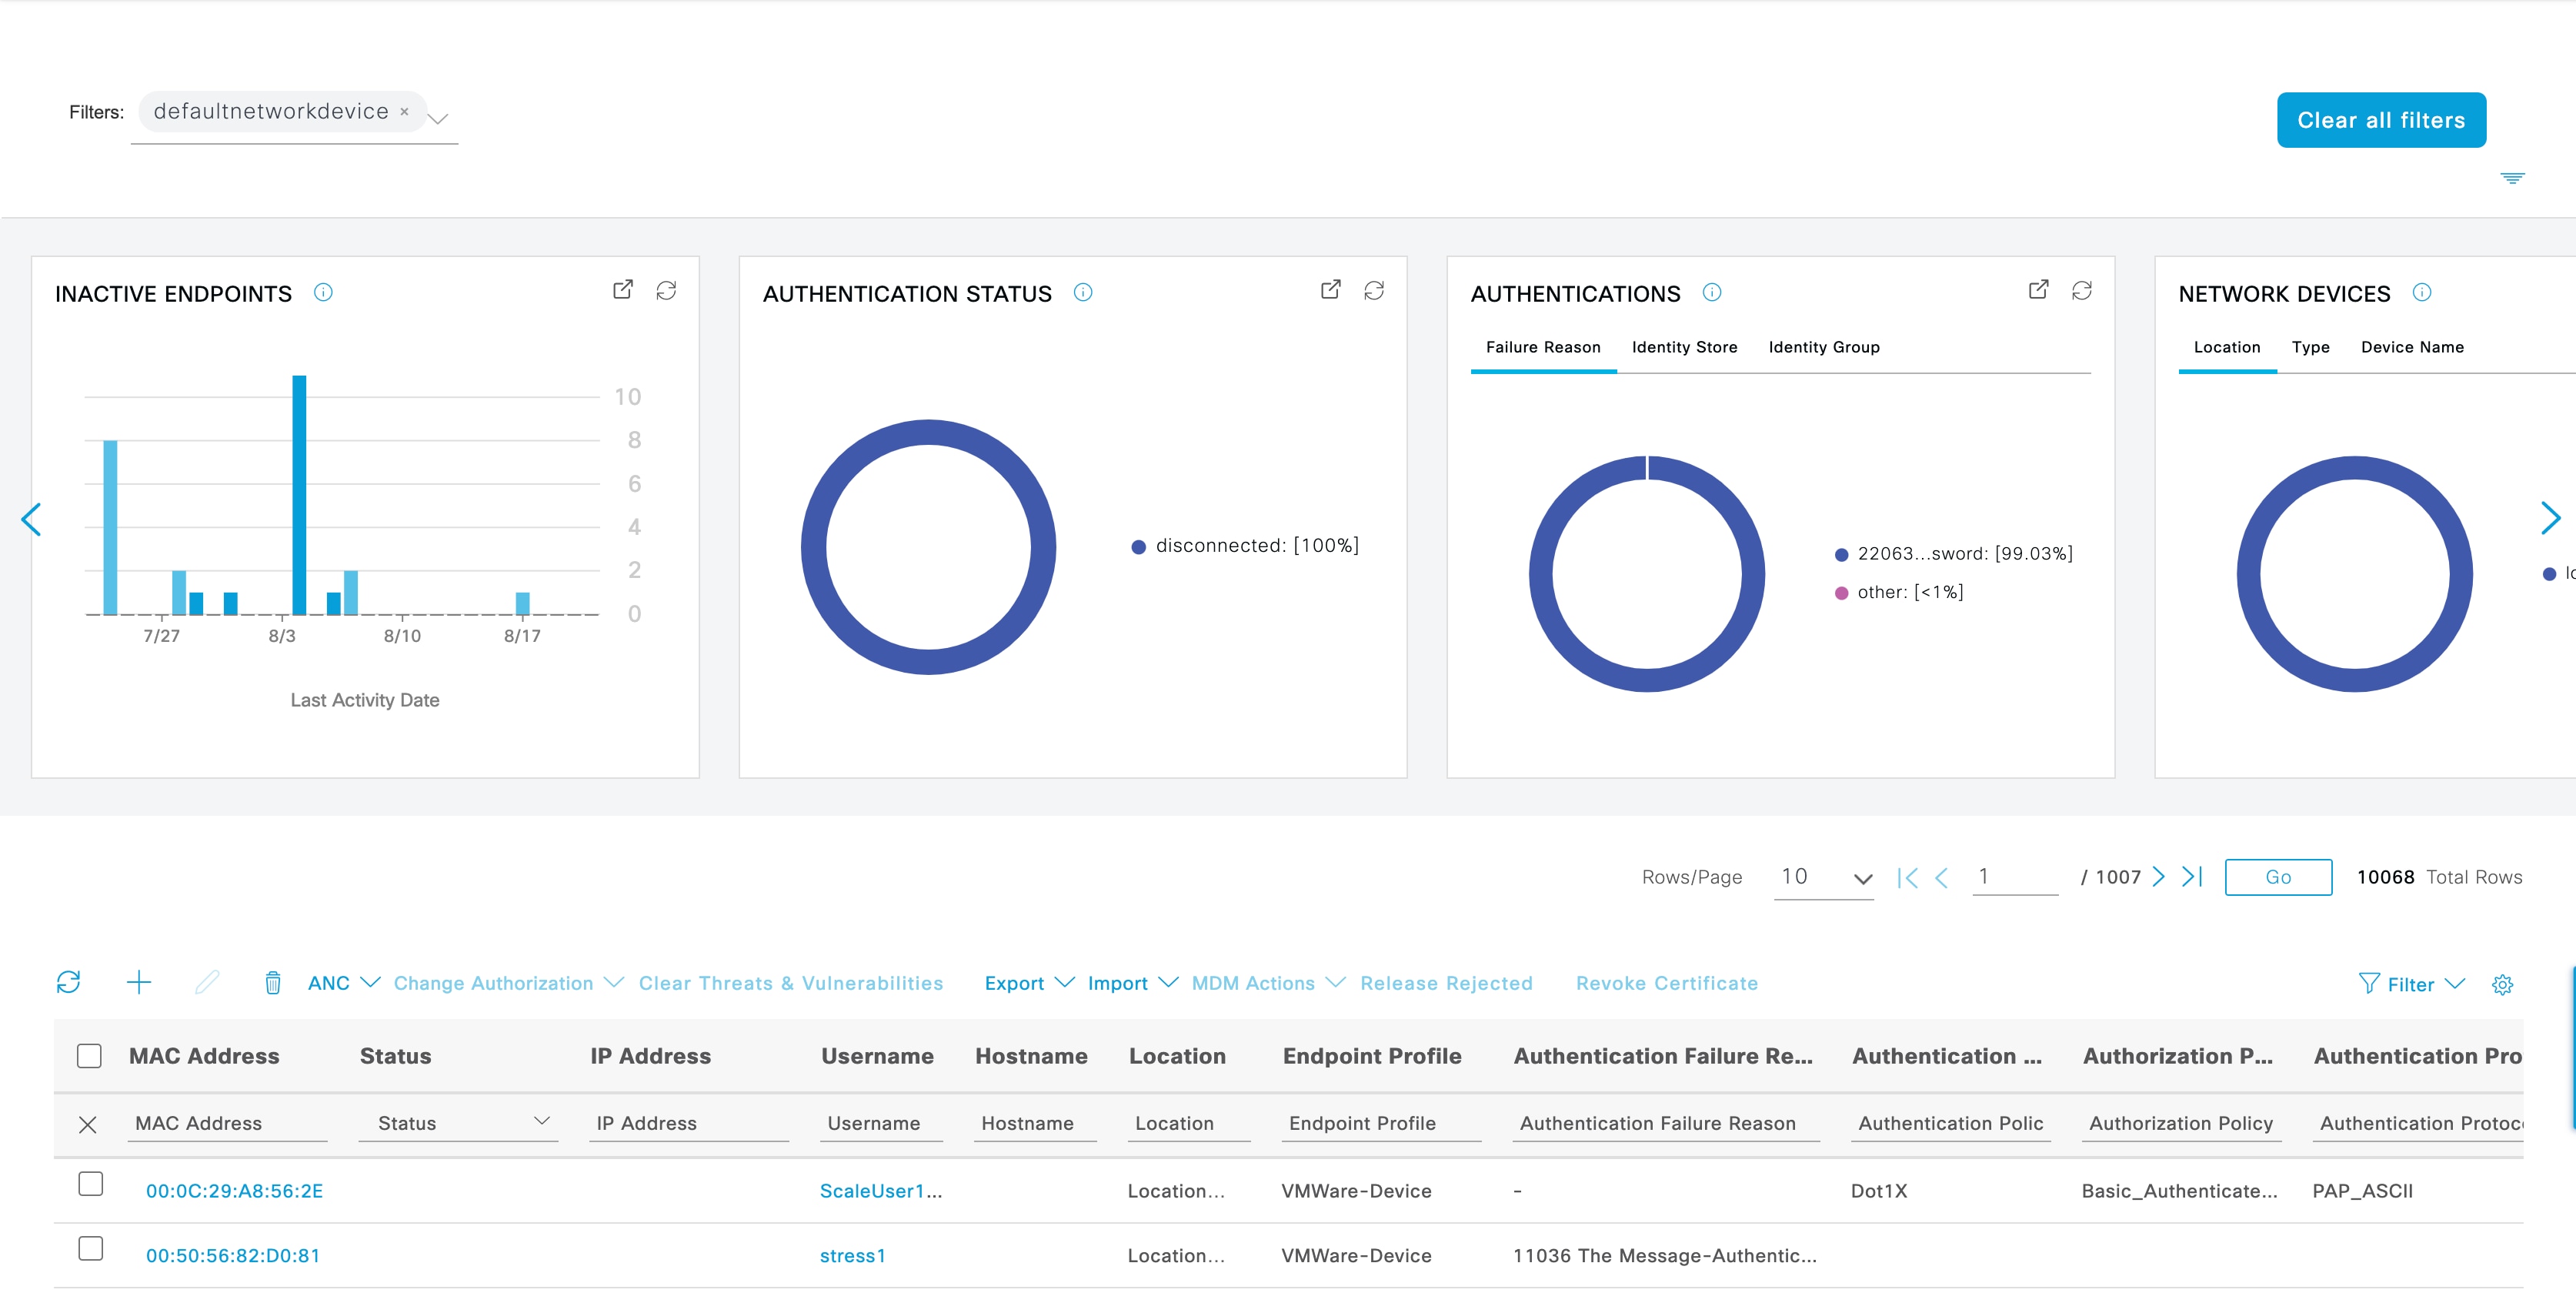
円グラフのその他のセクションをクリックして、データをさらにフィルタ処理します。[フィルタ(Filter)] ドロップダウンリストまたはデータのリストの右上隅にある歯車アイコンを使用して、表示されるデータを管理することもできます。
カスタムフィルタを保存します。
カスタムフィルタの作成
自分だけがアクセスできるユーザー固有のカスタムフィルタを作成して保存します。Cisco ISE にログインしている他のユーザーは、作成したカスタムフィルタを表示できません。これらのカスタムフィルタは Cisco ISE データベースに保存されます。Cisco ISE にログインしているコンピュータやブラウザからアクセスできます。
手順
|
ステップ 1 |
[フィルタ(Filter)]をクリックし、ドロップダウンリストから [高度なフィルタ(Advanced Filter)] を選択します。 |
|
ステップ 2 |
[フィルタ(Filter)] メニューからフィールド、演算子、値などの検索属性を指定します。 |
|
ステップ 3 |
[+] をクリックして、その他の条件を追加します。 |
|
ステップ 4 |
[実行(Go)] をクリックして、指定された属性に一致するエントリを表示します。 |
|
ステップ 5 |
[保存 (Save)] をクリックして、フィルタを保存します。 |
|
ステップ 6 |
名前を入力し、[Save(保存)] をクリックします。[フィルタ(Filter)] ドロップダウンリストにフィルタが表示されるようになりました。 |
拡張フィルタを使用した条件によるデータのフィルタリング
拡張フィルタを使用して、指定した条件(名 = Mike、ユーザー グループ = 従業員など)に基づいて情報をフィルタリングできます。複数の条件を指定できます。
手順
|
ステップ 1 |
[フィルタ(Filter)]をクリックし、[高度なフィルタ(Advanced Filter)] を選択します。 |
|
ステップ 2 |
[フィルタ(Filter)] メニューから検索属性(フィールド、演算子、値など)を指定します。 |
|
ステップ 3 |
[+] をクリックして、その他の条件を追加します。 |
|
ステップ 4 |
[実行(Go)] をクリックして、指定した属性に一致するエントリを表示します。 |
クイックフィルタを使用したフィールド属性によるデータのフィルタリング
クイックフィルタを使用して、リストページに表示されるフィールド属性の値を入力し、ページをリフレッシュすることで、フィルタ基準に一致するレコードのみを一覧表示できます。
手順
|
ステップ 1 |
[フィルタ(Filter)] をクリックし、ドロップダウンリストから [クィックフィルタ(Quick Filter)] を選択します。 |
|
ステップ 2 |
属性フィールドの 1 つ以上に検索条件を入力すると、指定した属性に一致するエントリが自動的に表示されます。 |
ダッシュレットビューでのエンドポイントアクション
リストの上部にあるツールバーでは、選択したリスト内のエンドポイント上でアクションを実行できます。すべてのリストですべてのアクションが有効になっているわけではありません。使用可能になっている機能によってアクションは異なります。使用する前に Cisco ISE で有効にする必要がある 2 つのエンドポイントアクションを次のリストに示します。
-
適応型ネットワーク制御アクション
適応型ネットワーク制御を有効にした場合、リストでエンドポイントを選択して、ネットワークアクセスを割り当てたり、取り消したりできます。また、認可変更も発行できます。
ホームページダッシュレットで円グラフをクリックすると、表示される新しいウィンドウに [ANC] オプション と[認可変更(Change Authorization)] オプションが表示されます。アクションを実行するエンドポイントのチェックボックスをオンにし、[ANC] ドロップダウンリストと [認可変更(Change Authorization)] ドロップダウンリストから必要なアクションを選択します。
図 6. ダッシュレットビューでのエンドポイントアクション 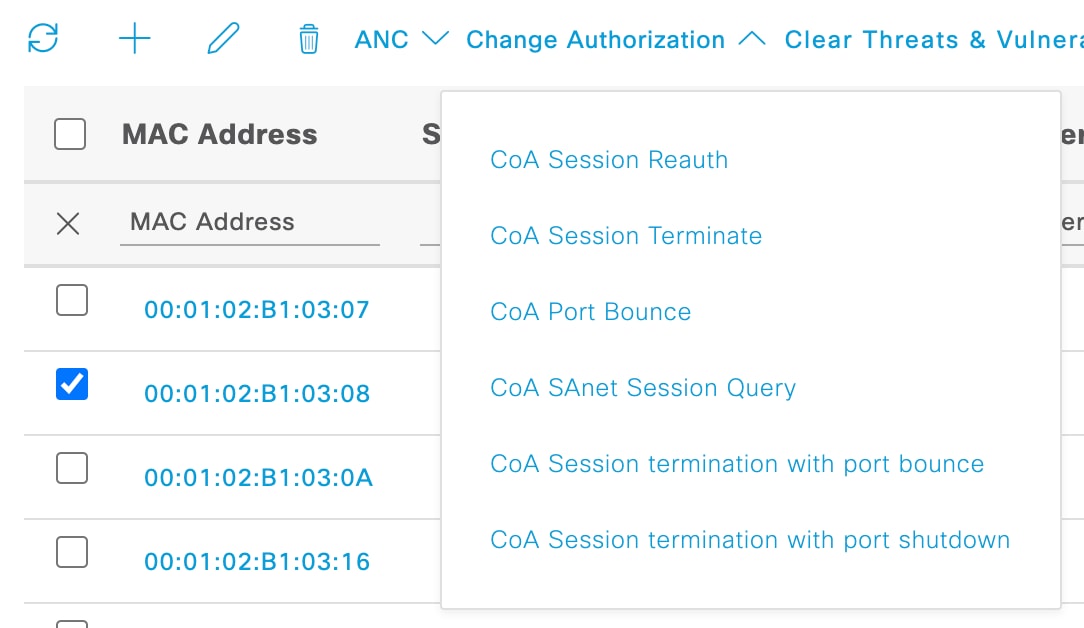
-
MDM アクション
MDM サーバーを Cisco ISE に接続すると、選択したエンドポイントで MDM アクションを実行できます。[MDM アクション(MDM Actions)] ドロップダウンリストから必要なアクションを選択します。
Cisco ISE ダッシュボード
Cisco ISE のダッシュボードまたはホームページ([メニュー(Menu)] アイコン(![]() )をクリックし [ダッシュボード(Dashboard)] を選択)は、Cisco ISE 管理ポータルへのログイン後に表示されるランディングページです。ダッシュボードは、ウィンドウの上部に沿って表示されるメトリック メーターと下にあるダッシュレットで構成された、集中化された管理コンソールです。デフォルトのダッシュボードは、[概要(Summary)]、[エンドポイント(Endpoints)]、[ゲスト(Guests)]、[脆弱性(Vulnerability)]、[脅威(Threat)]
です。Cisco ISE ホームのダッシュボードを参照してください。
)をクリックし [ダッシュボード(Dashboard)] を選択)は、Cisco ISE 管理ポータルへのログイン後に表示されるランディングページです。ダッシュボードは、ウィンドウの上部に沿って表示されるメトリック メーターと下にあるダッシュレットで構成された、集中化された管理コンソールです。デフォルトのダッシュボードは、[概要(Summary)]、[エンドポイント(Endpoints)]、[ゲスト(Guests)]、[脆弱性(Vulnerability)]、[脅威(Threat)]
です。Cisco ISE ホームのダッシュボードを参照してください。
(注) |
Cisco ISE プライマリ PAN ポータルでのみ、このダッシュボードを表示できます。 |
ダッシュボードのリアルタイムデータによって、ネットワークにアクセスしているデバイスとユーザーを一目で確認できるステータスと、システムの正常性の概要が表示されます。
2 番目のレベルのメニューバーにある歯車アイコンをクリックして、ダッシュボード設定のドロップダウンリストを表示します。次の表では、ドロップダウンリストで使用可能なダッシュボード設定オプションについて説明します。
|
ドロップダウンリスト オプション |
説明 |
||
|---|---|---|---|
|
新しいダッシュボードの追加(Add New Dashboard) |
5 つのデフォルトのダッシュボードを含めて、最大で 20 個のダッシュボードを設定できます。 |
||
|
ダッシュボードの名前の変更(Rename Dashboard) |
(このオプションはカスタムダッシュボードでのみ使用可能)ダッシュボードの名前を変更するには、次の手順を実行します。
|
||
|
ダッシュレットの追加(Add Dashlet) |
ホームページダッシュボードにダッシュレットを追加するには、次の手順を実行します。
|
||
|
エクスポート(Export) |
ダッシュボードのデータは PDF または CSV ファイルとしてエクスポートできます。
カスタムダッシュボードをエクスポートする場合、zip ファイルは同じ名前でエクスポートされます。たとえば、MyDashboard という名前のカスタムダッシュボードをエクスポートすると、エクスポートされたファイルの名前は MyDashboard.zip となります。 |
||
|
レイアウトテンプレート(Layout Template) |
ダッシュレットが表示されるテンプレートのレイアウトを変更できます。 レイアウトを変更するには、次の手順を実行します。
|
||
|
ダッシュボードの管理(Manage Dashboards) |
[ダッシュボードの管理(Manage Dashboards)] をクリックし、次のいずれかのオプションを選択します。
|
対応するカスタムダッシュボードの横にある閉じる(x)アイコンをクリックすることで、作成したダッシュボードを削除できます。
(注) |
デフォルト ダッシュボードの名前を変更したり、削除することはできません。 |
各ダッシュレットの右上隅には、次の操作を実行できるツールバーがあります。
-
[分離(Detach)]:別のウィンドウにダッシュレットを表示します。
-
[更新(Refresh)]:ダッシュレットを更新します。
-
[削除(Remove)]:ダッシュボードからダッシュレットを削除します。
ダッシュレットの左上隅にあるグリッパ アイコンを使用して、ダッシュレットをドラッグ アンド ドロップできます。
[アラーム(Alarms)] ダッシュレットには、[シビラティ(重大度)(Severity)] 列のクイックフィルタが含まれています。[シビラティ(重大度)(Severity)] ドロップダウンリストから [クリティカル(Critical)]、[警告(Warning)]、または [情報(Info)] を選択して、アラームをシビラティ(重大度)でフィルタ処理できます。


 )をクリックし、ドロップダウンリストから [アカウント設定(Account Settings)] を選択します。
 フィードバック