- Preface
- Overview of Cisco MNM
- Configuring Network Devices for Management
- Getting Started with Cisco MNM
- Setting Up Cisco MNM Security
- Deploying Your Network in Cisco MNM
- Managing Faults with Cisco MNM
- Managing the Performance of Cisco MNM Devices
- Other Network Management Tasks
- Cisco MNM System Administration
- Alarm Message Reference
- Performance Measurements Reference
- Troubleshooting Cisco MNM
- Index
- Overview of Fault Management Features
- Managing Faults with Cisco MNM
- How Cisco MNM Processes Events
Managing Faults with Cisco MNM
Revised: December 16, 2009, OL-14480-06
This chapter contains the following sections:
•![]() Overview of Fault Management Features
Overview of Fault Management Features
•![]() Managing Faults with Cisco MNM
Managing Faults with Cisco MNM
•![]() How Cisco MNM Processes Events
How Cisco MNM Processes Events
•![]() Commissioning, Decommissioning, and Rediscovering Devices
Commissioning, Decommissioning, and Rediscovering Devices
•![]() Forwarding Traps to Other Systems
Forwarding Traps to Other Systems
•![]() Specifying the Length of Time Alarms Are Stored
Specifying the Length of Time Alarms Are Stored
See Appendix A, "Alarm Message Reference"for information about alarm events.
Overview of Fault Management Features
One of the most important aspects of network management is fault management, which is the ability to identify problems on the system and to take action to resolve them quickly and efficiently. For example, a power supply failure in a chassis may be critical to the running of the network, which would need prompt attention.
In network management, these problems are typically called faults, and the message that comes from the network device is called an alarm or alarm event.

Note ![]() Cisco IP Transfer Point LinkExtender (ITP-L) is the new name for Cisco Signaling Link Terminal (SLT). Over time, ITP-L will replace SLT in publications and the product.
Cisco IP Transfer Point LinkExtender (ITP-L) is the new name for Cisco Signaling Link Terminal (SLT). Over time, ITP-L will replace SLT in publications and the product.
Cisco Media Gateway Controller (MGC) Node Manager (MNM) provides fault management of the devices in the Cisco MNM node. When the Cisco PGW 2200 Softswitch host detects a problem with one of its logical connections, it generates a trap. Cisco MNM receives the trap and delegates it to the graphical object that represents its logical connection. For example, if Cisco MNM receives a trap that the link to a Cisco ITP-L is down, it delegates the trap to the object representing the link.
To facilitate the monitoring of the network and the identifying of potential problems, Cisco MNM propagates the alarm state of network elements upward through each object view. When an object receives an alarm, the object changes color to reflect its new state, and all parent objects also change color to reflect the most severe alarm on any of the child objects.
Note ![]() If there are multiple alarm events propagated in an object tree, only the most severe is displayed at the highest level.
If there are multiple alarm events propagated in an object tree, only the most severe is displayed at the highest level.
Cisco MNM periodically polls managed devices to make sure that each device is still reachable using SMNP (status polling). If the device is not reachable, an annotation appears on the display in the Map Viewer, an alarm is generated, and the object is placed in an error state. Cisco MNM continues to poll the device until connectivity is re-established. At that point, the alarm is cleared, the annotation on the display is removed, and the object is returned to its normal state. Duplicate alarms are filtered out.
For example, when a C7 IP Link goes out of service, a major alarm is immediately raised and propagated up to the Cisco PGW 2200 Softswitch host object. If the IP connection to a Cisco PGW 2200 Softswitch node is lost, a critical alarm is raised. A failover causes a major alarm.
In addition to managing alarms sent by SNMP traps, Cisco MNM monitors system resources on the Cisco PGW 2200 Softswitch host, the Cisco HSI server, and the Cisco Billing and Measurements Server (BAMS) and raises alarms for events such as an application being down, or a file usage being above a specified percentage.
To investigate an alarm that is displayed in the Cisco MNM Map Viewer, you typically perform the following steps:
Step 1 ![]() Drill down through the tree view to the object that has raised the alarm,
Drill down through the tree view to the object that has raised the alarm,
Step 2 ![]() From the object, open the Event Browser.
From the object, open the Event Browser.
Step 3 ![]() In the Event Browser, identify the alarm details and take appropriate action to resolve the problem.
In the Event Browser, identify the alarm details and take appropriate action to resolve the problem.
In addition to using the Event Browser to check on alarms flagged in the Map Viewer, you can use the Query Editor included in the Event Browser to filter alarms on any desired criteria. Diagnostic services can be invoked on events so that faults can be managed from the window that shows the event.
With Cisco MNM, you can also forward alarms to any configured remote host and continuously export alarm events as they are raised to a text file.
The "Managing Faults with Cisco MNM" section, describes the main tasks and procedures for managing faults. If you are interested in some of the principles Cisco MNM applies in its fault management, see the "How Cisco MNM Processes Events" section.
What Is Managed
Cisco MNM performs fault management on the Cisco PGW 2200 Softswitch node devices including the Cisco PGW 2200 Softswitch host network connectivity. This includes the logical connections from the active Cisco PGW 2200 Softswitch host to the
•![]() Interfaces (Ethernet, TDM)
Interfaces (Ethernet, TDM)
•![]() STPs
STPs
•![]() Point codes (SS7 routes)
Point codes (SS7 routes)
•![]() Remote Cisco PGW 2200 Softswitches
Remote Cisco PGW 2200 Softswitches
•![]() TCAP nodes
TCAP nodes
•![]() Cisco Media Gateways
Cisco Media Gateways
The logical connections from the active Cisco PGW 2200 Softswitch host are shown as subnodes under the common Cisco PGW 2200 Softswitch host object. If the standby Cisco PGW 2200 Softswitch host is not processing calls, only the network connectivity of the active Cisco PGW 2200 Softswitch host is shown.
For a reference describing the alarm events for specific devices, see Appendix A, "Alarm Message Reference."
In addition to accepting SNMP traps from managed devices, Cisco MNM also generates alarm events based on its own internal traps.
Managing Faults with Cisco MNM
The following summarizes the tasks required for managing faults with Cisco MNM. These tasks do not need to be performed in sequence.
•![]() Task 1—Making Any Necessary Adjustments to Status Polling Settings
Task 1—Making Any Necessary Adjustments to Status Polling Settings
•![]() Task 2— Customizing Event Management
Task 2— Customizing Event Management
•![]() Task 3—Monitoring the Network for Alarm Events
Task 3—Monitoring the Network for Alarm Events
•![]() Task 4—Using the Event Browser
Task 4—Using the Event Browser
•![]() Task 5—Using Troubleshooting Tools
Task 5—Using Troubleshooting Tools
The procedures for completing each task is provided in the sections below.
Task 1—Making Any Necessary Adjustments to Status Polling Settings
Status polling checks the device status, such as up, down, active, or standby. The status is shown on the Status tab of the Properties dialog box for the device. You can specify a different status polling frequency for each device type, such as Cisco ITP-Ls or Cisco LAN switches. All devices of that type and all components of such devices have the same polling frequency. For example, if you set a 5 minute polling frequency for one Cisco ITP-L in the network, the frequency is applied to all Cisco ITP-Ls in the network and to all monitored elements on the Cisco ITP-L, such as the TDM interfaces.
For the Cisco ITP-L and Cisco LAN switch, the polling frequency is set at the device level. All components of the device have the same polling frequency as the parent device. For example, setting a frequency of every 10 minutes for a Cisco ITP-L also causes its TDM interfaces to be polled every 10 minutes.
Note![]() •
•![]() Default status polling frequency is every 2 minutes.
Default status polling frequency is every 2 minutes.
•![]() To stop status polling when there is a known problem with a device or the device is taken out of service, decommission it. See the "Commissioning, Decommissioning, and Rediscovering Devices" section.
To stop status polling when there is a known problem with a device or the device is taken out of service, decommission it. See the "Commissioning, Decommissioning, and Rediscovering Devices" section.
Use the following procedure to set or change a status polling frequency:
Step 1 ![]() In the Map Viewer, right-click the desired device, and choose States.
In the Map Viewer, right-click the desired device, and choose States.
The States dialog box opens.
Note![]() •
•![]() If the States option is not available, select the parent device.
If the States option is not available, select the parent device.
•![]() For the Cisco PGW 2200 Softswitch host, including its Cisco PGW 2200 Softswitch node signaling or trunking components, select the Cisco PGW 2200 Softswitch Host object.
For the Cisco PGW 2200 Softswitch host, including its Cisco PGW 2200 Softswitch node signaling or trunking components, select the Cisco PGW 2200 Softswitch Host object.
Step 2 ![]() Set the desired Status polling frequency. To change from minutes to hours, select from the drop-down menu. For all devices and types of polling, the minimum frequency is 1 minute and the maximum is 24 hours.
Set the desired Status polling frequency. To change from minutes to hours, select from the drop-down menu. For all devices and types of polling, the minimum frequency is 1 minute and the maximum is 24 hours.
Step 3 ![]() Click the Save tool to save the changes.
Click the Save tool to save the changes.
Step 4 ![]() Close the dialog box.
Close the dialog box.
Note ![]() For information on Performance and Configuration polling, see Chapter 7, "Managing the Performance of Cisco MNM Devices." For information on Auto-Discovery polling, see the "Synchronizing the Cisco MNM with Device Changes" section on page 5-20.
For information on Performance and Configuration polling, see Chapter 7, "Managing the Performance of Cisco MNM Devices." For information on Auto-Discovery polling, see the "Synchronizing the Cisco MNM with Device Changes" section on page 5-20.
Task 2— Customizing Event Management
The Cisco EMF Event Manager provides three tools that can be used together to customize how you manage events:
•![]() Thresholding regimes can be used to set up criteria for raising alarms on groups of devices based on selected performance measurements that cross a specified threshold. The thresholding regime also specifies what notification profile is used when the threshold is crossed and the alarm is raised.
Thresholding regimes can be used to set up criteria for raising alarms on groups of devices based on selected performance measurements that cross a specified threshold. The thresholding regime also specifies what notification profile is used when the threshold is crossed and the alarm is raised.
•![]() Notification profiles define how you want to be notified of the threshold-crossing alert, such as with a pop-up message window or a sound. You can also have a script run when the threshold is crossed.
Notification profiles define how you want to be notified of the threshold-crossing alert, such as with a pop-up message window or a sound. You can also have a script run when the threshold is crossed.
•![]() Event groups let you group events according to your own criteria, such as event severity or device type.
Event groups let you group events according to your own criteria, such as event severity or device type.
After an overview of each of these Event Manager tools, this section gives an example of how to create and use a scoreboard and how to set threshold-crossing alerts.
About Thresholding Regimes
Thresholding is the ability to configure the management system to actively monitor the network and notify the operator when some aspect of the network performance deviates from preset criteria.
Typically, you apply a standard set of criteria to an entire set of objects as part of a management policy. Here is an example of such a policy:
Poll all routers every 15 minutes and check if their CPU utilization is higher than 80%.
If it is higher than this, raise a warning alarm on the routers that breach this
condition.
A thresholding regime has a set of trigger conditions, and each trigger condition is made up of the following components:
•![]() Expression to be checked (for example, CPU > 80%)
Expression to be checked (for example, CPU > 80%)
•![]() Frequency with which the expression should be checked; for example, every 15 minutes
Frequency with which the expression should be checked; for example, every 15 minutes
•![]() Notifications profile to run when the expression is satisfied
Notifications profile to run when the expression is satisfied
Setting up a thresholding regime allows you to apply or change the management policy of all 5000 routers at once rather than having to apply it to each one individually. You can change the central regime to apply the new policy to all objects within a group.
Once a threshold has been crossed, you can have the system notify you or carry out a sequence of actions. The specification of the actions to carry out is called a notification profile. Notification profiles are described in the next section.
About Notification Profiles
A notification profile consists of a series of notifications that should be carried out as a result of the profile being triggered by a thresholding regime. Thresholding regimes are described in the "About Thresholding Regimes" section.
Notification types available are
•![]() Beep Once—Produces a single beep
Beep Once—Produces a single beep
•![]() Raise Window—Brings all windows that contain the controller object icon to the front of the window stack
Raise Window—Brings all windows that contain the controller object icon to the front of the window stack
•![]() Flash Icon—Causes the controlling object icon to flash in active windows
Flash Icon—Causes the controlling object icon to flash in active windows
•![]() Beep Continuously—Produces a continuous beep
Beep Continuously—Produces a continuous beep
•![]() Popup Dialog—Opens a window that contains a user-defined message
Popup Dialog—Opens a window that contains a user-defined message
•![]() Play Sound—Plays a user-defined sound
Play Sound—Plays a user-defined sound
•![]() Run Script—Causes a user-defined script to run
Run Script—Causes a user-defined script to run
•![]() Raise Event—Generates a Cisco EMF event
Raise Event—Generates a Cisco EMF event
All notifications can be given a time delay, allowing a simple form of escalation process to be implemented. For example:
When a notification profile is triggered, raise a minor event; if the notification profile has not been reset within 30 minutes, raise a major alarm.
Once a notification profile is triggered, a running instance of this profile is created. This is a copy of the profile that is used to keep track of the current status of active notifications. Notification profiles can be viewed as templates that are used at trigger time to create an active running version. You can view the state of any notification profiles currently running on an object in the Notify application on the Cisco EMF launchpad.
About Event Groups
A typical telecommunications network can generate a large volume of events. Only a small proportion of these events may affect service or require immediate attention. Others may still be of interest but are not urgent. For effective network management, you must be able to separate critical events from those that are less critical.
You may also want to categorize the handling of certain events based on geographical location or the technical knowledge of certain users.
Event groups allow you to easily divide events into manageable groups based on user-defined filtering criteria, such as
•![]() Event severity
Event severity
•![]() Event state
Event state
•![]() Type of network element affected by the event
Type of network element affected by the event
For display purposes, you can arrange these event groups on scoreboards. Each scoreboard shows a summary box for each group, allowing you to see the state of a group at a glance.
Having multiple scoreboards allows multiple users to keep track of different sets of events easily without being distracted by events that are of no interest to them.
Like thresholding regimes, event groups can also be configured to run notification profiles that carry out a series of actions when certain trigger conditions are satisfied.
Event groups have three possible trigger conditions:
1. ![]() When the first event enters the group, invoke notification profiles
When the first event enters the group, invoke notification profiles
2. ![]() When the first event on an object enters the group, invoke notification profiles
When the first event on an object enters the group, invoke notification profiles
3. ![]() When any event enters the group, invoke notification profiles
When any event enters the group, invoke notification profiles
For a description of tools used with event groups, see the "About Thresholding Regimes" section and the "About Notification Profiles" section.
Creating and Using Scoreboards
In the Event Group application on the Cisco EMF launchpad, you can create a scoreboard to display the alarms you are interested in. For example, you might create a single scoreboard to display the critical, major, and minor alarms received for your entire network, as well as alarms site-by-site.
The major tasks are
•![]() Create a notification profile using the Notify application
Create a notification profile using the Notify application
•![]() Using the Event Group application, create an event group for the alarm criteria you are interested in
Using the Event Group application, create an event group for the alarm criteria you are interested in
•![]() Create a scoreboard and add the event group to the scoreboard
Create a scoreboard and add the event group to the scoreboard
Two examples are provided in the following sections.
Example 1
Use the following procedure to set a scoreboard to monitor all alarms on a network:
Step 1 ![]() Create a new notification profile by doing the following:
Create a new notification profile by doing the following:
a. ![]() On the CEMF launchpad, click Notify icon.
On the CEMF launchpad, click Notify icon.
The Notification Profiles window is displayed.
b. ![]() Choose Edit > Create Notification Profile from the menu or click the Create Notification Profile tool to open the Create Notification Profile window.
Choose Edit > Create Notification Profile from the menu or click the Create Notification Profile tool to open the Create Notification Profile window.
c. ![]() Enter a name and description for the notification profile, and click Forward.
Enter a name and description for the notification profile, and click Forward.
d. ![]() Click Add to create a new notification.
Click Add to create a new notification.
e. ![]() In the Create Notification window, choose Popup Dialog from the drop-down list, and click Forward.
In the Create Notification window, choose Popup Dialog from the drop-down list, and click Forward.
f. ![]() Specify the popup dialog message and frequencies, and click Finish when you are satisfied with the summary of the notification displayed on the screen.
Specify the popup dialog message and frequencies, and click Finish when you are satisfied with the summary of the notification displayed on the screen.
The notification is created and you are back to the Create Notification Profile window.
g. ![]() Click Forward and the summary of the new notification profile is displayed.
Click Forward and the summary of the new notification profile is displayed.
h. ![]() Click Finish.
Click Finish.
Step 2 ![]() Create a new event group by doing the following:
Create a new event group by doing the following:
a. ![]() On the launchpad, click Event Groups.
On the launchpad, click Event Groups.
The Event Group window is displayed.
b. ![]() Choose Edit > Create > Event Group from the menu.
Choose Edit > Create > Event Group from the menu.
The Create Event Group window is displayed.
c. ![]() Fill in a name and description for the group, and click Forward.
Fill in a name and description for the group, and click Forward.
d. ![]() Click Edit Query to modify the default query.
Click Edit Query to modify the default query.
The Query Editor window opens.
e. ![]() In the Severity tab, select Critical, Major, and Minor from the Available Values pane, click >> to move them to the Selected Values pane.
In the Severity tab, select Critical, Major, and Minor from the Available Values pane, click >> to move them to the Selected Values pane.
f. ![]() Choose File > Close to close the Query Editor. You are prompted to save the query. Click Yes.
Choose File > Close to close the Query Editor. You are prompted to save the query. Click Yes.
g. ![]() Click Forward.
Click Forward.
h. ![]() From the list of trigger conditions, choose Trigger every time an event enters the Event Group.
From the list of trigger conditions, choose Trigger every time an event enters the Event Group.
i. ![]() Click Edit.
Click Edit.
j. ![]() From the list of notification profiles, select the notification profile that you have created in step 1, click right arrow to move it to the Selected notification profiles pane, and Click Finish.
From the list of notification profiles, select the notification profile that you have created in step 1, click right arrow to move it to the Selected notification profiles pane, and Click Finish.
k. ![]() Click Forward and the summary of the new event group is displayed.
Click Forward and the summary of the new event group is displayed.
l. ![]() Click Finish.
Click Finish.
Step 3 ![]() Create a scoreboard by doing the following:
Create a scoreboard by doing the following:
a. ![]() In the Event Group window, choose Edit > Create > Scoreboard.
In the Event Group window, choose Edit > Create > Scoreboard.
b. ![]() Enter a name and description for the scoreboard.
Enter a name and description for the scoreboard.
c. ![]() From the list of event groups, select the event group that you have created in Step 2, click right arrow to move it to the Selected event groups pane, and Click Forward.
From the list of event groups, select the event group that you have created in Step 2, click right arrow to move it to the Selected event groups pane, and Click Forward.
d. ![]() Click Finish.
Click Finish.
Example 2
Use the following procedure to set a scoreboard to monitor alarms at a particular site:
Step 1 ![]() Create a new notification profile by doing the following:
Create a new notification profile by doing the following:
a. ![]() On the CEMF launchpad, click Notify icon.
On the CEMF launchpad, click Notify icon.
The Notification Profiles window is displayed.
b. ![]() Choose Edit > Create Notification Profile from the menu or click the Create Notification Profile tool to open the Create Notification Profile window.
Choose Edit > Create Notification Profile from the menu or click the Create Notification Profile tool to open the Create Notification Profile window.
c. ![]() Enter a name and description for the notification profile, and click Forward.
Enter a name and description for the notification profile, and click Forward.
d. ![]() Click Add to create a new notification.
Click Add to create a new notification.
e. ![]() In the Create Notification window, choose Popup Dialog from the drop-down list, and click Forward.
In the Create Notification window, choose Popup Dialog from the drop-down list, and click Forward.
f. ![]() Specify the popup dialog message and frequencies, and click Finish when you are satisfied with the summary of the notification displayed on the screen.
Specify the popup dialog message and frequencies, and click Finish when you are satisfied with the summary of the notification displayed on the screen.
The notification is created and you are back to the Create Notification Profile window.
g. ![]() Click Forward and the summary of the new notification profile is displayed.
Click Forward and the summary of the new notification profile is displayed.
h. ![]() Click Finish.
Click Finish.
Step 2 ![]() Create a new event group by doing the following:
Create a new event group by doing the following:
a. ![]() On the launchpad, click Event Groups.
On the launchpad, click Event Groups.
The Event Group window is displayed.
b. ![]() Choose Edit > Create > Event Group from the menu.
Choose Edit > Create > Event Group from the menu.
The Create Event Group window is displayed.
c. ![]() Fill in a name and description for the group, and click Forward.
Fill in a name and description for the group, and click Forward.
d. ![]() Click Edit Query to modify the default query.
Click Edit Query to modify the default query.
The Query Editor window opens.
e. ![]() In the Severity tab, select Critical, Major, and Minor from the Available Values pane, click >> to move them to the Selected Values pane.
In the Severity tab, select Critical, Major, and Minor from the Available Values pane, click >> to move them to the Selected Values pane.
f. ![]() In the Event Status tab, keep the default, Active Only.
In the Event Status tab, keep the default, Active Only.
g. ![]() In the Object Scope tab, click Add Scope to open the View Scope Selector window. Select all objects for the desired site, and click Apply.
In the Object Scope tab, click Add Scope to open the View Scope Selector window. Select all objects for the desired site, and click Apply.
h. ![]() Choose File > Close to close the Query Editor. You are prompted to save the query. Click Yes.
Choose File > Close to close the Query Editor. You are prompted to save the query. Click Yes.
i. ![]() Click Forward.
Click Forward.
j. ![]() From the list of trigger conditions, choose Trigger every time an event enters the Event Group.
From the list of trigger conditions, choose Trigger every time an event enters the Event Group.
k. ![]() Click Edit.
Click Edit.
l. ![]() From the list of notification profiles, select the notification profile that you have created in step 1, click right arrow to move it to the Selected notification profiles pane, and Click Finish.
From the list of notification profiles, select the notification profile that you have created in step 1, click right arrow to move it to the Selected notification profiles pane, and Click Finish.
m. ![]() Click Forward and the summary of the new event group is displayed.
Click Forward and the summary of the new event group is displayed.
n. ![]() Click Finish.
Click Finish.
Step 3 ![]() Create a scoreboard by doing the following:
Create a scoreboard by doing the following:
a. ![]() In the Event Group window, choose Edit > Create > Scoreboard.
In the Event Group window, choose Edit > Create > Scoreboard.
b. ![]() Enter a name and description for the scoreboard.
Enter a name and description for the scoreboard.
c. ![]() From the list of event groups, select the event group that you have created in Step 2, click right arrow to move it to the Selected event groups pane, and Click Forward.
From the list of event groups, select the event group that you have created in Step 2, click right arrow to move it to the Selected event groups pane, and Click Forward.
d. ![]() Click Finish.
Click Finish.
Setting Threshold Crossing Alerts
You can trigger a threshold crossing alert (TCA) when a particular performance indicator crosses a specific threshold. In the example here, a TCA is created to alert you when the CPU utilization of a Cisco PGW 2200 Softswitch host crosses a specified threshold. You need to create an Object group for a Cisco PGW 2200 Softswitch host processor, and then create a trigger condition for it.
Create an Object Group
Use the following procedure to create an object group for a Cisco PGW 2200 Softswitch host processor:
Step 1 ![]() On the launchpad, click Group.
On the launchpad, click Group.
The Object Group Manager window is displayed.
Step 2 ![]() Right-click objectGroups in the left pane and choose Create Object Group.
Right-click objectGroups in the left pane and choose Create Object Group.
Step 3 ![]() Fill in a name and description for the group.
Fill in a name and description for the group.
Step 4 ![]() Click Query Setup tool to open the Query Edit window, and then click Add Object(s).
Click Query Setup tool to open the Query Edit window, and then click Add Object(s).
Step 5 ![]() In the Host View, select the Cisco PGW 2200 Softswitch host, and choose the Processor-1 object.
In the Host View, select the Cisco PGW 2200 Softswitch host, and choose the Processor-1 object.
Step 6 ![]() Click Apply, to add this object to the group. You can add similar objects from the other deployed Cisco PGW 2200 Softswitch hosts if you have multiple hosts deployed.
Click Apply, to add this object to the group. You can add similar objects from the other deployed Cisco PGW 2200 Softswitch hosts if you have multiple hosts deployed.
Step 7 ![]() Click File > Close, and save the query when prompted.
Click File > Close, and save the query when prompted.
Step 8 ![]() Click File > Close again, and save object group changes when prompted.
Click File > Close again, and save object group changes when prompted.
Create a Trigger Condition
Use the following procedure to create a trigger condition:
Step 1 ![]() On the launchpad, click Thresholds.
On the launchpad, click Thresholds.
Step 2 ![]() Choose Edit > Create Thresholding Regime.
Choose Edit > Create Thresholding Regime.
Step 3 ![]() Give the regime a name and a description.
Give the regime a name and a description.
Step 4 ![]() Choose the object group created in previous steps.
Choose the object group created in previous steps.
Step 5 ![]() Click Forward.
Click Forward.
Step 6 ![]() Click Add to create a new threshold.
Click Add to create a new threshold.
Step 7 ![]() From the list of attributes, choose mgcProcessor.
From the list of attributes, choose mgcProcessor.
Step 8 ![]() Under that object, choose HOST-RESOURCES-MIB.hrProcessorTablemgcProcessor.
Under that object, choose HOST-RESOURCES-MIB.hrProcessorTablemgcProcessor.
Step 9 ![]() Under that object, choose hrProcessorTable, and then choose Utilization.
Under that object, choose hrProcessorTable, and then choose Utilization.
Step 10 ![]() Choose (>) from the list of operators.
Choose (>) from the list of operators.
Step 11 ![]() Specify a value, such as 70, and click Add. A trigger condition is created.
Specify a value, such as 70, and click Add. A trigger condition is created.
Step 12 ![]() Click Forward, and choose whether to use the default reset condition.
Click Forward, and choose whether to use the default reset condition.
Step 13 ![]() Click Forward, and specify how often the trigger or reset condition should be checked.
Click Forward, and specify how often the trigger or reset condition should be checked.
Step 14 ![]() Click Forward, and choose the notification profile to associate the new thresholding profile.
Click Forward, and choose the notification profile to associate the new thresholding profile.
Step 15 ![]() Click Finish.
Click Finish.
Step 16 ![]() Click Forward to activate the thresholding regime.
Click Forward to activate the thresholding regime.
Step 17 ![]() Click Forward and Finish to save the thresholding regime.
Click Forward and Finish to save the thresholding regime.
Task 3—Monitoring the Network for Alarm Events
You can monitor the network for alarm events in two ways:
•![]() Using the Map Viewer Node View, you can see color-coded alarm indicators displayed on problem objects. In the Node View, alarms are propagated up from child elements to parent devices, so by watching just the main network devices, you can see when alarm events have occurred in any of their subcomponents. By drilling down, you can find the affected network element and then open the Event Browser to inspect the problem.
Using the Map Viewer Node View, you can see color-coded alarm indicators displayed on problem objects. In the Node View, alarms are propagated up from child elements to parent devices, so by watching just the main network devices, you can see when alarm events have occurred in any of their subcomponents. By drilling down, you can find the affected network element and then open the Event Browser to inspect the problem.
For details on using the Map Viewer and understanding its display, see the "Using the Map Viewer" section on page 3-10.
•![]() Using customized event management tools such as scoreboards and threshold-crossing alerts, you can have Cisco MNM notify you of selected problems. For information on these tools, see the "Task 2— Customizing Event Management" section.
Using customized event management tools such as scoreboards and threshold-crossing alerts, you can have Cisco MNM notify you of selected problems. For information on these tools, see the "Task 2— Customizing Event Management" section.
Task 4—Using the Event Browser
In Cisco MNM, an event represents a notification from a managed entity that a certain condition has just occurred. These events usually represent error conditions on managed elements.
Each event is associated with the object for which it provides notification. Therefore, an object can have a number of events at any one time.
The Event Browser provides a tool to manage the network efficiently; you can list, query, and sort all or some events according to how you want to manage the network. The Event Browser can be started from
•![]() Map Viewer—To check on events for one or more selected devices
Map Viewer—To check on events for one or more selected devices
•![]() Launchpad—To run a query for particular events
Launchpad—To run a query for particular events
You can have more than one Event Browser session open at a time, and each session can have different queries specified. All users can see any event. When an event is received, it is shown as active and unacknowledged (the Clear and Acknowledge column indicators on the event browser window are shown as gray). At this stage, no action has been taken. In the Event Browser window, you can acknowledge that a particular event is one that you are going to act upon, and all other users then see that the event is being handled. When the event is cleared, it is shown in the Event Browser window so that other users know that the event requires no further attention.
Some events are cleared automatically according to predefined clear correlation rules. These rules are described in the "Automatic Alarm Clearing" section.
Note ![]() The BAMS File Rename Failure alarm (POL115) must be manually cleared, not only in Cisco MNM but also on the BAMS, before new alarms of the POL115 type can be generated.
The BAMS File Rename Failure alarm (POL115) must be manually cleared, not only in Cisco MNM but also on the BAMS, before new alarms of the POL115 type can be generated.
Opening the Event Browser for One or More Selected Devices
Use this procedure when you have identified an alarm event for a particular device or devices in the Map Viewer.
Step 1 ![]() In the Map Viewer, select the device or devices.
In the Map Viewer, select the device or devices.
Step 2 ![]() Right-click the device, and choose Tools > Event Browser.
Right-click the device, and choose Tools > Event Browser.
The Event Browser window opens, displaying events for the selected devices. Go to the "Using the Event Browser to Manage Events" section for more information.
Opening the Event Browser to Run a Query
Use this procedure when you want to check the network for alarm events of a particular type.
On the launchpad, click the Events icon.
The Event Browser opens to the Query Editor for you to define a query to display events that match the query criteria. For more information, see the "Filtering Events Using Queries" section. Once you have created a query, go to the "Using the Event Browser to Manage Events" section.
Using the Event Browser to Manage Events
You can open the Event Browser from the Map Viewer or the launchpad to check events for specific devices or to run queries.
Use the Event Browser to
•![]() Get details on events.
Get details on events.
•![]() View event history.
View event history.
•![]() Acknowledge an event, which shows that you have taken responsibility for managing that event. If you cannot continue to manage an event, it can be unacknowledged and then becomes available to other users.
Acknowledge an event, which shows that you have taken responsibility for managing that event. If you cannot continue to manage an event, it can be unacknowledged and then becomes available to other users.
•![]() When the fault has been corrected and the event requires no further attention, clear the event. It is then removed from the Event Browser.
When the fault has been corrected and the event requires no further attention, clear the event. It is then removed from the Event Browser.
•![]() Start diagnostic or other services to troubleshoot the event.
Start diagnostic or other services to troubleshoot the event.
Use the following procedure to manage events in the Event Browser:
Step 1 ![]() Open the Event Browser window. (See the "Opening the Event Browser for One or More Selected Devices" section.)
Open the Event Browser window. (See the "Opening the Event Browser for One or More Selected Devices" section.)
Step 2 ![]() (Optional) Change the view options:
(Optional) Change the view options:
•![]() To change sort order, choose Edit > Sorting Options, and select the desired fields to sort.
To change sort order, choose Edit > Sorting Options, and select the desired fields to sort.
•![]() To change how the severity column is color-coded, choose View > Set Color Coding.
To change how the severity column is color-coded, choose View > Set Color Coding.
Step 3 ![]() (Optional) Turn automatic updating off or on:
(Optional) Turn automatic updating off or on:
Choose View > Enable Auto Update to toggle between automatic and manual updating.
Auto Update is the default state and allows you to view incoming events that are automatically updated in the window. If you are using manual updating, click Refresh periodically to see new events.
Step 4 ![]() (Optional) View event history to see any events from the last seven days that match the current query but have had their status changed by being acknowledged, cleared, or unacknowledged:
(Optional) View event history to see any events from the last seven days that match the current query but have had their status changed by being acknowledged, cleared, or unacknowledged:
Choose View > Event History.
Step 5 ![]() Select one or more events by clicking event severity, name, time, or description.
Select one or more events by clicking event severity, name, time, or description.
Step 6 ![]() (Optional) View a full description of an event, including acknowledge and clearing details:
(Optional) View a full description of an event, including acknowledge and clearing details:
Double-click the event. The Full Event Description window displays. For more information, refer to the "About the Full Event Description Window" section.
Step 7 ![]() Do one of the following to change the event state, as appropriate:
Do one of the following to change the event state, as appropriate:
•![]() To acknowledge that you are handling the event, click ACK. The indicator changes to the color of the severity of the event. Or, right-click the event and choose Event State > Acknowledge from the drop-down menu.
To acknowledge that you are handling the event, click ACK. The indicator changes to the color of the severity of the event. Or, right-click the event and choose Event State > Acknowledge from the drop-down menu.
•![]() To unacknowledge an event, right-click the event and choose Event State > Unacknowledge from the popup menu.
To unacknowledge an event, right-click the event and choose Event State > Unacknowledge from the popup menu.
•![]() To clear the event when it has been resolved, select the event, and click Clear Events. This displays the Events Clearing window. Enter the reason for clearing the event, and click Apply. The indicator changes to the new color of the severity of the event.
To clear the event when it has been resolved, select the event, and click Clear Events. This displays the Events Clearing window. Enter the reason for clearing the event, and click Apply. The indicator changes to the new color of the severity of the event.
•![]() (If you acknowledged the event or are the administrator) To unacknowledge an event that is not resolved but you are not handling, click ACK.
(If you acknowledged the event or are the administrator) To unacknowledge an event that is not resolved but you are not handling, click ACK.
Step 8 ![]() (Optional) Click Print, to save the contents of all or part of the Browser to a file or to print a paper copy.
(Optional) Click Print, to save the contents of all or part of the Browser to a file or to print a paper copy.
Step 9 ![]() (If automatic updating is off) Click Refresh to view the new events that meet the current criteria.
(If automatic updating is off) Click Refresh to view the new events that meet the current criteria.
Step 10 ![]() Close the Event Browser window.
Close the Event Browser window.
Note ![]() Query criteria are discarded when you close the window.
Query criteria are discarded when you close the window.
About the Event Browser Window
Use the Event Browser window to view and manage events, either on devices selected in the Map Viewer or selected through a query. The window is shown in Figure 6-1.
Figure 6-1 Event Browser Window
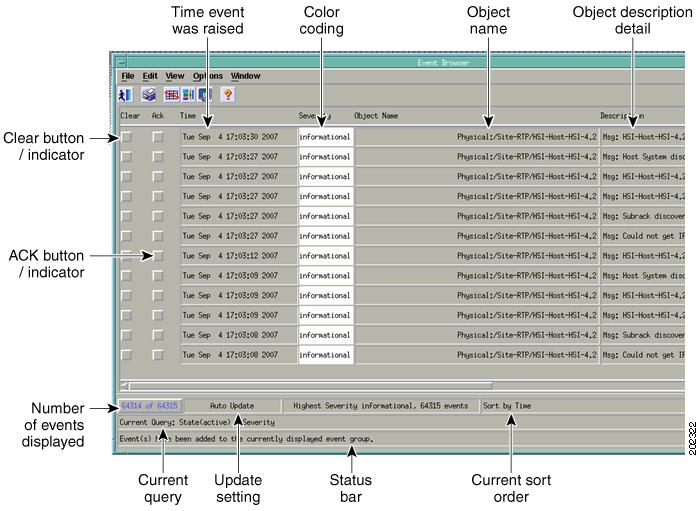
Main Panel
The main panel in the Event Browser window, shown in Figure 6-1, displays information about events including:
•![]() Object name
Object name
•![]() Time the event was raised
Time the event was raised
•![]() Severity of the event (color-coded)
Severity of the event (color-coded)
•![]() Description of the event
Description of the event
Two indicators, color-coded to the severity of the event, display to the left of the object name:
•![]() Clear—An indicator to show if an event is active or cleared
Clear—An indicator to show if an event is active or cleared
•![]() Ack—An indicator to show if an event is acknowledged or unacknowledged
Ack—An indicator to show if an event is acknowledged or unacknowledged
Note ![]() The option to unacknowledge an event is available only to an administrator or to the user who acknowledged the event initially.
The option to unacknowledge an event is available only to an administrator or to the user who acknowledged the event initially.
Event Severity Color-Coding
Each event has a severity that indicates the importance of the event and is identified with a corresponding color as shown in Table 6-1.
|
|
|
|
Red |
Critical |
|
Orange |
Major |
|
Yellow |
Minor |
|
Cyan |
Warning |
|
Green |
Normal |
|
White |
Informational |
Status Bar Information
The Event Browser window also displays the following information in the status bar:
•![]() Progress bar (indicates that events are being added to the display).
Progress bar (indicates that events are being added to the display).
•![]() Current Update status (this can be auto or manual).
Current Update status (this can be auto or manual).
•![]() Current query.
Current query.
•![]() Current sort order; for example, sort by time.
Current sort order; for example, sort by time.
•![]() Total number of events displayed. This number is shown in blue until you click it to acknowledge it.
Total number of events displayed. This number is shown in blue until you click it to acknowledge it.
Note ![]() The Event Browser can display a maximum of 10,000 entries. The status bar indicates whether there are more events on the system.
The Event Browser can display a maximum of 10,000 entries. The status bar indicates whether there are more events on the system.
About the Full Event Description Window
Double-clicking an event in the Event Browser displays the Full Event Description window (see Figure 6-2). This window provides details of the event, including acknowledge and clearing details.
Figure 6-2 Full Event Description Window

Note ![]() If the event has not been cleared, the Event State is Active and the Clearing Method, User Responsible for Clearing, and Clearing Time and Date sections are disabled. You cannot alter the information displayed.
If the event has not been cleared, the Event State is Active and the Clearing Method, User Responsible for Clearing, and Clearing Time and Date sections are disabled. You cannot alter the information displayed.
If an event has been cleared, you can view the method used to clear it by clicking Clearing Event.
The Full Event description window displays the following information:
•![]() Object name—Name of the Cisco EMF managed object the event was reported against.
Object name—Name of the Cisco EMF managed object the event was reported against.
•![]() Time and Date—The time and date the event was reported.
Time and Date—The time and date the event was reported.
•![]() Severity—The severity of the reported event.
Severity—The severity of the reported event.
•![]() Source Domain—The communications domain that reported the event.
Source Domain—The communications domain that reported the event.
•![]() Management Domain—The Management domain that reported the event.
Management Domain—The Management domain that reported the event.
•![]() Event Description—A brief description of the reported event.
Event Description—A brief description of the reported event.
•![]() Event State—Whether the event is active or cleared. If the event has been cleared, the Clearing Method, User Responsible for Clearing, and Clearing Time and Date sections become active.
Event State—Whether the event is active or cleared. If the event has been cleared, the Clearing Method, User Responsible for Clearing, and Clearing Time and Date sections become active.
Acknowledge Details
•![]() Acknowledgement User—Identifies the user who acknowledged the event
Acknowledgement User—Identifies the user who acknowledged the event
•![]() Acknowledgement Time and Date—Indicates when the event was acknowledged
Acknowledgement Time and Date—Indicates when the event was acknowledged
Clearing Details
•![]() Clearing Method—Indicates if the event was cleared by the network or by a user
Clearing Method—Indicates if the event was cleared by the network or by a user
•![]() User Responsible for Clearing—Displays the name of the user responsible for clearing the event
User Responsible for Clearing—Displays the name of the user responsible for clearing the event
•![]() Clearing Time and Date—Indicates the time and date the event was cleared
Clearing Time and Date—Indicates the time and date the event was cleared
•![]() Reason for clearing—The information that was entered in the Events Clearing window that is displayed when the Clear indicator is selected
Reason for clearing—The information that was entered in the Events Clearing window that is displayed when the Clear indicator is selected
Filtering Events Using Queries
The Event Browser monitors all events on all devices managed by the Cisco MNM. To work efficiently, you might want to specify the objects on the network with which you are concerned. The Event Browser gives you the option to do this through queries that can be configured to match your requirements. With queries, you can choose to include or exclude devices or criteria. For example, you could choose to monitor a particular device, specify a time period, and look only at events that are warnings or are critical. You can define a query so that the Event Browser displays only the events that meet the criteria you defined.
Note ![]() A query applies to the current Event Browser session only; stored queries are not supported. You can modify a current query, but once you close the Event Browser the query is discarded.
A query applies to the current Event Browser session only; stored queries are not supported. You can modify a current query, but once you close the Event Browser the query is discarded.
Use the following steps to define a query:
Step 1 ![]() Do one of the following to open the Query Editor:
Do one of the following to open the Query Editor:
•![]() On the launchpad, click the Events icon.
On the launchpad, click the Events icon.
•![]() If the Event Browser is already open, choose Edit > Query Setup or click the Query Filter tool:
If the Event Browser is already open, choose Edit > Query Setup or click the Query Filter tool:

The Query Editor window opens (see Figure 6-3).
Step 2 ![]() Set filtering (query) criteria:
Set filtering (query) criteria:
•![]() To add a value to the query, select it in the Available Values list and click >> to place the value in the Selected Value list. To remove a value, select the value in the Selected Values list and click <<.
To add a value to the query, select it in the Available Values list and click >> to place the value in the Selected Value list. To remove a value, select the value in the Selected Values list and click <<.
•![]() To activate selected values on a given tab, click the Activate box. A dark gray tab is active (On); its query is used in the Event Browser. A light gray tab is inactive (Off); its query is not used.
To activate selected values on a given tab, click the Activate box. A dark gray tab is active (On); its query is used in the Event Browser. A light gray tab is inactive (Off); its query is not used.
See the "About the Query Editor Window" section for details.
Step 3 ![]() Click Apply, and close the Query Editor.
Click Apply, and close the Query Editor.
The following message displays:
Save Query Changes?
Step 4 ![]() Click Yes.
Click Yes.
The Event Browser begins collecting the data using the criteria you selected and displays it in the Event Browser window.
Note ![]() Query changes are saved for the current session only. When you close the Event Browser, the query criteria reset to the default.
Query changes are saved for the current session only. When you close the Event Browser, the query criteria reset to the default.
Modifying a Query
Use the following steps to modify a query:
Step 1 ![]() Choose Edit > Query Setup or click the Query Filter tool:
Choose Edit > Query Setup or click the Query Filter tool:
The Query Editor window (Figure 6-3) is displayed with the current settings.
Step 2 ![]() Modify filtering (query) criteria:
Modify filtering (query) criteria:
•![]() To add a value to the query, select the value in the Available Values list and click >> to place it in the Selected Value list. To remove a value, select it in the Selected Values list and click <<. See the "About the Query Editor Window" section for details.
To add a value to the query, select the value in the Available Values list and click >> to place it in the Selected Value list. To remove a value, select it in the Selected Values list and click <<. See the "About the Query Editor Window" section for details.
•![]() To activate selected values on a given tab, click the Activate box. A dark gray tab is active (On); its query is used in the Event Browser. A light gray tab is inactive (Off); its query is not used.
To activate selected values on a given tab, click the Activate box. A dark gray tab is active (On); its query is used in the Event Browser. A light gray tab is inactive (Off); its query is not used.
Step 3 ![]() Click Apply, and close the Query Editor.
Click Apply, and close the Query Editor.
The following message displays:
Save Query Changes?
Step 4 ![]() Click Yes.
Click Yes.
The Event Browser begins collecting the data using the criteria you selected and displays the data in the Event Browser window.
Query changes are saved for the current session only. When you close the Event Browser, the query criteria reset to the default.
About the Query Editor Window
The Query Editor is shown in Figure 6-3.
Figure 6-3 Query Editor Window
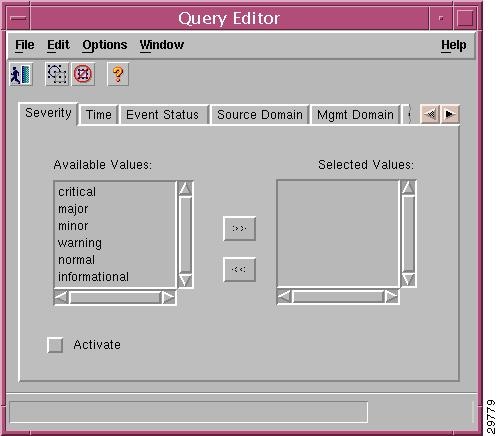
The criteria that can be used to specify a query are grouped on tabs. After selecting criteria from the Available Values list on a tab, click the Activate box to activate the criteria. A dark gray tab is active (On); its query is used in the Event Browser. A light gray tab is inactive (Off); its query is not used.
The Query Editor includes these tabs:
•![]() Severity—Critical, major, minor, warning, normal, or informational.
Severity—Critical, major, minor, warning, normal, or informational.
•![]() Time—Time range for which you want to view events, specified with time of day, day of the week, and date.
Time—Time range for which you want to view events, specified with time of day, day of the week, and date.
•![]() Event Status—Acknowledged or unacknowledged, active or cleared.
Event Status—Acknowledged or unacknowledged, active or cleared.
•![]() Source Domain—Where the event was generated: SNMP, the managed network, internal, or generated by Cisco MNM.
Source Domain—Where the event was generated: SNMP, the managed network, internal, or generated by Cisco MNM.
•![]() Mgmt Domain—The management domain of the SNMP trap information. The SNMP Management Information Base (MIB) information typically defines the equipment type generating a trap.
Mgmt Domain—The management domain of the SNMP trap information. The SNMP Management Information Base (MIB) information typically defines the equipment type generating a trap.
•![]() User—Name of the user associated with an acknowledged or cleared event.
User—Name of the user associated with an acknowledged or cleared event.
•![]() Event Class—Type of event.
Event Class—Type of event.
•![]() Object Scope—Use to select all the events of a node and its children. Select from an object tree, specifying the number of levels to view for a selected node. To specify scope
Object Scope—Use to select all the events of a node and its children. Select from an object tree, specifying the number of levels to view for a selected node. To specify scope
–![]() On the Object Scope tab, click Add Scope. The View Scope selector displays.
On the Object Scope tab, click Add Scope. The View Scope selector displays.
–![]() Select the desired node.
Select the desired node.
–![]() In the Number of Levels field, type the number of levels to view.
In the Number of Levels field, type the number of levels to view.
–![]() Select Descendants.
Select Descendants.
–![]() Click Apply.
Click Apply.
•![]() Object Class—Type of object, such as managed, container, network, site.
Object Class—Type of object, such as managed, container, network, site.
•![]() Object Attribute Presence—For various object types, attributes to query.
Object Attribute Presence—For various object types, attributes to query.
•![]() Object Attribute Value—For specified object types and attributes, values to query for.
Object Attribute Value—For specified object types and attributes, values to query for.
Task 5—Using Troubleshooting Tools
Once an alarm has been identified, you can use Cisco MNM to launch a variety of diagnostic and troubleshooting tools. For details, see the "Using Diagnostic Tools" section on page 8-57.
In the Event Browser, you can right-click a device and open troubleshooting tools such as
•![]() A Diagnostics dialog box. The Diagnostics dialog box provides shortcuts for common diagnostics that normally require the use of UNIX or MML commands. You can ping the device for connectivity, use Traceroute, check the alarm log, check the status of running processes, display the BAMS system log, and audit the BAMS trunk groups, cross-checking them with the Cisco PGW 2200 Softswitch host configuration, and retrieve state information on various network elements.
A Diagnostics dialog box. The Diagnostics dialog box provides shortcuts for common diagnostics that normally require the use of UNIX or MML commands. You can ping the device for connectivity, use Traceroute, check the alarm log, check the status of running processes, display the BAMS system log, and audit the BAMS trunk groups, cross-checking them with the Cisco PGW 2200 Softswitch host configuration, and retrieve state information on various network elements.
Note ![]() The alarm log for the Cisco PGW, BAMS, HSI, ITP-L, and Catalyst is the file traplog.log. Cisco EMF messages go to a separate file, mgcTrapProcessor.log.
The alarm log for the Cisco PGW, BAMS, HSI, ITP-L, and Catalyst is the file traplog.log. Cisco EMF messages go to a separate file, mgcTrapProcessor.log.
•![]() The MGC toolbar (also known as the MGC toolkit), which contains a suite of diagnostic and troubleshooting tools. For details, see the "Using the MGC Toolbar" section on page 8-60.
The MGC toolbar (also known as the MGC toolkit), which contains a suite of diagnostic and troubleshooting tools. For details, see the "Using the MGC Toolbar" section on page 8-60.
•![]() CiscoView, to troubleshoot problems on the Cisco ITP-L or Cisco LAN Switch. You can also use Cisco MNM to Telnet to a device or to launch an X terminal window. For details, see the "Using Cisco MNM to Launch Device Configuration" section on page 8-5.
CiscoView, to troubleshoot problems on the Cisco ITP-L or Cisco LAN Switch. You can also use Cisco MNM to Telnet to a device or to launch an X terminal window. For details, see the "Using Cisco MNM to Launch Device Configuration" section on page 8-5.
How Cisco MNM Processes Events
Refer to this section if you are interested in the principles applied by Cisco MNM in processing and displaying events. It includes
•![]() Understanding Event Propagation
Understanding Event Propagation
•![]() Understanding Alarm Acknowledgment and Clearing
Understanding Alarm Acknowledgment and Clearing
Understanding Event Propagation
To make the identification of potential problems easier, Cisco MNM propagates the alarm state of objects upwards through the Physical and Node object views.
Note ![]() To minimize redundant updating, alarms are propagated only in the Physical and Node views, not in device views. In a device view, a gray dot indicates an alarm somewhere in the tree. Check the relevant device in the Node view to find the alarm.
To minimize redundant updating, alarms are propagated only in the Physical and Node views, not in device views. In a device view, a gray dot indicates an alarm somewhere in the tree. Check the relevant device in the Node view to find the alarm.
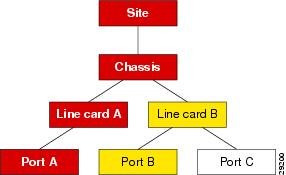
If an object receives an event, the object changes color to reflect its new state, and all parent objects within a view also change color to reflect the most severe alarm on any of the children. The example in the following diagram shows a typical physical view of the network. The line cards are contained within the chassis, the chassis within a bay, and the bay within a site.
If a minor alarm is received on Port B, then Port B and all of the objects up to the region turn yellow to indicate a potential minor problem, as illustrated in Figure 6-4.
Figure 6-4 Example of a Minor Event Propagation

If a critical alarm was then received on Port A, that port, and all of the objects up to the region, turn red to indicate a potential critical problem, as illustrated in Figure 6-5.
Figure 6-5 Example Critical Event Propagation
If the critical alarm is cleared, the icons return to yellow.
Cisco MNM filters out duplicate traps from a network element. It also filters out traps from network elements that report a problem and reports within a few seconds (up to 6) when the problem is resolved. The Cisco PGW 2200 Softswitch automatically clears existing alarms when a network element reports that an alarm condition is no longer present. This reduces the number of unnecessary alarms displayed in the Event Browser. You cannot specify when an alarm should be automatically cleared.
Understanding Alarm Acknowledgment and Clearing
This section shows you how you can acknowledge and clear events in the Event Browser.
When a new event is received, its event state is active and unacknowledged. Acknowledging the event indicates to other users that it is being handled. When it is resolved, you can clear the event.
When you cannot clear an event due to an existing problem, the event can be returned to the unacknowledged state and later acknowledged or cleared by another user.
Whether an event is unacknowledged or acknowledged, the event is considered active until it is cleared. The relationship between event states is shown in Figure 6-6.
Some events are cleared automatically when the originating condition is resolved, according to rules described in the "Automatic Alarm Clearing" section.
After events are cleared, they continue to be stored within the system for a configurable amount of time , thus maintaining an event history for an element. These events can be viewed and manipulated in the same way as any other event.
Figure 6-6 State Diagram for Events

Automatic Alarm Clearing
Cisco MNM automatically clears alarms based on certain built-in, logical rules. When an incoming clear alarm is received, the rules indicate which active alarms on a given object should be cleared. For example, a link-up alarm clears a link-down alarm, a process normal alarm clears a process error alarm, and a communication success alarm clears a communication failure alarm.
These rules are maintained in Clear Correlation files. A sample Clear Correlation file is
CLEAR_CORRELATION_RULE
INCOMING_ALARM_CLASS linkUpAlarmClass
ALARM_CLASS_TO_CLEAR linkDownAlarmClass
END_RULE
When a clear condition is received, the cleared alarm is automatically removed from the appropriate screens, and the clear alarm is forwarded to northbound systems like any other alarm.
The following Table 6-2 through Table 6-5 show the clear conditions for the alarms for each Cisco PGW 2200 Softswitch node device.
|
|
|
IF-MIB.linkDown |
IF-MIB.linkUp |
|
|
|
IF-MIB.linkDown |
IF-MIB.linkUp |
CISCO-STACK-MIB.switchModuleDown |
CISCO-STACK-MIB.switchModuleUp |
|
|
|
CRITAPP-MIB.critAppDown |
CRITAPP-MIB.critAppUp1 |
CRITAPP-MIB.critAppNotAllRunning |
CRITAPP-MIB.critAppAllRunning |
SIFSMONITOR-MIB.siFsBelowWarningThreshold |
SIFSMONITOR-MIB.siFsAboveWarningThreshold2 |
SIFSMONITOR-MIB.siFsBelowCriticalThreshold |
SIFSMONITOR-MIB.siFsAboveCriticalThreshold3 |
1 The varbind criaAppName in the trap must match. 2 The varbind siFsMonName in the trap/clear must match. 3 The varbind siFsMonName in the trap/clear must match. |
Understanding Status Polling
Cisco MNM periodically polls each managed object (the Cisco PGW 2200 Softswitch host, Cisco ITP-L, LAN switch, Cisco HSI server, and Cisco BAMS) to ensure that the device is still reachable using SNMP. If the device is not reachable, its state is indicated by annotation on the Map Viewer, and an alarm is generated. In addition, the object is placed in the error state.
After the object loses connectivity, Cisco MNM continues to poll the object until it can be reached. Once connectivity is re-established, the alarm is cleared and the annotation on Map Viewer is removed. In addition, the object is returned to the normal state.
Cisco MNM also displays the status of the Cisco PGW 2200 Softswitch host connectivity network. The connectivity network is made up of the logical connections from the active Cisco PGW 2200 Softswitch host to the following:
•![]() Interfaces (Ethernet, TDM)
Interfaces (Ethernet, TDM)
•![]() STPs
STPs
•![]() Point codes (SS7 routes)
Point codes (SS7 routes)
•![]() Remote Cisco PGW 2200 Softswitches
Remote Cisco PGW 2200 Softswitches
•![]() TCAP nodes
TCAP nodes
•![]() Cisco Media Gateways
Cisco Media Gateways
The logical connections from the active Cisco PGW 2200 Softswitch host are shown as subnodes under the common Cisco PGW 2200 Softswitch host object. If the standby Cisco PGW 2200 Softswitch host is not processing calls, only the network connectivity of the active Cisco PGW 2200 Softswitch host is shown.
Status details are provided below.
Network Interface Status
Cisco MNM performs status polling to learn the state of each network interface, which is depending on the operational and administrative status of the interface (see Table 6-6).
Note that the chassis is queried for the state of its interfaces. That is, the status of the interface reported by Cisco MNM is identical to the status reported by the chassis by means of its current management IP address. However, the status of each interface is reported by the chassis by means of that object's specific IP addresses. In this way, Cisco MNM can better reflect the true health of the chassis.
Interface Alarms
When a network interface goes down, the device sends a link-down trap to Cisco MNM. When Cisco MNM detects this trap, it transitions the object representing that interface to the down state. To handle the case where Cisco MNM may have missed a trap, the status polling mechanism raises an alarm if it detects that the interface is down. When the interface comes back up, the device raises a link-up trap. If Cisco MNM detects this trap, it transitions the interface back to the normal state. If Cisco MNM missed this trap, the next status poll detects that the interface is back up. Internally, Cisco MNM transitions the interface back to the normal state and clears the appropriate alarms on the object.
Cisco PGW 2200 Softswitch Host Status
Cisco MNM periodically checks the status of each Cisco PGW 2200 Softswitch node device. The attribute SNMP:CISCO-TRANSPATH-MIB.tpCompOpStatus is retrieved and its value is used to determine the required state of the object (see Table 6-7).
.
|
|
|
|---|---|
ACTIVE |
active |
STANDBY |
standby |
OOS |
oos |
No answer |
not-running |
Not reachable |
unreachable |
BAMS Status
Cisco MNM periodically checks the status of each BAMS device. The SNMP:ACECOMM-BAMS-SYSPARM-MIB.sysStatus attribute is retrieved, and its value is used to determine the required state of the object (see Table 6-8).
.
|
|
|
|---|---|
Active |
active |
Standby |
standby |
Outage |
oos |
Other |
other |
No answer |
not-running |
Not reachable |
unreachable |
HSI Status
Cisco MNM periodically checks the status of each HSI device. The SNMP:HOST-RESOURCES-MIB.hr.sysStatus attribute is retrieved, and its value is used to determine the required state of the object (see Table 6-9).
|
|
|
|---|---|
Active |
active |
Other |
other |
No answer |
not-running |
Not reachable |
unreachable |
Trap Receipt Not Guaranteed
Cisco MNM does not provide any guarantee that it received a trap from the network elements. Cisco MNM does not perform any negotiation with the network elements to detect or recover lost traps.
How Cisco MNM Manages Multiple IP Addresses for Status Polling
By default, each Cisco MNM object can contain only a single IP address. For example, when the user deploys a Cisco ITP-L, the user can specify only a single IP address. Cisco MNM uses this IP address for all management transactions, including status polling and performance polling. In addition, the IP address is used to map incoming faults to the Cisco MNM object. When a trap arrives from the network element, Cisco MNM matches the IP address of the trap sender to the IP address of an object in the database.
In reality, a physical device might have more than one IP address. Traps can come from any interface on the device. Since Cisco MNM is aware of only a single IP address, traps received from an alternate interface might be dropped.
Any interface on the device might go down (either operationally or administratively). If the management interface goes down, all SNMP-based operations fail. That is, not all SNMP queries are completed nor does status polling or performance polling function. Cisco MNM is designed to avoid these situations by using trap proxies and IP address failover.
Commissioning, Decommissioning, and Rediscovering Devices
When a device is administratively off the network, or it has a known problem and you do not want to manage it, you can decommission the device in Cisco MNM to stop it from being polled and generating unnecessary alarms.
When a device is decommissioned, no actual changes are made to the device, which still sends traps to Cisco MNM. However, the resulting alarm events are not reported and do not initiate any actions or status changes. Status and performance polling are also suspended.
Note ![]() When a device is decommissioned, all its subcomponents are also decommissioned.
When a device is decommissioned, all its subcomponents are also decommissioned.
When the device is back in service, commission it to resume polling. At that point, Cisco MNM starts discovery to resolve any component changes that may have occurred while the device was decommissioned.
When a device's subcomponents have changed or you have corrected a problem that interfered with discovery, you can rediscover the device to immediately update the Cisco MNM network model with the changes.
Note ![]() Rediscovery is necessary only when you want the update to occur before the next auto-discovery polling interval (when any changes are routinely detected).
Rediscovery is necessary only when you want the update to occur before the next auto-discovery polling interval (when any changes are routinely detected).
Use the following procedure to decommission, commission, or rediscover a device:
Step 1 ![]() In the Map Viewer window, select the object and right-click.
In the Map Viewer window, select the object and right-click.
Step 2 ![]() Choose States. The States dialog box opens.
Choose States. The States dialog box opens.
Step 3 ![]() On the States tab, do one of the following:
On the States tab, do one of the following:
•![]() Click Decommission to stop processing traps from the device.
Click Decommission to stop processing traps from the device.
•![]() Click Commission to resume processing traps after a device was decommissioned.
Click Commission to resume processing traps after a device was decommissioned.
•![]() Click Rediscover to rediscover a device, updating the network model with any device changes since the last auto-discovery.
Click Rediscover to rediscover a device, updating the network model with any device changes since the last auto-discovery.
You are prompted to confirm the action.
Step 4 ![]() Click Yes. Cisco MNM executes the action. The device state changes to reflect the change.
Click Yes. Cisco MNM executes the action. The device state changes to reflect the change.
Note ![]() When a device is rediscovered, if the Event Browser is open, it displays the message, "Discovery is now complete." With each new discovery, any earlier discovery messages are cleared; only the most recent discovery message appears.
When a device is rediscovered, if the Event Browser is open, it displays the message, "Discovery is now complete." With each new discovery, any earlier discovery messages are cleared; only the most recent discovery message appears.
Step 5 ![]() Close the dialog box.
Close the dialog box.
Forwarding Traps to Other Systems
You can forward the traps (alarms) collected from managed elements by Cisco MNM to other systems. In addition to receiving SNMP traps from node devices, Cisco MNM monitors resource usage on the Cisco PGW 2200 Softswitch host, Cisco HSI server, and the Cisco BAMS. Traps are generated, for example, when disk usage exceeds a given threshold or when applications are down.There are two types of trap forwarding:
•![]() Automating the Trap Forwarding Procedure
Automating the Trap Forwarding Procedure
•![]() Using the Northbound Event Interface
Using the Northbound Event Interface
Automating the Trap Forwarding Procedure
Use the cmnmtrapforward command to automate the procedure to stop or start forwarding traps to other systems by updating the trapForwardFile file.
To Start Trap Forwarding
Follow these steps to start trap forwarding:
Step 1 ![]() From the Cisco EMF base directory, enter the following command:
From the Cisco EMF base directory, enter the following command:
cmnmtrapforward
Information similar to the following is displayed:
Configure trap forwarding to other hosts? [y/n]: [n]
Step 2 ![]() Enter Y. Information similar to the following is displayed:
Enter Y. Information similar to the following is displayed:
Trap Forwarding is configured for the following IPs
172.16.128.46
Please enter a Trap Forwarding IP address [?,q]
Step 3 ![]() Enter the IP address to which traps will be forwarded, and press Enter. Information similar to the following is displayed:
Enter the IP address to which traps will be forwarded, and press Enter. Information similar to the following is displayed:
Enter another IP address? [y/n]: [n]
Step 4 ![]() Continue to add IP addresses, or press N when you are finished. The following prompt appears:
Continue to add IP addresses, or press N when you are finished. The following prompt appears:
Restarting TrapManager....
To Stop Trap Forwarding
Enter the following command from the Cisco EMF base directory to stop trap forwarding:
./cmnmtrapforward -d <IP address of destination host>
The destination IP address is removed from the trapForwardFile file.
Use the cmnmtrapforward -h command to view more information about this command.
Using the Northbound Event Interface
The Northbound Event Interface (NEI) allows for integration with network management systems (NMSs), such as Hewlett Packard-OpenView Element Management Framework (HP-OEMF) and CIC (Cisco Information Center). Using NEI, you can export topological information about managed objects and forwardCisco EMF events to NMSs.
The main purpose of NEI is to convert Cisco EMF events (appearing in the Event Browser) to a particular output for NMSs. Output can be in the form of an SNMP trap, log files, or TCP connections.
NEI has two main functions: exporting and forwarding. To define export and forward filters, you can create a filter file that will contain both types of information.
For further information on NEI, go to
Note ![]() Northbound CORBA flowthrough provisioning is no longer supported.
Northbound CORBA flowthrough provisioning is no longer supported.
Sample Filter File in MNM
The following is a sample filter file for a physical view in Cisco MNM:
name="physical-traps.nbf"
exporting
{
      delta
{
temp="/tmp/filter.delta.tmp"
result="/tmp/filter.delta.result"
}
dump
{
temp="/tmp/filter.dump.tmp"
result="/tmp/filter.dump.result"
}
filter="NbNullExporter"
origin="Physical:/"
}
forwarding
{
filter="NbExtensibleSNMPForwarder"
snmp-destination="10.20.1.19"
snmp-port="162"
enterprise="1.3.6.1.4.1.1469.6"
added_aqs
{
severity="critical"
severity="major"
severity="minor"
status="cleared"
status="acknowledged"
status="unacknowledged"
}
changed_aqs
{
status="acknowledged"
status="unacknowledged"
}
containment-tree="MGC-Node-View"
}
Difference Between NEI and cmnmtrapforward
This section briefly explains the differences between using NEI and Trap Forwarding. It contains
Northbound Event Interface
NEI allows integration with higher fault management systems, such as HP-OEMF. NEI includes two main areas of functionality:
•![]() Configurable topological export—build managed objects as defined within a Cisco MNM server using CLASS mapping files
Configurable topological export—build managed objects as defined within a Cisco MNM server using CLASS mapping files
•![]() Configurable MNM fault forwarding—forward SNMPv1 and SNMPv2c traps generated from MNM faults to higher fault management systems, such as HP-OEMF. Customers create filter files with two sections, namely "exporting" and "forwarding."
Configurable MNM fault forwarding—forward SNMPv1 and SNMPv2c traps generated from MNM faults to higher fault management systems, such as HP-OEMF. Customers create filter files with two sections, namely "exporting" and "forwarding."
cmnmtrapforward
Cisco MNM forwards raw traps that are received from the devices being managed to multiple third party NMSs by adding hostname IP address, generic trap id, specific trap id, enterprise oid, and details in the trapForwardingFile. This feature does not include the functionality of exporting and forwarding filters as supported by NEI, nor does it forward alarms that are generated by Cisco MNM itself, such as communication failures detected during polling of managed devices.
Recommendation
Since trap forwarding has minimal value when compared to NEI, we recommended using NEI for forwarding traps to third party NMS.
Specifying the Length of Time Alarms Are Stored
All alarms are automatically stored in the Cisco MNM database and purged at regular intervals to make room for new alarms. The Alarm Deleter, built into Cisco EMF, is set up to run at midnight every night. The Alarm Deleter queries the alarm database and deletes alarms that meet the specified criteria. The default is to delete cleared alarms that are seven days old.
If you want to change the frequency with which old alarms are deleted, you can change the values in the alarmDelete.ini file. An example of the file is shown here:
[logger]
#include "loggercommon.include"
loggingName = alarmDeleter
[AlarmDeleter]
databaseName    		= [[OSDBROOT]]/alarm.db
segmentDeletionInterval = 15
ageOfAlarmsInDays		= 7
ageOfAlarmsInHours	= 0
ageOfAlarmsInMinutes    = 0
deleteAllAlarms		= 0
[Database]
#include "databaseCommon.include"
Table 6-10 describes the variables used in defining the deletion rules.
 Feedback