Ultra Cloud Core Common Data Layer, Release 1.7 - Configuration and Administration Guide
Bias-Free Language
The documentation set for this product strives to use bias-free language. For the purposes of this documentation set, bias-free is defined as language that does not imply discrimination based on age, disability, gender, racial identity, ethnic identity, sexual orientation, socioeconomic status, and intersectionality. Exceptions may be present in the documentation due to language that is hardcoded in the user interfaces of the product software, language used based on RFP documentation, or language that is used by a referenced third-party product. Learn more about how Cisco is using Inclusive Language.
The Cisco Common Data Layer (CDL) is a high-performance next generation Key-value (KV) data store layer for all the Cloud
Native applications. These applications use the CDL as a state management with High Availability (HA) and Geo HA functions.
The CDL provides:
A Common Data Store Layer across different Network Functions (NFs) - such as AMF, SMF and PCF - Microservices.
Multi-master support to achieve low latency read and write.
Pure in-memory storage.
Runs session related timers to notify NF on timer expiry.
High Availability and Geo Redundancy with fast failover
Revision History
Table 1. Revision History
Revision Details
Release
CDL supports identifying and taking necessary action on stale index records.
Allows the peer site to process GR failover notifications of the isolated site.
CDL provides a utility to sync the indexes with its remote peers.
The Grafana dashboard is enhanced to show the GR Connection status.
2020.02.3
Architecture
You can deploy CDL in the following modes:
HA Only
Geo HA
Note
For HA Only deployments, redundancy is provided for blade failures at the local
site. However, session redundancy is not provided for HA Only deployments, when
the complete site or K8s cluster is unreachable.
The following figures depict the high-level architecture of the CDL deployment
models.
Figure 1. CDL Deployment Model
Figure 2. CDL Microservices
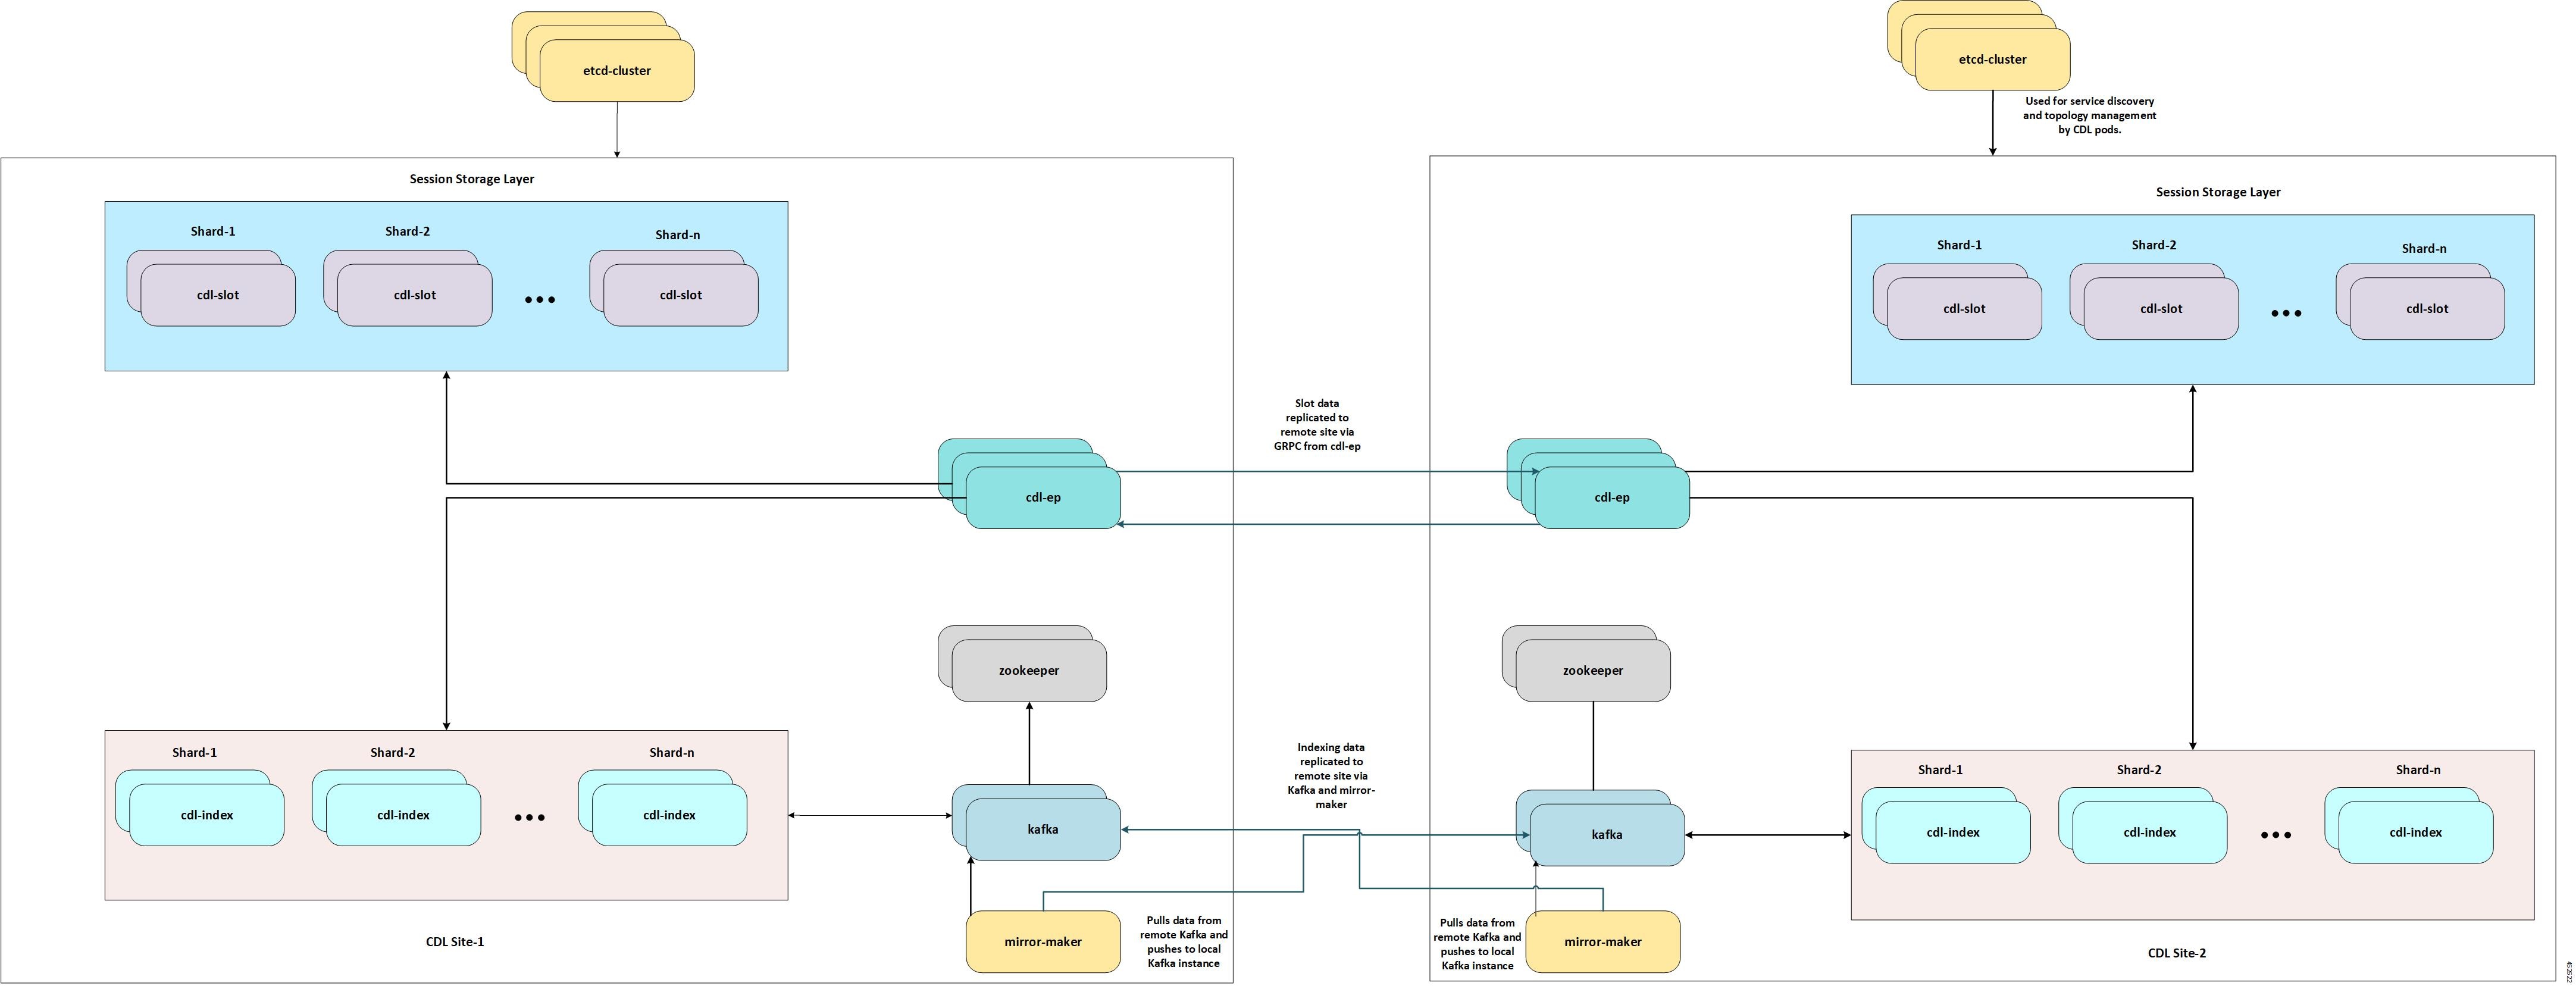
The following figures depict the CDL high-level architecture:
Figure 3. CDL Architecture
The following figures depict the CDL high-level architecture with primary
components:
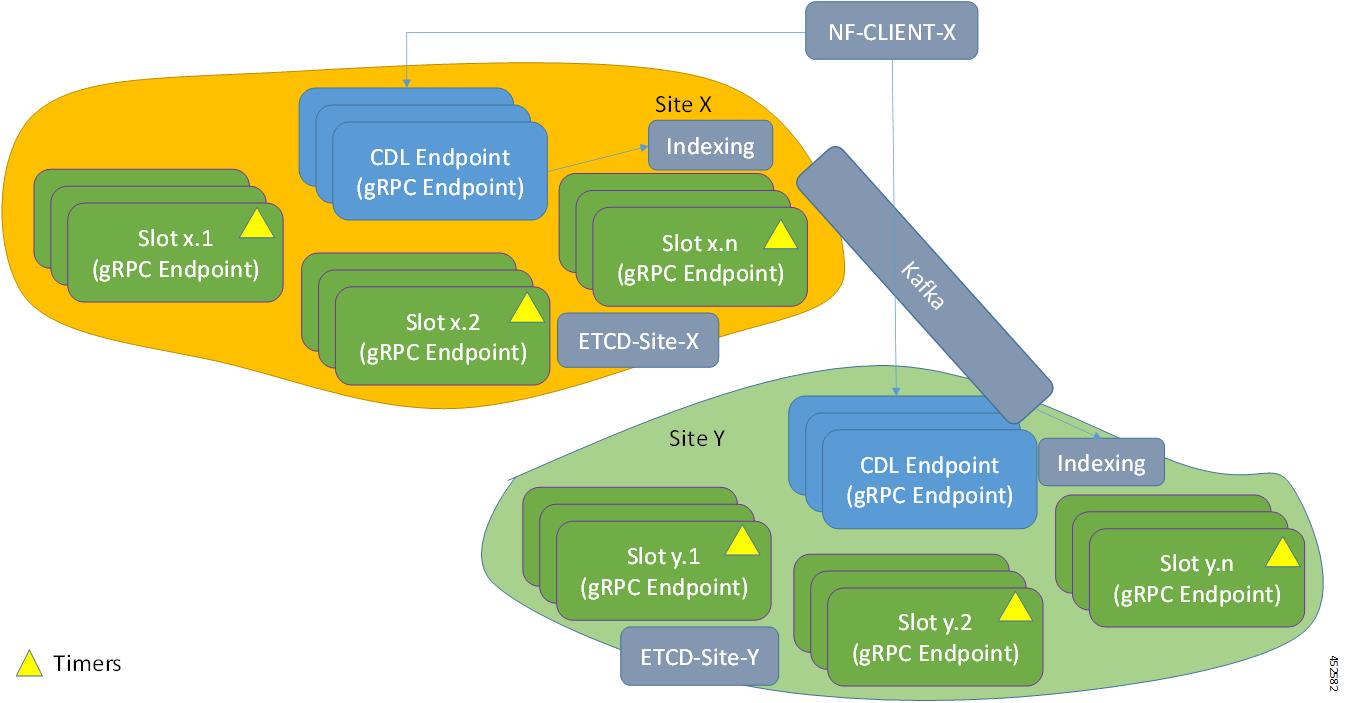
Figure 4. CDL Architecture with Primary Components
CDL Endpoint
The CDL endpoint pod is the front-end for receiving requests from NF application
towards CDL. The CDL endpoint exposes gRPC over HTTP2 interface towards the NF
client's for processing database service requests. Each pod starts with the
following attributes:
systemID: This parameter specifies the site ID (For instance: Site).
clusterID: This parameter specifies the unique datastore ID within a site (For instance: X, Y).
The CDL endpoint receives the Create, Read, Update, Delete (CRUD) requests from the NF
applications. It communicates with the CDL Index and Slot pods over GRPC to perform
these operations.
The CDL endpoint learns about the other pods within a site automatically using the
etcd. Also, the Cisco Data Store K8s pod is stateless in nature and does
not maintain any session stickiness. The CDL endpoint receives the request from NF
application and communicates with Slot and Index pods internally through GRPC to
handle the request accordingly. It returns the response after the processing is
complete.
When the CDL endpoint receives a Create, Delete, or Update session, the receiving
container replicates it to the Slot and Index pods and sends a response only when
'n' number of writes are acknowledged (ACKed) by the Index and Slot microservices.
Note
A maximum of four virtual CPUs (vCPUs) is required for deploying the CDL endpoint
pod in production environment.
Single Compute or Node Failure
When a single compute or node fails, one of the cdl-ep pods goes down and
tries to schedule on the other session nodes. If all the other session nodes already
have a cdl-ep, pod scheduling will not take place since there is node
anti-affinity defined for cdl-ep pods. So, with single node failure, the
remaining cdl-ep pods handle the traffic and might get loaded with the many
requests. After recovering from the node failure, the cdl-ep pod, which was
in the pending state earlier, starts scheduling on the recovered node to process the
requests.
Multiple Compute or Node Failures
If all the session nodes fails, it brings down all the cdl-ep pods along with
it. When Geo High Availability (GeoHA) is configured, the NF application talks to
the remote site to continue processing the sessions on the local site. But, in High
Availability (HA) scenario, this leads to a complete downtime.
Slot
The CDL Slot pod stores the actual session data. The CDL endpoint connects to all the
Slot pods within the cluster to replicate the session data to all the pods. These
microservices are K8s pod deployed for exposing internal gRPC interface towards the
Cisco Data Store. Each pod starts with the following attributes:
systemID: This parameter specifies the site ID (For instance: Site-1).
clusterID: This parameter specifies the unique datastore ID within a
site (For instance: Session).
mapID: This parameter specifies the replica set ID within the cluster.
(For instance: map-1, map-2,..map-n).
instanceID:This parameter specifies the instance ID within the replica
set. (For instance: map-1.instance-1,map-1.instance-2)
Each Slot pod holds a finite number of sessions and pre-allocated memory for the
storing session data. Also, each replica within the replica set (mapID) has a
defined anti affinity rule, which prevents the same blade form hosting multiple
member or instances of the same replica set (for high availability in case of a
blade or node failure). Each Slot pod maintains a timer and last updated ts. The
Slot pod generates the notification callback to the client NF for taking action when
the timer expires of if a conflict is detected.
Note
A maximum of two vCPUs is required for deploying the Slot pod in production
environment.
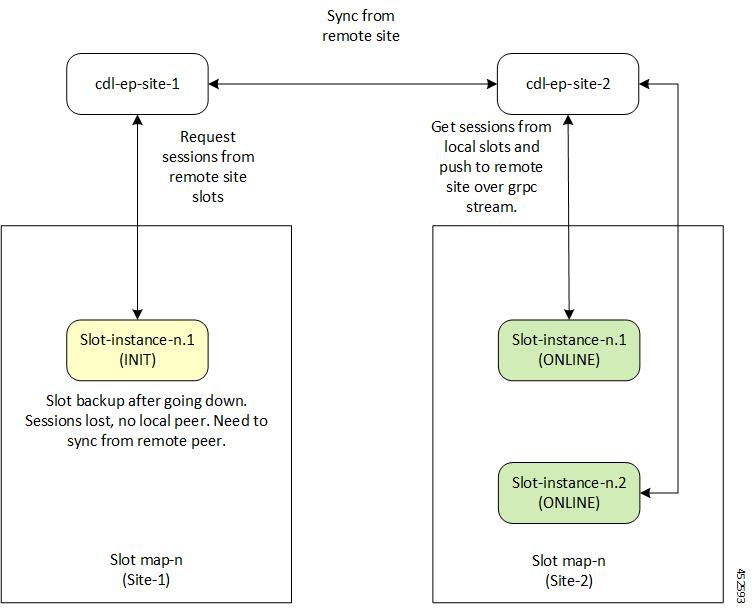
In the event of pod failover and recovery, the Slot pod recovers from:
Local Replica Member: The Slot directly reads from the gRPC stream in bulk directly to recover data.
Remote Replica Member: When there is no local replica available for
synchronization, the Slot reads the data from the remote site instances for
the same map.
The following figures depict the Slot recovery process from local and remote
peers:
Figure 5. Slot Recovery from Local Peer
Figure 6. Slot Recovery from Remote Peer
Data Slicing
Data slicing logically separates CDL as slices and stores the session data based on the slice name received from the Network
Functions (NF).
With data slicing, one or more NFs can store different types of session data in dedicated slices of CDL.
A default slice name called session is used if the slice names are not configured.
If the slice names are configured at the NF's ops-center or CDL's ops-center, every request from the NF must have a valid
slice name. If the slice name is different from what is configured or empty, then the request is rejected with an error code.
If the slice names are not configured, then the NF requests are routed to the default session.
The slice names cannot be updated in a running system post deployment.
Deleting CDL Slot Data
In certain scenarios, the CDL records are found on Slot but not in the index pods. The notifications from Slot towards the
application for such records do not receive the values correctly. The record in the slot is not deleted, if the index data
is not deleted.
Ensure the following before deleting the CDL Slot Data:
If the number of notifications to an application crosses a threshold value (default value of 3), a record is suspected to
be stale.
This triggers a validation check to find the corresponding record in any of the index pods (local or on any geo remote sites).
If there is a mismatch in map ID from index, or if the map ID is not found in all index pods, then a clean-up is invoked to
delete the record on local as well as remote sites.
The following parameters are introduced to delete stale records:
disable-auto-deletion:When set to true, the stale CDL records are not deleted. Auto deletion of stale records is enabled by default.
notification-retry-count:Specifies the minimum number of timer expiry notification retries sent to application without receiving an update from application.
If there are no updates received even after notification-retry-count times, cdl proceeds to check if slot record is stale.
The default number is 3.
The sample CDL configurations are as follows:
To disable the stale slot record auto deletion feature:
cdl datastore session
features slot-stale-session-detection disable-auto-deletion true
exit
You can change the notification-retry-count to a new value, for example 5. This indicates that the timer expiry notification
tries 5 times, after which it proceeds for checking whether the data is stale.
cdl datastore session
features slot-stale-session-detection notification-retry-count 5
exit
Troubleshooting
To enable troubleshooting logs for Stale CDL Slot Data on endpoint and slot pods, use the following configuration:
cdl logging logger ep.staleRecord.session
level info
exit
cdl logging logger slot.staleRecord.session
level info
exit
Single Compute or Node Failure
When there is a single compute failure, the CDL continues to function with one less
cdl-ep pod and replica for some Slots and Index pods. With a single
replica, the CDL Slot map continues to process all the requests. When the out of
service node is brought back to service, the Slot pods on the node syncs with its
respective peer, as depicted in the figure Slot Recovery from Local Peer.
Multiple Compute or Node Failures
In case of multiple compute failures, all the replicas for a Slot map goes down. For
instance, If two nodes are down, both the replicas of a Slot map goes down (the
default value of Slot replica count is two). This leads to an entire local
replica-set failure and triggers a shutdown of all the cdl-ep pods. Also, a
CDL Geo Replication (GR) is triggered, if GeoHA is configured. The NF application
talks to the remote site cdl-ep to process the requests when GeoHA is
configured. When there is no GeoHA configuration, it ultimately leads to a service
downtime.
When the failed nodes recover, the Slot pods and Slot replica set recovers and
synchronizes from the remote site (if both the replicas were down during the
failure). This will happen only if GeoHA is configured. The Slot Recovery from Remote Peer
figure depicts the initial synchronization from the remote peer when the entire
local replica set was down.
Indexing
The Indexing containers contain indexing data. There are two key pieces of information stored in the Index pod:
Primary key to Slot Map ID.
Unique secondary key to primary key mapping.
The index entries are created (an example use case) at the time of session connect
and removed at the time of disconnect. Using the in-memory KV store, Indexing stores
the keys in memory and provides a multi-master write. The indexing write log (set
and delete operations) are also written to Kafka pods for remote site replication.
One of the Index pods writes the logs in Kafka, which are then received at the
remote site. The corresponding operations are also performed at the remote site.
Note
A maximum of two vCPUs is required for deploying the Index pod in production
environment.
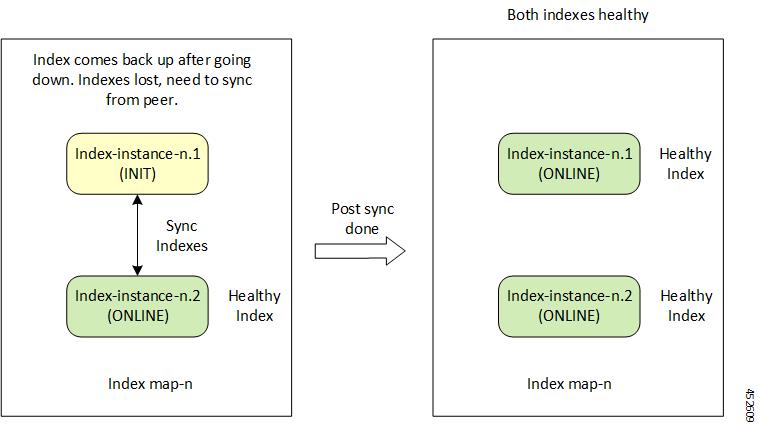
In the event of pod failover and recovery, the Index pod recovers from:
Local Replica Member - The Index directly reads from the gRPC stream
in bulk directly to recover data.
Remote Replica Member - If there is no local replica available for
synchronization, the Index reads the data from the remote site instances for
the same map.
The following figures depict the Index recovery process from local and remote
peers:
Figure 7. Index Recovery from Local Peer
Figure 8. Index Recovery from Remote Peer
Single Compute or Node Failure
When there is a single compute failure, the CDL continues to function with one less
cdl-ep pod and replica for some Slots and Index pods. With a single
replica, the CDL Slot map continues to process all the requests. When the out of
service node is brought back to service, the Index pods on the node syncs with its
respective peer, as depicted in the figure Index Recovery from Local Peer.
Multiple Compute Failures
In case of multiple compute failures, all the replicas for a Slot map goes down. For
instance, If two nodes are down, both the replicas of a Slot map goes down (the
default value of Slot replica count is two). This leads to an entire local
replica-set failure and triggers a shutdown of all the cdl-ep pods. Also, a
CDL Geo Replication (GR) is triggered, if GeoHA is configured. The NF application
talks to the remote site cdl-ep to process the requests when GeoHA is
configured. When there is no GeoHA configuration, it ultimately leads to a service
downtime.
When the failed nodes recover, the Index pods and Index replica set recovers and
synchronizes from the remote site (if both the replicas were down during the
failure). This will happen only if GeoHA is configured. The Index Recovery from
Remote Peer figure depicts the initial synchronization from the remote peer
when the entire local replica set was down.
ETCD
The CDL uses the etcd (an open-source key-value store) as the DB service
discovery. When the CDL pods (Endpoint, Slot or Index) is started, killed or
shutdown, it results in updating the event to etcd by publishing the
state.
The CDL endpoint is interested in knowing when a Slot or Index pod comes up or goes
down. Therefore, it subscribes to the notifications for Slot and Index pod events in
etcd.
Similarly, the CDL Slot or Index pod is interested in knowing when its peer replica
pod (with the same map-id) comes up or goes down. Therefore, it subscribes to the
notifications for corresponding Slot or Index (with same map-id) pod events in
etcd.
Thus, the notifications are sent to each of the pods subscribed to these events. In
addition, when a key event is added or removed, it refreshes the local map. The
etcd cache is only applicable for local site events.
Kafka
The Kafka pod replicates data between the local replicas and across sites for
Indexing. For replication across sites, Kafak uses MirrorMaker. The Kafka pods are
deployed on the session vms with the replica count set to a minimum of two
for high availability.
Zookeeper
Kafka uses the Zookeeper pod for managing Kafka clusters and coordinating with Kafka brokers.
Mirror Maker
The Mirror Maker pod geo-replicates the indexing data to the remote CDL sites. It takes data from the remote sites and publishes
it to the local Kafka site for the appropriate Indexing instances to pick up.
CDL Deployment Models
This section describes the different CDL deployment models, namely:
CDL HA.
Geo HA deployment.
The CDL HA deployment involves the following:
Each CDL pod consists of a minimum of two replicas for high availability.
The CDL endpoint pod discovers the local Slots and Indexes using etcd
for service discovery.
3. The Index and Slot pod data is distributed across maps (or shards) for
write scalability and each maps have at least one replica for high
availability. The default and recommended number of replicas for Slot and
Index replica is two.
The CDL endpoint on receiving request selects the Slot shard to which the
data is written to or read from. For new record creation, it selects the
Slot map in a round robin manner. For existing sessions, the slot map is
selected after looking up the primary key in indexing.
If new keys (primary or unique) are added or removed for a session, the CDL
endpoint sends the key to the Indexing pods. The Index map selection takes
place by hashing of the key and sending it to the appropriate Index map for
updating the key in the Index. For primary key, the Indexing pod stores the
Slot map-id where the session is stored. For unique-key, the Indexing pod
stores the primary-key where the session is stored.
The CDL endpoint forwards the Create, Update, Delete, or Find request to the
selected Slot(s) for writing or reading the data from the Slot memory. The
slot generates an appropriate response towards the endpoint on successful
processing of the request.
Each Indexing shard contains a leader which publishes the indexing operations
to Kafka bus for guaranteed local and remote replication.
Each Indexing pod instance listens to the Kafka bus for Indexing events. On
receipt of a set or delete event, it compares the time stamp of the event
with the time stamp of the Index already present. If the Kafka event time
stamp is greater than the current Index time stamp, it applies the operation
to the Indexing pod, else the event from Kafka is ignored.
Figure 9. CDL HA Deployment
The CDL Geo HA deployment involves the following:
For CDL Geo HA deployment, each site is configured with a remote site for
achieving geo redundancy.
In addition to sending the data to local Slots and Indexes, the CDL endpoint
also sends the request to remote site cdl-endpoint over GRPC to
replicate Slot data on the remote sites.
On receiving the Create,Update, or Delete request on the remote site, the CDL
endpoint forwards the request to Slots with the same map-id as selected in
the original site.
The Indexing data replication is achieved through the Mirror-maker. The
Mirror-maker on the remote site consumes the data from the Kafka of other
site and pushes the data to its local Kafka bus for replicating it to the
local Index pods.
Note
For Geo HA deployments, the round-trip time (RTT) recommended between two geo sites is 50ms.
Figure 10. CDL Geo HA Deployment
Call Flows
This section describes the following call flows:
Finding Record by Primary Key
Finding Record by Unique Key
Creating a Record
Updating a Record
Deleting a Record
Notification to NF on Timer Expiry
Geo Replication - Create (GEO)
Geo Replication - Update (GEO)
Geo Replication - Delete (GEO)
Finding Record by Primary Key
This section describes the call flow of finding a record by primary key.
Figure 11. Finding Record by Primary Key - Call Flow
Finding Record by Unique Key
This section describes the call flow of finding a record by unique key.
Figure 12. Finding Record by Unique Key - Call Flow
Creating a Record
This section describes the call flow of creating a record.
Figure 13. Creating a Record - Call Flow
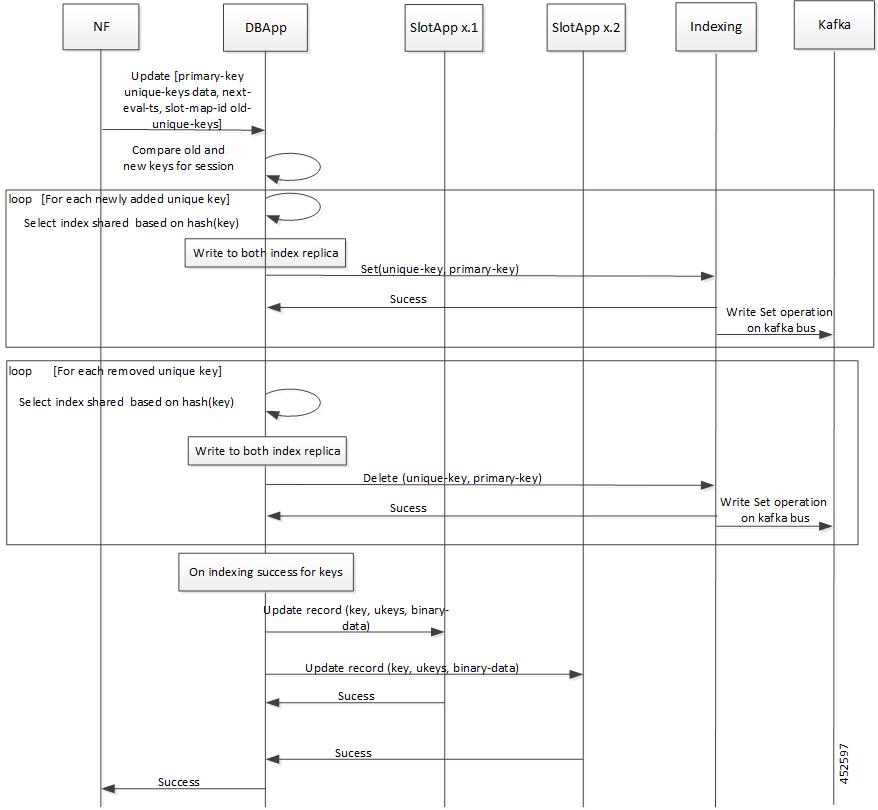
Updating a Record
This section describes the call flow of updating a record.
Figure 14. Updating a Record - Call Flow
Deleting a Record
This section describes the call flow of deleting a record.
Figure 15. Deleting a Record - Call Flow
Notification to NF on Timer Expiry
This section describes the call flow of session notification to NF on timer
expiry.
Figure 16. Session Notification to NF - Call Flow
Geo Replication - Create
This section describes the call flow of creating primary and unique keys for Geo
Replication.
In certain scenarios, the unique keys in index pods of the CDL are stale (presumed to be deleted). The NFs may try to use
these unique keys for another record, as the CDL does not show the stale record details to the NFs.
The CDL allows the operator to enable a parameter to detect the stale records and perform the necessary action on such stale
records.
To detect the stale records and perform actions:
Identify the stale records. When a new record is created, the unique key is overwritten. To identify such records, enable
the index-overwrite-detection parameter, and ensure that the unique-keys-prefix matches the prefix pattern.
Perform the necessary action (notify, delete or log) on the identified stale records.
The CDL detects any unique key that is overwritten and performs one of the following actions:
Deletes the stale record or the entire record. The delete action is triggered only if the PurgeOnEval flag is set to false for the stale record.
Notifies the NF about the stale record. The notify action sends the STALE_INDEX_NOTIFICATION to the NF.
Logs the overwritten unique key. For the log action, the stale record is logged with the WARN log level.
Note
If there are two different unique keys pointing to the same primary key; one with notify action and the other with delete
action, then the notify action is performed.
Use the following configuration:
features index-overwrite-detection max-tps variable
features index-overwrite-detection queue-size variable
features index-overwrite-detection unique-keys-prefix uk
  action [delete-record, notify-record, log-record]
where,
max-tps: Controls the rate of notification for stale records. The default is 200.
queue-size: Controls the processing queue size of the stale records. The default is 1000.
Note
The queue-size parameter is for both delete and notify actions. The max-tps parameter is only for the notify action.
unique-keys-prefix: Specifies the unique-key prefix pattern along with the action that needs to be performed.
Example:
cdl datastore session
features index-overwrite-detection max-tps 250
 features index-overwrite-detection queue-size 2000
 features index-overwrite-detection unique-keys-prefix uk
 action notify-record
 exit
  exit
Troubleshooting
To troubleshoot the stale index records, set the index.overwrite.session logger to INFO level. The logs from the endpoint pods as well as the index pods help in troubleshooting.
CDL configuration:
cdl logging logger index.overwrite.session
 level info
exit
The following metrics are introduced:
overwritten_index_records_deleted–maintains the total number of records deleted due to stale records identified at index.
overwritten_index_records_skipped–maintains the total number of records detected as stale, but dropped when the queue is full while processing the records
for notify or delete.
Deploying CDL through Network Functions (NFs)
You can deploy CDL through the Network Functions (NFs) – Session Management Function (SMF) and Policy Control Function (PCF)
– Ops Center.
For deploying CDL through SMF Ops Center, see Cisco Common Data Layer in SMF chapter in Ultra Cloud Core 5G Session Management Function - Configuration and Administration Guide
For deploying CDL through PCF Ops Center, see Cisco Common Data Layer in PCF chapter in Ultra Cloud Core 5G Policy Control Function -Configuration and Administration Guide
CDL Geo Replication (GR) Deployment
This section describes how to deploy CDL for Geo Replication (GR).
Prerequisites for CDL GR
Before deploying CDL GR, configure the following:
CDL Session Database and define the base configuration.
Kafka for CDL.
Zookeeper for CDL.
Configuring the CDL Session Database and Defining the Base Configuration
This section describes how to configure the CDL session database and define the base configuration through the NF (SMF or
PCF) Ops Center.
Open the NF Ops Center console and navigate to the datastore CLI.
To configure the session database and define the base configurations for the failover of the CDL operations, use the following
configuration.
cdl system-idsystem_id: Specifies the system or Kubernetes cluster identity. The default value is 1.
cdl node-typenode_type: Indicates the Kubernetes node label to configure the node affinity. The default value is session. node_type must be a string of length 0-64 characters.
cdl enable-geo-replicationboolean_value: This is an optional CLI. Specifies the geo replication status as enable or disable. The default value is false.
cdl remote-siteremote_system_id: Specifies the endpoint’s IP address for the remote site endpoint. Configure this command only when you have set the cdl enable-geo-replication to true.
db-endpoint hosthost_ip_address: Specifies the endpoint IP address for the remote site. Configure this command only when you have set the cdl enable-geo-replication to true.
db-endpoint portport_number: Denotes the endpoint port for the remote site endpoint. The default port number is 8882. Configure this command only when
you have set the cdl enable-geo-replication to true.
kafka-serverremote_kafka_host remote_port: Indicates the Kafka server’s external ip and port of the remote site, which the remote-system-id identifies. You can configure
multiple host and ports per Kafka instance at the remote site. Configure this command only when you have set the cdl enable-geo-replication to true.
endpoint replicanum_replica: Indicates the number of replicas to be created. The default value is 1. num_replica must be in the range of 1 to 16.
endpoint external-ipip_address: This is an optional CLI. Specifies the external ip address to expose the database endpoint. Configure this command only
when you have set the cdl enable-geo-replication to true.
endpoint external-portport: Specifies the external Port to expose the database endpoint. Configure this command only when you have set the cdl enable-geo-replication to true. The default value is 8882.
slot replicanum_replica: Specifies the number of replicas to be created. The default value is 1. num_replicamust be in the range of 1 to 16.
slot mapnum_map/shards: Specifies the number of partitions in a slot. The default value is 1. num_map/shards must be in the range of 1 to 1024.
slot write-factorwrite_factor: Specifies the number of copies to be written before a successful response. The default value is 1. write_factor must be in the range of 0 to 16. Make sure that the value is less than or equal to the number of replicas.
slot notification hosthost: Specifies the notification server hostname or IP address. The default value is datastore-notification-ep.
slot notification portport: Specifies the notification server port number. The default value is 8890.
slot notification limittps: Specifies the notification limit per second. The default value is 2000.
index replicanum_replica: Specifies the number of replicas to be created. The default value is 2. num_replica must be in the range of 1 to 16.
index mapnum_map/shards: Specifies the number of partitions in a Slot. The default value is 1. The accepted range is 1–1024. Avoid modifying this
value after deploying the CDL.
index write-factorwrite_factor: Specifies the number of copies to be written before a successful response. The default value is 1. write_factor must be in the range of 0 to 16.
Configuring Kafka for CDL
This section describes how to configure Kafaka for the CDL.
Open the NF Ops Center console and navigate to the datastore CLI.
cdl kafka replicanum_replicas: Specifies the number of replicas to be created. The default value is 3. num_replicas must be in the range of 1 to 16.
enable-JMX-metricsboolean_value: Specifies the status of the JMX metrics. The default value is true.
external-ip ip_address port_number: Specifies the external IPs to expose to the Kafka service. Configure this command when you have set the enable-geo-replication parameter to true. You are required to define an external ip address and port number for each instance of the Kafka replica. For example, if
the cdl kafka replica parameter is set to 3, then you must define three external ip addresses and port numbers.
retention-timeretention_period: Specifies the duration (in hours) for which the data must be retained. The default value is 3. retention_period must be in the range of 1 to 168.
retention-sizeretention_size: Specifies the data retention size in MB. The default value is 5120 MB.
Configuring Zookeeper for CDL
This section describes how to configure the Zookeeper for CDL.
To configure Zookeeper for CDL, use the following configuration:
Open the NF Ops Center console and navigate to the datastore CLI.
cdl zookeeperdata_storage_size_in_gb: Specifies the size of the Zookeeper data storage in GB. The default value is 20 GB. data_storage_size_in_gb must be in the range of 1 to 64.
log-storage-sizesize_in_gb: Indicates the size of the Zookeeper data log’s storage in GB. The default value is 20 GB. size_in_gb must be in the range of 1to 64.
replicanum_replicas: Indicates the number of replicas that must be created. The default value is 3. num_replicas must be in the range of 1 to 16.
enable-JMX-metricsboolean_value: Indicates the status of the JMX metrics. The default value is set to true.
enable-persistenceboolean_value: Specifies the status of the persistent storage for Zookeeper data. The default value is false.
Deploying CDL for Geo Replication (GR)
For Geo Replication (GR), you have to create two separate HA systems independently
and configure the Geo HA for communications with the remote sites. By default, CDL
is deployed with two replicas for db-ep, one slot map (with two
replicas per map) and one index map (with two replicas per map).
Important
It is recommended to configure CDL containers in YANG model.
It is recommended to configure the Geo HA only after the two HA systems
become active.
To deploy the CDL GR, use the following configuration:
Procedure
Step 1
Deploy HA on site-1.
Deploy site-1 HA system without any Geo HA related configuration parameters and set the system-id parameter to 1 in the configuration.
(Optional) Configure the SSL/TLS certificate to enable TLS support for
the local site.
Configuring TLS certificates enable the local site to accept both
secure and non-secure connections. Similarly, configuring SSL
certificates enable the local site to establish a secure connection
with the remote sites.
Note
All the certificates are in multi-line raw text format. If the
certificates are invalid, the server continues with the non-secure
connection.
Verify whether Mirror Maker pod is deployed and all the other pods are active.
NOTES:
cdl kafka external-ip - Specifies the external IP address and port for all Kafka
replicas.
site_external_ip_address -
Specifies the external IP address of the remote site.
port_number - Specifies the port
number of the remote site.
cdl ssl-config certs - Specifies the SSL
certificates to establish a secure connection with remote site.
site_external_ip_address -
Specifies the external IP address of the remote site.
ssl-keyssl_key -
Specifies the generated SSL key.
Geo Replication (GR) Failover Notification
The CDL is equipped with Geo Replication (GR) failover notifications, which can notify the timer expiry of session data and
bulk notifications to the currently active site. The CDL uses Border Gateway Protocol (BGP) through App-Infra for the GR failover
notifications.
The CDL subscribes to the key value on both the GR sites. The App-Infra sends notifications to the CDL when there is any change
in these key values. A key value indicates the state of the CDL System ID or the GR instance. The GR instance is mapped to
the CDL slices using the CDL system ID or the GR instance ID in the key.
The following parameters are introduced for CDL GR failover notification:
instance-aware-notification enable true or false - Set this to true to enable GR failover notification.
instance-aware-notification system-id - The system-id maps to the sliceName, that is, the primary system-id maps to the primary site ID of that particular sliceName.
This information must be configured on all the geo sites. The FindAllNotify and TimerExpiry notifications use the system ID details for bulk processing tasks.
The system ID is mandatory on both the sites. The GR instance ID in the NF configuration must match the CDL system ID.
In the following example, the GR failover notification is set to true. The system-id 1 is the primary site ID for sliceNames
sgw1 and smf1while system-id 2 is the primary site for slicesNames sgw2 and smf1.
cdl datastore session
 features instance-aware-notification enable true
 features instance-aware-notification system-id 1
  slice-names [ sgw1 smf1 ]
 exit
 features instance-aware-notification system-id 2
  slice-names [ sgw2 smf2 ]
 exit
exit
GR Failover Notification Records of Peer Site
The CDL sends notification about records only to its local application. The notification is based on the system-id and Timer
Expiry parameters of the records. In a GR setup, when a site is isolated for maintenance, the records of that site are not
sent to its peer site.
With the remote-system-id parameter, CDL allows the peer site to process notifications of the isolated site. The remote-system-id of the peer site is configured with the site ID of the isolated site. The CDL processes records when the system-id of any
record matches the remote-system-id. The notifications are sent based on the Timer Expiry, or for the records that have the
notifyOnPurge enabled.
Note
The remote-system-id must be removed from the CDL configuration after the isolated site resumes its function.
The following procedure explains the configuration of remote-system-id with an example:
In the example below, the GR setup has 2 sites: site-1 and site-2. The site-1 is disconnected for an upgrade, and the remote-system-id
of site-2 is configured with the site ID of site-1.
Shutdown or disconnect the site-1.
To configure the remote-system-id of site-2 with site ID of site-1, run the following command:
Note that the value [1] for remote-system-id in the above command is the site ID of site-1, which is isolated.
The site-2 starts notifying records of site-1 to the local application.
Before bringing up site-1, remove the site ID of site-1 from the remote-system-id list of site-2.
The remote-system-id is mutually exclusive with the instance-aware-notification-system-id. For more information, refer to the Geo Replication (GR) Failover Notification topic.
Triggering Remote Index Sync
The CDL provides a utility to sync the indexes with its remote peers. The utility can be used in the scenarios such as post
site isolation, where there is a huge difference in the number of index records between the sites. The CDL also supports a
command to check the status of the remote index sync.
Note
It is recommended to use the remote sync only if there is a huge difference in the index records between the sites as this
might impact the performance.
The geo-remote-site should be configured to view the commands.
Trigger remote index sync for,
a list of index mapIDs or all mapIDs from the cli.
a list of sliceNames or all the sliceNames.
Note the following:
Ensure the conditions below are met to avoid errors while triggering a remote sync for index with its peers.
The custom map-ids and slice-names should be unique.
Only valid index map-ids and slice-names are allowed.
Remote site is reachable.
Internally, CDL retries a maximum of 3 times to sync with its remote peer.
The remote index sync skips the index instance if the sync is already ongoing for that instance.
Command
cdl actions remote-index-sync start[options]
Options
map-id
Index map-id for which the remote index sync should start. The map-id is optional. If included, triggers remote index sync
for all the instances of that index map-id. A maximum of 5 map-ids can be given using this option.
slice-name
The slice-name for which the remote index sync starts. The slice-name is optional. If included, triggers remote index sync
for all the slice-names. There is no limit for the number of slice-names.
Output Parameter
triggered-instances
Shows the list of index instances for which the remote index sync has been started.
The remote sync status shows the index instances for which the remote index sync is in progress.
Note
The remote sync status does not show the sync status per sliceName. If the sync status shows that a particular index instance
is syncing with the remote site, it means all the sliceNames or the listed sliceNames are syncing one after the other.
Command
cdl actions remote-index-sync status
Output parameter
syncing-instances
List of index instances for which the remote index sync is in progress.
The following warning or error logs in Index pods show the status of the remote index sync.
The sync is successful with the following:
Log:
Bulk Sync done from Remote Indexes(s) for isInitSync = false
Example:
[datastore.index.session] Bulk Sync done from Remote Indexes(s) for isInitSync = false sliceName = session via DBApp
Log:
Sync finished successfully with Remote MemoryMap App isInitSync: false
Example:
[datastore.index.session] Sync finished successfully with Remote MemoryMap App isInitSync: false count: 100 Time taken: 16.699031ms sliceName: session
The sync fails with the following error log:
Example:
Error! Remote Bulk Read failed 3 times for isInitSync = false
Feature Summary and Revision History
Summary Data
Applicable Product (s) or Functional Area
PCF 2021.04.0 and later
Applicable Platforms
Bare Metal, OpenStack, VMware
Feature Default Setting
Disabled – Configuration Required
Related Changes in this Release
Not Applicable
Related Documentation
Not Applicable
Revision History
Revision Details
Release
First introduced.
CDL 1.6
Feature Description
In this release, the CDL supports IPv6, thus enabling the dual stack support for its endpoints in a GR enabled setup. Dual
stack enables networking devices to be configured with both IPv4 and IPv6 addresses.
This feature provides the following functionality:
IPv6 support for the CDL endpoints.
IPv6 support for communicating between Mirror Maker and Kafka brokers.
TLS support for CDL and Kafka IPv6 endpoints.
Note
To get IPv6 support in CDL, the K8s cluster must support dual stack and it must be enabled in the cluster.
Configuring the IPv6 Support
To configure IPv6 support for CDL in a GR enabled setup, use the CLI commands or configuration in the following steps:
Expose the CDL IPv6 endpoint and connect to remote site IPv6 endpoint.
Enable CDL geo replication.
configcdl enable-geo-replication true
Configure the external IP address for CDL endpoints. In addition to the endpoint external-ip, configure the endpoint external-ipv6 parameter too.
The IPv4 and IPv6 endpoints can be accessed over the same port (default value is 8882).
Note
Currently, the CDL can connect to remote site endpoints using either IPv4 or IPv6, but not both. However, it can simultaneously
expose both the IPv4 and IPv6 endpoints for the remote site to connect to either one of them.
Expose the CDL Kafka and connect to remote site Kafka over IPv6.
Configure the external IP address and port for all Kafka replicas.
You must configure IPv6 for each broker separately. It is possible to simultaneously expose the Kafka brokers over IPv4 and
IPv6, but the ports used must be different. Currently, the Kafka listeners do not support using the same port for different
IP addresses.
Configure the remote site Kafka configuration.
Mirror Maker can connect to both local site and remote site Kafka brokers either over IPv4 and IPv6 or only one of them.
Configure the remote kafka-server separately using the following CLI command:
(Optional step) Configure the SSL/TLS certificates to enable TLS support for both local and remote sites. These certificates
help to establish a secure connection between the local and remote sites.
Use the same configuration to configure the certificates on each site.
This section describes the alarms in the CDL deployment.
The following alarms are introduced to detect failure:
Table 2. Alarms
Alarm
Severity
Description
cdlLocalRequestFailure
critical
This alarm is triggered if the local request success rate is less than 90%, for more than 5 minutes.
cdlRemoteConnectionFailure
critical
This alarm is triggered if the active connections from the endpoint pod to the remote site reaches 0, for longer than 5 minutes.
This alarm is for GR deployment only.
cdlRemoteRequestFailure
critical
This alarm is triggered if the incoming remote request success rate is less than 90%, for more than 5 minutes. This alarm
is for GR deployment only.
cdlReplicationError
critical
If the ratio of outgoing replication requests to the local requests in cdl-global namespace is below 90%, for more than 5
minutes. This alarm is for GR deployment only.
cdlKafkaRemoteReplicationDelay
critical
This alarm is triggered if the kafka replication delay to the remote site crosses 10 seconds, for longer than 5 minutes. This
alarm is for GR deployment only.
CDL Overload Protection
The CDL offers overload protection at endpoints whenever the system reaches its full
capacity. With overload protection at endpoints, the CDL can:
Reject create requests if maximum soft limit is reached.
Reject update requests if maximum hard limit is reached.
Trigger alarms when the system reaches 80% and 90% of its maximum
capacity.
Configure overload protection (enable or disable) at endpoints.
CDL Maximum Capacity
You can define the maximum capacity per shard in CDL using the following
parameters:
Based on the following calculations, the CDL determines the maximum capacity:
Soft Limit
cdl_slot_record_capacity = No of shards * slotRecordCapacity
cdl_index_record_capacity = No of shards * indexRecordCapacity
cdl_slot_size_capacity = No of shards * slotRecordsSizeCapacityInBytes
Hard Limit
cdl_slot_record_capacity = No of shards * slotRecordCapacity * 105%
cdl_index_record_capacity = No of shards * indexRecordCapacity * 105%
cdl_slot_size_capacity = No of shards * slotRecordsSizeCapacityInBytes * 105%
Triggering Alerts for Overloading in CDL
The CDL is overloaded whenever the system reaches its maximum capacity. Also, the CDL
triggers the following alerts to protect the system from overloading:
cdlOverloaded - major - This alert is triggered when the CDL system reaches 80% of its
capacity.
cdlOverloaded – critical - This alert is triggered when the CDL system
reaches 90% of its capacity.
In addition to the alerts, the CDL endpoint rejects all the create requests
with the following error:
error code 507: Datastore reached its full capacity
However, the CDL processes all the update requests till the hard limit
capacity is reached. When the hard limit capacity is exceeded, the CDL rejects all
the update requests.
Configuring Overload Protection
The the existing CDL overload protection configuration is replaced with a new configuration.
Note
Earlier, the overload protection was enabled by default with hard coded limits of 1 million records per slot, 10 million records
per index and 5 gb record size per slot. However, in this release, the feature is disabled by default and requires configuration
to enable this feature and to configure the appropriate overload limits (optional) for each parameter.
The old CDL overload protection command is deprecated.
Note
The command is not functional but is available only for backward compatibility.
New command:
cdl datastore session features overload-protection enable<true/false>
The overload protection configuration is moved under cdl datastore session features configuration to configure overload-protection and alerts.
CDL is now equipped to configure:
record-capacity per slot/index
record-capacity in bytes per slot
configure major and critical alarm %
If the overload protection is enabled then the alerts are also enabled. The prometheus-rules-cdl pod is spawned. If overload-protection
is disabled then the alerts are disabled. The prometheus-rules-cdl pod is removed.
Configuring Overload Protection Parameter
The following parameters are configured to set limits for overload-protection:
cdl datastore session features overload-protection index-max-record-count<value>
cdl datastore session features overload-protection slot-max-record-count<value>
cdl datastore session features overload-protection slot-max-size<value>
cdl datastore session features overload-protection hard-limit-percentage<value>
cdl datastore session features overload-protection enable<true/false>
(Optional) CDL overload-protection is disabled by default. The default value is false.
cdl datastore session features overload-protection index-max-record-count<value>
(Optional) Maximum number of records that can be stored in the Index shard.
The default value is 60000000 (60M).
The range is 100k to 100M.
Note
The range from 100 to 1000 is applicable only for testing in the lab environment. It is not recommended for production environment.
cdl datastore session features overload-protection slot-max-record-count<value>
(Optional) Maximum number of records that can be stored in Slot shard.
The default value is 2500000 (2.5M).
The range is either 100 or 100k to 10M.
Note
The value 100 is applicable only for testing in the lab environment. It is not recommended for production environment.
cdl datastore session features overload-protection slot-max-size<value>
(Optional) Maximum size of Slot shard in mega bytes.
The default value is 16384 (16GB).
The range is 1GB to 96GB.
cdl datastore session features overload-protection hard-limit-percentage<value>
(Optional) Additional capacity (percentage) in addition to the soft limit. This is used to determine when to reject the update
requests at CDL endpoint. For eg: if index shard = 1, index-record-capacity = 100 and hard-limit-percentage = 5, then the
create requests are rejected when number of index records = 100 and update requests are rejected only when it reaches 105.
The default value is 5. The range is 0-10.
cdl datastore session features overload-protection major-alert-threshold<value>
(Optional) Threshold (percentage) at which CDL triggers an alert cdlOverloaded-major.
The default value is 80.
The range is 40-100.
cdl datastore session features overload-protection critical-alert-threshold<value>
(Optional) Threshold (percentage) at which CDL triggers an alert cdlOverloaded-critical.
The default value is 90.
The range is 40-100.
To configure the alert percentage, run the following command:
cdl datastore session features overload-protection critical-alert-threshold<percentage>
cdl datastore session features overload-protection major-alert-threshold<percentage>
Verifying the Alerts
You can verify the alerts using the following command in CEE Ops Center CLI:
show alerts active { detail | summary }
Also, you can filter the alerts in CEE Ops Center CLI using the following
command:
show alerts active detail sumary"CDL is overloaded."
In the following example, the cdlOverloaded - major alert is triggered when
the system capacity is greater than or equal to 80%
alerts active detail cdlOverloaded-major 5446095ab264
 severity    major
 type        "Processing Error Alarm"
 startsAt    2020-10-15T15:09:00.425Z
 source      System
 summary     "CDL is overloaded."
In the following example, the cdlOverloaded - critical alert is triggered when
the system capacity is greater than or equal to 90%
alerts active detail cdlOverloaded-critical 5446095ab264
 severity    critical
 type        "Processing Error Alarm"
 startsAt    2020-10-15T15:09:16.425Z
 source      System
 summary     "CDL is overloaded."
FindAll and FindAllNotify Query Enhancements for CDL
Feature Description
In this release, the CDL supports enhancements for the FindAll and FindAllNotify queries.
New query filters are introduced to support the following operations:
A maximum of 20 IN filters in the FindAllNotify query. The CDL retreives all sessions from a slot and then matches each session
with the passed filters. If the session keys match with any one of the passed filters, then notify the same to the NF with
the matched IN filter condition.
A NOT-MATCH operation with more than one condition.
The IN and NOT operations in the CDL CLI.
IPC streaming for the notifications.
In the previous releases, the CDL used a unary RPC for sending notifications to the application. With this release, the CDL
supports the bidirectional streaming RPC for optimizing IPCs between it and the application.
How it Works
This section describes the sequence of operations for the CDL to support the different filter conditions in FindAll and FindAllNotify
queries.
Support IN Filters
The system checks for all the AND and IN conditions inside the query parameter.
If both the AND and IN query filters are in the query, then it's processed in the following manner:
The CDL first checks all the AND filters. If any of the AND filter fails, then it skips the other AND filters and IN filters
because the key did not match the filter.
After all the AND filters are matched, then check the IN filters. If any of the IN filters is matched, then the CDL skips
the other IN filters because the key already matched the filter.
If only the IN filters are in the query and any of the IN filter is matched, then the CDL skips processing the other IN conditions.
If there are more than 20 IN filters in the query request, then respond back with a 400 Bad Request message.
The CDL sends the matched IN filter condition along with the notification only when it is enabled in the FindAllNotify query
request.
Note
If more IN filters are passed in the request, the query performance is impacted.
Support NOT-MATCH Operation with More than One Condition
The CDL supports the additional conditions for this query filtering:
not-match
not-starts-with
not-ends-with
not-contains
Note
If any key(pk/uk/nuk) in a session satisfies the NOT condition, then that session is matched for the filter.
Support the IN and NOT Operations in the CDL CLI
Support the following additional conditions for filtering the sessions in CLI:
contains
not-contains
not-ends-with
not-starts-with
not-match
Support the in-filter filter in addition to the AND filter filter for the IN operations in CLI
The following code snippet is a sample CLI command:
The filter and in-filter filters are a list of conditions. The query supports a maximum of 20 in-filters filters. The order of the filters, filter and in-filter does not matter as the filters mentioned with filter are grouped together. Likewise, the filters mentioned with in-filter are also grouped together.
The following CDL operations are supported for filtering with filter and in-filter:
cdl show sessions count summary
cdl show sessions count detailed
cdl show sessions detailed
cdl show sessions summary
cdl clear sessions
Support Streaming Notifications
The CDL uses bi-directional streaming RPC to send the notifications over a stream with a transaction ID to the application.
The response is sent in a different stream from the application to the datastore with the transaction ID for correlation.
By default, the CDL uses unary RPC and the streaming functionality is disabled. Streaming is enabled only when the feature
flag use-stream is configured in the CDL CLI. If the streaming is enabled, then all the CDL notifications are sent using the streaming.
To enable the streaming for notification functionality, use the following CLI command:
If the streaming is enabled, then by default there are four stream connections from the CDL to a notification endpoint. The
connection count can be configured by using the CDL CLI. The stream connections are used in the round robin manner.
Support metrics to check the number of active stream connections from the slot or endpoint to the notification endpoint. Use
these metrics to generate alerts when there is no active stream connection.
Troubleshooting Information
This section describes how to resolve some of the known issues in CDL configuration. Before proceeding with troubleshooting
CDL configurations, consider the following:
system-id is unique across the site.
cluster-id (datastore id) is unique within the site.
You cannot change the replica of Index after deploying the CDL. To change the replica:
Set the system mode to "shutdown".
Change the replica.
Set the system mode to "running".
The replica of Endpoint, Index, Slot and Kafka pods must be less than or equal to the number of k8 nodes with the following
label and value:
Label: smi.cisco.com/node-type.
Value: Value of cdl/node-type. In a multi-node setup, the default value is session.
The replica of Zookeeper and ETCD pods must be less than or equal to the number of k8 nodes with the following label and value:
Label: smi.cisco.com/node-type.
Value: oam.
In a Geo-replication setup (across the sites cluster-id), the replicas, and maps of the Index and Slot pods must be identical.
Otherwise data replication may fail.
CDL Index are not Replicated Accurately
This section describes how to replicate the CDL Index pods accurately.
Issue Description
The session data is not replicated properly to the remote site.
Identifying the Issue
The data added at one site is inaccessible at the other site.
Possible Causes
The incorrect Geo-replication configuration may cause this issue.
Resolution
To resolve this issue:
Verify the local system-id and remote site configuration.
Verify whether CDL endpoints and Kafka between each site are reachable.
Verify the map, replica of index and slot at each site. They must be identical across all the sites.
CDL Operations are Failing but the Connection is Successful
This section describes how to resolve the CDL operation failure issue.
Issue Description
The NF connects to the CDL, but the session operations such as find, create, update, and delete fail.
Identifying the Issue
You can view the NF log files to identify the call failure.
Possible Causes
You might encounter this issue when the CDL Index and Slot pods are not ready.
Resolution
To resolve this issue:
Verify whether all the pods are in ready and running state.
The Index pods move to the ready state only if the synchronization is complete with peer replica (local or remote if available).
The Slot pods move to the ready state only if the synchronization is complete with peer replica (local or remote if available).
At least one slot and index pod must be available for the Endpoint to move to ready state. Even when it isn’t ready, the client
accepts the GRPC connection.
CDL Pods are Down
This section describes how to bring up the CDL pods when they are down.
Issue Description
The CDL pods are not in the "running" state because of incorrect CDL configuration.
Identifying the Issue
Verify the "describe pods" output (Containers, Member, State, Reason, or Events) to identify whether the pods are down with
the following command:
kubectl describe pods -n<namespace> <failed pod name>
Possible Causes
The possible causes are:
Pods are in "pending" state.
Pods are in "CrashLoopBackOff" failure state.
Pods are in "ImagePullBack" failure state.
Resolution
When the pods are in "pending" state:
Verify whether the k8s nodes with the label value cdl/node-type are present. Also, ensure that the number of replicas are less than or equal to the number of k8s nodes with the label value
cdl/node-type.
kubectl get nodes -l smi.cisco.com/node-type=<value of cdl/node-type, default value is 'session' in multi node setup)
When the pods are in "CrashLoopBackOff" failure state:
Verify the status of the ETCD pods.
kubectl describe pods -n <namespace> <etcd pod name>
If the ETCD pods are not running, resolve the ETCD issues to bring up the pods.
When the pods are in "ImagePullBack" failure state:
Verify whether the helm repository and image registry are accessible.
Verify whether the required proxy and DNS servers are configured.
Mirror Maker Pod is in Not Ready State
This section describes how to move the Mirror Maker pods that remain in the "Not
Ready" state.
Issue Description
The Mirror Maker pods are not in running state because of connectivity issues on the remote site.
Identifying the Issue
Verify the Describe pod's output and pod logs with the following command:
kubectl describe pods -n <namespace> <failed pod name>
kubectl logs -n <namespace> <failed pod name> [-c <container name>]
Possible Causes
Connectivity issues with remote site Kafka brokers may cause this issue.
Resolution
To resolve this issue:
Verify whether the external IPs configured for Kafka are accurate.
Verify whether the remote sites of Kafka are reachable through the external IPs.
Early or Delayed Notification for Purging Record from CDL
This section describes how to resolve the early or delayed notification sent for purging record from CDL.
Issue Description
The notification sent for purging record from CDL is either early or delayed.
Identifying the Issue
While purging record from CDL, the notification comes either early or delayed.
Possible Causes
The nodes in the Kubernetes cluster are not time synchronized.
Resolution
To resolve this issue:
Verify whether all the nodes in the k8s cluster are time synchronized.
Verify the synchronization status on all the k8s nodes.
This section describes how to resolve the sessions pile up on CDL.
Issue Description
The number of sessions pile up because of some network issues or an unexpected number
of sessions on CDL, which does not match with the peer session count.
Identifying the Issue
The session count from the CLI or Grafana dashboard displays a higher session count
than expected or the sessions are rising constantly.
Possible Causes
The Create request received at CDL are more than the Delete request.
Consequently, the session count keeps on growing.
Resolution
To resolve this issue, the respective NF must take appropriate action for triggering
clear for the subscribers.
User-Defined Scheduling and Pod Placement
This section describes how to resolve unschedulable pods issue that may arise by
using single node label for scheduling, node affinity, and pod placement in CDL
pods.
Issue Description
The nodeType parameter controls scheduling, node affinity, and pod placement
in CDL. Currently, this parameter is configured with a single node label value
smi.cisco.com/node-type. When CDL is configured to its full node
capacity, the pods are marked as unschedulable (sometimes) because of the single
node label usage.
Identifying the Issue
The CDL pods are marked as unschedulable.
Possible Causes
The usage of single node label for scheduling, node affinity, and pod placement.
Resolution
You can control different CDL pod types using separate node labels. To create
separate node labels:
(Mandatory) Create smi.cisco.com/node-type label on all the nodes used
for CDL through SMI Cluster Manager Ops Center CLI.
Create labels for CDL pods as specified in the following table:
Pods
Label
Value
CDL Endpoint pods
smi.cisco.com/cdl-ep
true
CDL Slot pods
smi.cisco.com/cdl-slot-<MAP Id 1..n>
true
CDL Index pods
smi.cisco.com/cdl-index-<MAP Id 1..n>
true
Note
This configuration is required only for user-defined scheduling.
Example
The following example shows how to create separate node labels for CDL which uses
four different nodes with two endpoint replicas, four Slot maps (with two replicas
each) and two Index maps (with two replicas each).
cdl label-config session
  endpoint key smi.cisco.com/cdl-ep
  endpoint value true
  slot map 1
    key smi.cisco.com/cdl-slot-1
    value true
  slot map 2
    key smi.cisco.com/cdl-slot-2
    value true
  slot map 3
    key smi.cisco.com/cdl-slot-3
    value true
  slot map 4
    key smi.cisco.com/cdl-slot-4
    value true
  index map 1
    key smi.cisco.com/cdl-index-1
    value true
  index map 2
    key smi.cisco.com/cdl-index-2
    value true
cdl datastore session
  label-config session
  endpoint replica 2
  index replica 2
  index map 2
  slot replica 2
  slot map 4
exit
Monitoring
This section describes how to monitor the status and records in CDL. You can also monitor CDL through Grafana dashboards.
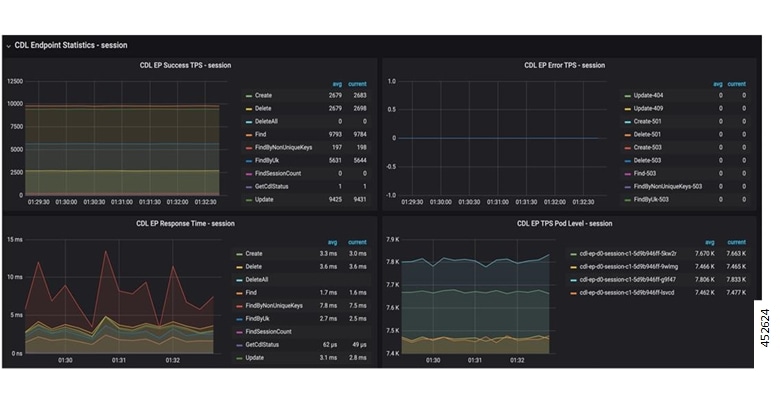
Monitoring CDL through Grafana Dashboards
You can monitor various activities in CDL through the Grafana dashboard called CDL Dashboard, which is bundled by default.
The CDL Dashboard displays the TPS towards CDL for various pods like cdl-endpoint, Slot, Index and the response time taken for each operation.
A sample Grafana CDL Summary dashboard displaying the total records by Type, SliceName, SystemID and so on is shown below:
Figure 20. Grafana CDL Dashboard - Summary
A sample Grafana CDL dashboard displaying the CDL TPS and response time graphs is shown below:
Figure 21. Grafana CDL Dashboard - CDL TPS and Response Time
The Grafana CDL dashboard is enhanced to show the Geo Replication status. A sample Grafana dashboard displaying the Geo Replication
status and other details is shown below.
Figure 22. Grafana CDL Dashboard - GR Connection Status
The GR connection, Index replication and slot replication panels, and their descriptions are listed in the table below:
Table 5. GR Connection Status
Panel
Description
Remote Site connection status
The remote site connections active per endpoint pod (in percentage). If it reaches 0 for more than 5 minutes, an alert is
triggered.
Index to Kafka connection status
The average kafka connections currently active from each index pod.
Kafka Pod status
The readiness status of Kafka pod and mirrorMaker pods.
Replication Requests Sent/Local Requests Received %
The ratio of replication requests sent to the remote site vs the local requests received by the NF. If the ratio goes below
90% for more than 5 minutes, an alert is triggered.
Kafka Remote Replication delay per pod
The total delay for replicating records to the partner site via Kafka. If the delay is more than 10 seconds in replicating
the records for more than 5 minutes, then an alert is triggered.
Total Remote requests dropped
The total number of remote requests that have been dropped due to the queue being full.
Table 6. Index Replication
Panel
Description
Kafka Publish TPS per pod
The per index pod total rate of kafka write requests (publish).
Kafka Remote Replication TPS per pod
The per index pod total rate of incoming kafka requests (consume) from the partner site.
Table 7. Slot Replication
Panel
Description
Slot Geo Replication Requests Sent
The total rate of replication requests from cdl-ep to remote site per operation.
Slot Geo Replication Requests Received
The total rate of replication requests received by the slot pods per operation type.
Slot Checksum Mismatch
The total rate of slot checksum mismatch.
Slot Reconciliation
The total rate of slot reconciliation due to slot data checksum mismatch.
Verifying the Status and Records in CDL
You can verify the status of the CDL and inspect the data inserted by the client using the cdl show statuscommand in the CDL Ops Center. For more information on cdl show status command, see the UCC CDL Command Reference Guide.
The following example displays the status of all the CDL components and client's data.
[unknown] cdl# cdl show status
message params: {cmd:status mode:cli dbName:session sessionIn:{mapId:0 limit:10000 filters:[]}}
site {
    system-id 1
    cluster-id 1
    db-endpoint {
        state STARTED
    }
    slot {
        map-id 1
        instance-id 2
        records 100
        capacity 1000000
        state STARTED
    }
    slot {
        map-id 1
        instance-id 1
        records 100
        capacity 1000000
        state STARTED
    }
    index {
        map-id 1
        instance-id 2
        records 500
        capacity 2500000
        state ONLINE
    }
    index {
        map-id 1
        instance-id 1
        records 500
        capacity 2500000
        state ONLINE
    }
}
[unknown] cdl#


 Feedback