Downloads |
 Feedback Feedback
|
Table Of Contents
GUI Representation of Cisco IOS CLI Commands
Border Router Interface Configurations
Explanation Of Cost Minimization
GUI Representation of Cisco IOS CLI Commands
This chapter shows examples of how some functions common to both the Cisco IOS version of Cisco OER and the Cisco OER Master Controller Engine are represented in CLI commands and the GUI, which is a feature of the Cisco OER Master Controller Engine.
Key Chain Configurations
Figure 2-1 shows the Cisco OER Key Chain configurations on the master controller. This key chain is used to authenticate the connection between the master controller and border router(s).
Figure 2-1 Key Chain Configurations
Border Router Interface Configurations
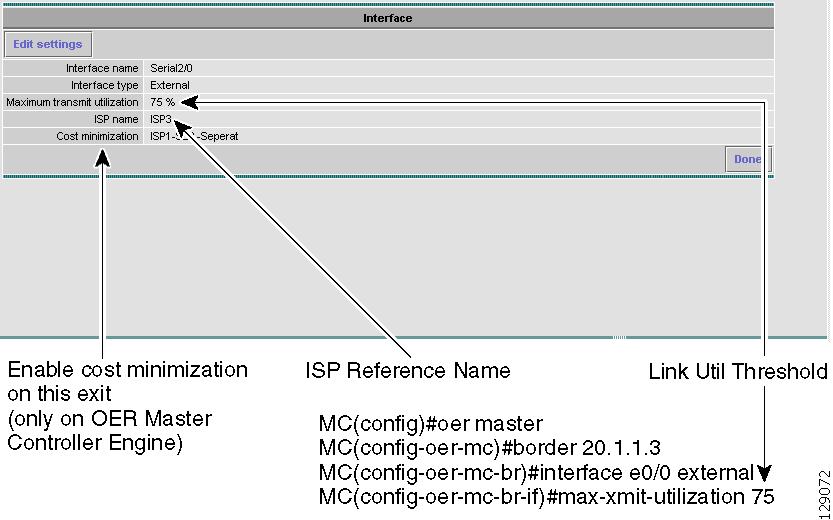
Figure 2-2 shows an interface configuration with maximum utilization of 75%. On the Cisco OER Master Controller Engine, a reference ISP name can also be specified to enable easy identification of the service provider's name in various OER reports. This option is not available on Cisco IOS OER.
Figure 2-2 Border Router Interface Configurations
Prefix List Configurations
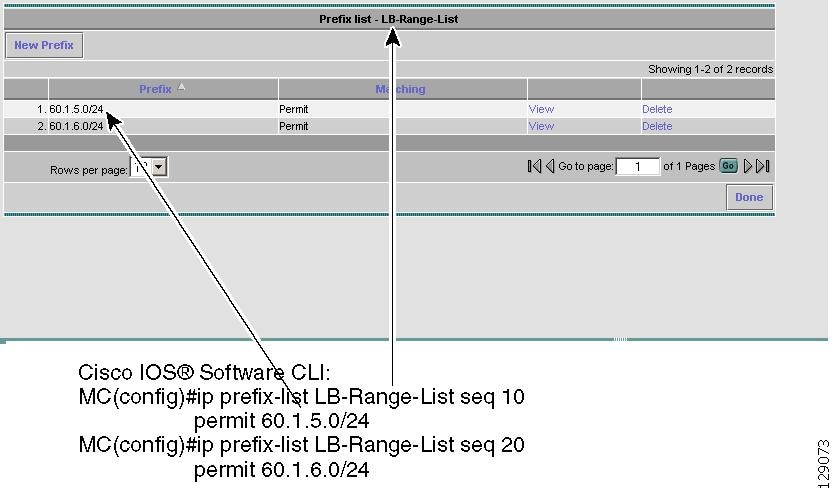
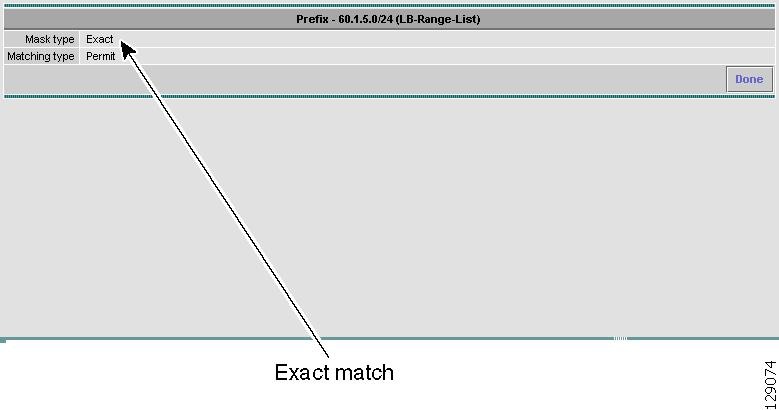
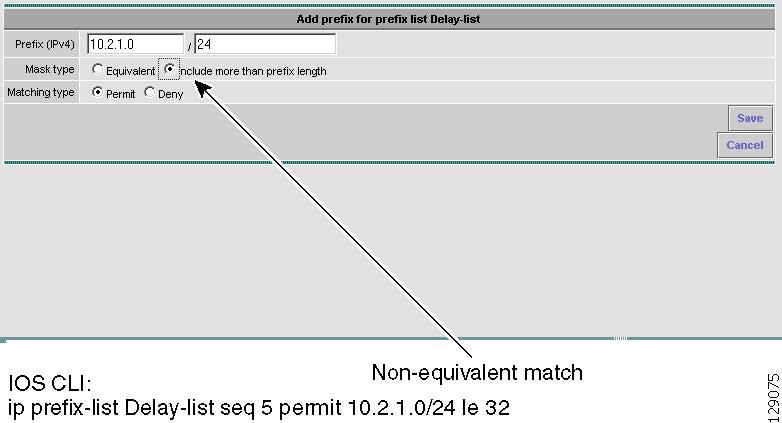
These sample Prefix List configurations show a Prefix List configuration (Figure 2-3) with an Exact Match (Figure 2-5) and one with Non-exact Match (Figure 2-5).
Figure 2-3 Prefix List Configuration
Figure 2-4 Prefix Exact Match Configuration
Figure 2-5 Prefix List Non-exact Match Configuration
Policy Configurations
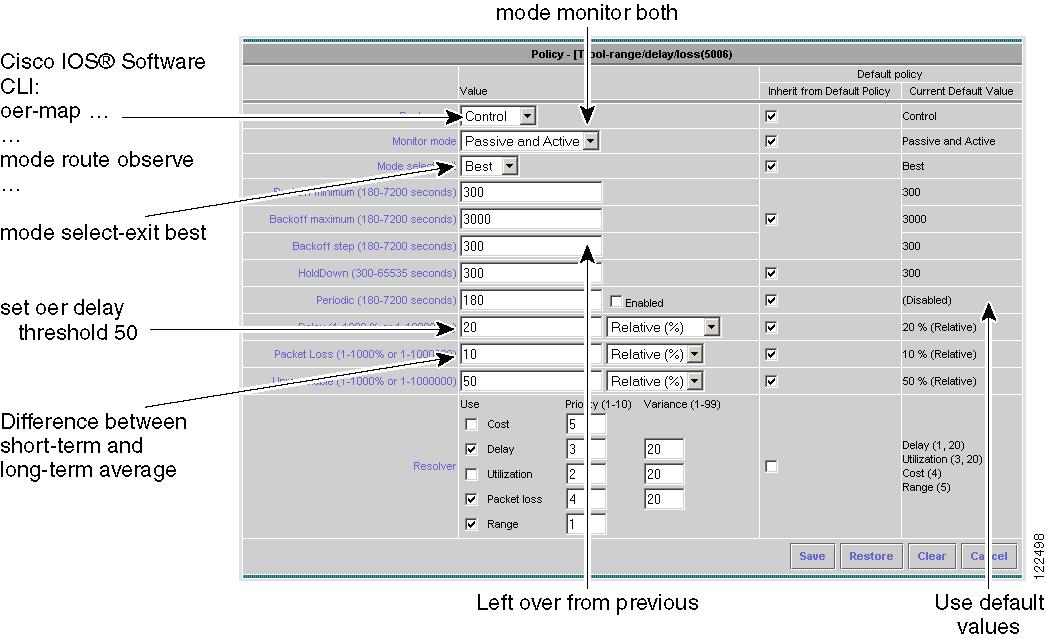
Figure 2-6 shows Policy configurations and various parameters as entered in CLI and selected on the Cisco OER Master Controller Engine GUI.
Figure 2-6 Policy Configurations
Active Latency Report
Figure 2-7 shows a detailed Active Probing Latency report showing SAA delay measured for a prefix exits across two ISP connections for the duration of two hours.
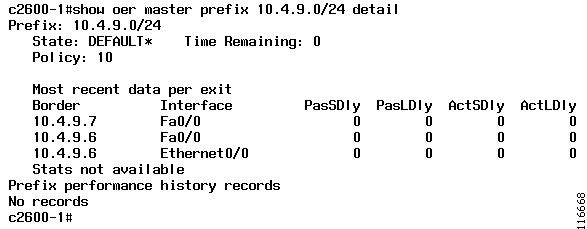
Similar latency information can also be obtained from Cisco IOS OER with a CLI command shown in Figure 2-8. However, the output of the show command must be decoded and you can only see the data at an instant rather than the cumulative result as stored in the database on the Cisco OER Master Controller Engine.
Figure 2-7 Active Probing Latency Report
Figure 2-8 Cisco IOS Show Command Report for OER Prefix
Observation Mode
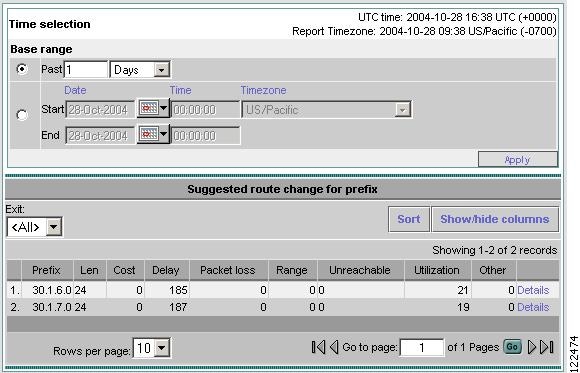
Cisco OER can be enabled in Observation Mode such that all the measurements and policy decisions are made, but no actual route change enforcement occurs. You are able to observe Cisco OER behavior and what action Cisco OER would have taken if an out-of-policy condition occurred. Figure 2-9 shows the report for Cisco OER Observation Mode in GUI and CLI formats.
Figure 2-9 Suggested Route Change Report
Cost Minimization
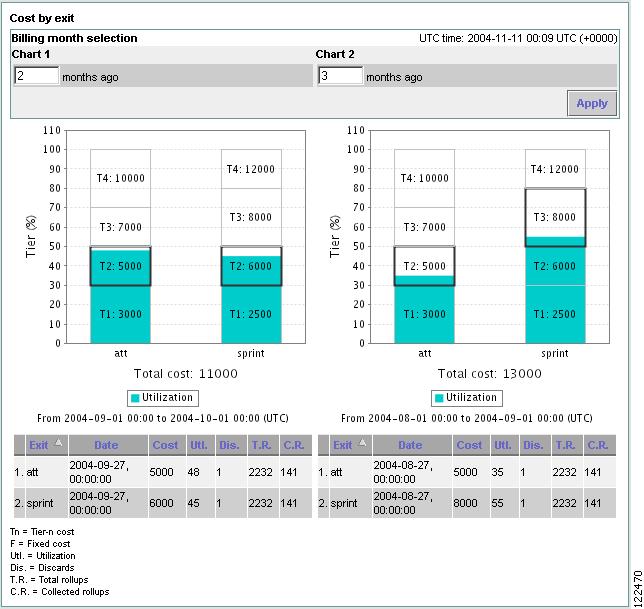
Figure 2-10 shows an example of bandwidth cost savings using the Cost Minimization function of the Cisco OER Master Controller Engine.
As can be seen, traffic can be moved to the lowest cost link or tier based on user-defined configurations.
Figure 2-10 Cost Minimization Report
As shown here, cost saving is because the traffic in T3-sprint is moved to T2-att.
Explanation Of Cost Minimization
Cisco OER supports two billing models: fixed and tier-based with bursting.
•
Fixed rate - customers pay one flat rate regardless of how much they use the link.
•
The specific details of Tier-based with bursting billing models vary by ISP. However, most ISPs use some variation of the following algorithm to calculate what an Enterprise should pay in a tiered billing plan:
1.
2.
3.
4.
5.
6.
If Cisco OER is to perform the bandwidth Cost Minimization function, a billing policy must be configured and applied to prefixes.
Cost Minimization Algorithm
At the end of each billing cycle the top n% of samples, or rollup values, are discarded. The remaining highest value is the sustained utilization. Based on the number of samples discarded, the billing cycle is divided into three periods:
•
•
•
Initial Period
The period when the samples measured is less than the number of discards +1. For example, if discard is 5%, billing month is 30 days long, and sample period is 24 hr, then there are 30 samples at the end of the month.
The number of discard samples is two (5% of 30). In this case, days one, two, and three are in the Initial Period.
During this period, target the lowest tier for each ISP at the start of their respective billing periods and walk up the tiers until the current total traffic amount is allocated across the links.
Middle Period
The period after the Initial Period until the number of samples yet to be measured or collected is less than the number of discards.
Using the same example as above, the Middle Period would be from day four through day 28. During this period, set the target tier to the sustained utilization tier, which is the tier where (discard +1) the highest sample so far measured falls in.
Last Period
The period after the Middle Period until the end of billing period is the Last Period.
During this period, if links were used at the maximum link capacity for the remainder of the billing period and sustained utilization does not change by doing so, then set the target to maximum allowable link utilization. Maximum link utilization is configurable where most likely values would be 75-90%. Otherwise, set the target to sustained utilization tier.
During any sample period, if the cumulative usage is more than targeted cumulative usage, then bump up to the next tier for the remainder of sample period.
If rollup is enabled, then replace sample values to rollup values and number of sample to number of rollups in above algorithm.