- Title Page
- Introduction & Preface
- Logging into the FireSIGHT System
- Using Objects and Security Zones
- Managing Devices
- Setting Up an IPS Device
- Setting Up Virtual Switches
- Setting Up Virtual Routers
- Setting Up Aggregate Interfaces
- Setting Up Hybrid Interfaces
- Using Gateway VPNs
- Using NAT Policies
- Getting Started with Access Control Policies
- Blacklisting Using Security Intelligence IP Address Reputation
- Tuning Traffic Flow Using Access Control Rules
- Controlling Traffic with Network-Based Rules
- Controlling Traffic with Reputation-Based Rules
- Controlling Traffic Based on Users
- Controlling Traffic Using Intrusion and File Policies
- Understanding Traffic Decryption
- Getting Started with SSL Policies
- Getting Started with SSL Rules
- Tuning Traffic Decryption Using SSL Rules
- Understanding Intrusion and Network Analysis Policies
- Using Layers in Intrusion and Network Analysis Policies
- Customizing Traffic Preprocessing
- Getting Started with Network Analysis Policies
- Using Application Layer Preprocessors
- Configuring SCADA Preprocessing
- Configuring Transport & Network Layer Preprocessing
- Tuning Preprocessing in Passive Deployments
- Getting Started with Intrusion Policies
- Tuning Intrusion Rules
- Tailoring Intrusion Protection to Your Network Assets
- Detecting Specific Threats
- Limiting Intrusion Event Logging
- Understanding and Writing Intrusion Rules
- Blocking Malware and Prohibited Files
- Logging Connections in Network Traffic
- Working with Connection & Security Intelligence Data
- Analyzing Malware and File Activity
- Working with Intrusion Events
- Handling Incidents
- Configuring External Alerting
- Configuring External Alerting for Intrusion Rules
- Introduction to Network Discovery
- Enhancing Network Discovery
- Configuring Active Scanning
- Using the Network Map
- Using Host Profiles
- Working with Discovery Events
- Configuring Correlation Policies and Rules
- Using the FireSIGHT System as a Compliance Tool
- Creating Traffic Profiles
- Configuring Remediations
- Using Dashboards
- Using the Context Explorer
- Working with Reports
- Understanding and Using Workflows
- Using Custom Tables
- Searching for Events
- Managing Users
- Scheduling Tasks
- Managing System Policies
- Configuring Appliance Settings
- Licensing the FireSIGHT System
- Updating System Software
- Monitoring the System
- Using Health Monitoring
- Auditing the System
- Using Backup and Restore
- Specifying User Preferences
- Importing and Exporting Configurations
- Purging Discovery Data from the Database
- Viewing the Status of Long-Running Tasks
- Command Line Reference
- Security, Internet Access, and Communication Ports
- Third-Party Products
- glossary
FireSIGHT System User Guide Version 5.4.1
Bias-Free Language
The documentation set for this product strives to use bias-free language. For the purposes of this documentation set, bias-free is defined as language that does not imply discrimination based on age, disability, gender, racial identity, ethnic identity, sexual orientation, socioeconomic status, and intersectionality. Exceptions may be present in the documentation due to language that is hardcoded in the user interfaces of the product software, language used based on RFP documentation, or language that is used by a referenced third-party product. Learn more about how Cisco is using Inclusive Language.
- Updated:
- February 18, 2015
Chapter: Using Dashboards
- Understanding Dashboard Widgets
- Understanding the Predefined Widgets
- Understanding the Appliance Information Widget
- Understanding the Appliance Status Widget
- Understanding the Correlation Events Widget
- Understanding the Current Interface Status Widget
- Understanding the Current Sessions Widget
- Understanding the Custom Analysis Widget
- Understanding the Disk Usage Widget
- Understanding the Interface Traffic Widget
- Understanding the Intrusion Events Widget
- Understanding the Network Compliance Widget
- Understanding the Product Licensing Widget
- Understanding the Product Updates Widget
- Understanding the RSS Feed Widget
- Understanding the System Load Widget
- Understanding the System Time Widget
- Understanding the White List Events Widget
- Working with Dashboards
Using Dashboards
The FireSIGHT System dashboard provides you with at-a-glance views of current system status, including data about the events collected and generated by the system. You can also use the dashboard to see information about the status and overall health of the appliances in your deployment. Only certain user roles (Administrator, Maintenance User, Security Analyst, Security Analyst [Read Only], and custom roles with the Dashboards permission) have access to the dashboard. Other roles see as their default start pages a page relevant to the role; for example, a Discovery Admin sees the Network Discovery page.
A dashboard has one or more tabs, each of which can display one or more widgets in a three-column layout. Widgets are small, self-contained components that provide insight into different aspects of the FireSIGHT System. The FireSIGHT System is delivered with several predefined widgets. For example, the Appliance Information widget tells you the appliance name, model, remote manager, and currently running version of the FireSIGHT System software.
The dashboard has a time range that constrains its widgets. You can change the time range to reflect a period as short as the last hour or as long as the last year.
The dashboard is a complex, highly customizable monitoring feature. Another way to view many types of system data is the Context Explorer, which presents information using intrusion, connection, and discovery data in a set of preset visual contexts that you change, only temporarily, with filters to add granularity. In contrast to the exhaustive data available in the FireSIGHT System dashboard, the Context Explorer offers a broad, brief, and colorful picture of how your monitored network looks and acts. For more information on the Context Explorer, see Using the Context Explorer.
Each type of appliance is delivered with a default dashboard, named Summary Dashboard. This dashboard provides the casual user with general FireSIGHT, intrusion, threat detection, geolocation, and system status information for your FireSIGHT System deployment. Note that because some widgets are useful only for specific types of appliances, the Summary Dashboard differs depending on whether you are using a Defense Center, virtual Defense Center, or managed device.

Note Virtual managed devices do not have a web interface and do not support dashboards.
By default, the home page for your appliance displays the Summary Dashboard, although you can configure your appliance to display a different default home page.

Tip If you change the home page, you can access dashboards by selecting Overview > Dashboards. For more information, see Viewing Dashboards.
Note that the data displayed depends on such factors as how you license and deploy your managed devices, whether you configure features that provide the data and, in the case of Series 2 appliances and Cisco NGIPS for Blue Coat X-Series, whether the appliance supports a feature that provides the data. For example, because neither the DC500 Defense Center nor Series 2 devices support URL filtering by category and reputation, the DC500 Defense Center does not display data for this feature and Series 2 devices do not detect this data.
In addition to the Summary Dashboard, the Defense Center is delivered with the following predefined dashboards:
- The Application Statistics dashboard provides detailed information about application activity and intrusion events on your monitored network. You can use this dashboard to track which applications produce the most traffic, allowed and denied connections, and intrusion events, as well as the number of unique applications in use and the estimated risk and business relevance of those applications.
- The Connection Summary dashboard uses connection data to create tables and charts of the activity on your monitored network. You can use this dashboard to track the ports, applications, and initiator and responder IPs associated with connections and traffic on your network, the overall volume of connections and traffic, and geolocation information. You must log connections for this dashboard to generate data; see Understanding Connection and Security Intelligence Data. Note that the output of this widget depends on your connection logging configuration.
Tip Widgets on this dashboard list total traffic in kilobytes (KB). The total traffic in KB is equal to the traffic in KB/s multiplied by the total seconds covered by the selected time window.
- The Detailed Dashboard provides advanced users with detailed information about their FireSIGHT System deployment and includes multiple widgets that summarize collected intrusion event, network discovery, compliance, correlation, traffic, and system status data, as well as providing information about Cisco news and product updates. You can use this dashboard to monitor a very broad variety of network information at once.
- The Files Dashboard provides detailed information about the files (including malware files) detected on your network by managed devices, captured files stored on devices and submitted for dynamic analysis, and malware detected using a subscription-based FireAMP strategy. Note that you must have a Malware license and enable malware detection for this dashboard to include network-based malware data. Also, neither the DC500 nor Series 2 devices or Cisco NGIPS for Blue Coat X-Series support advanced malware protection, so the DC500 cannot display this data and Series 2 devices and Cisco NGIPS for Blue Coat X-Series do not detect it. For more information, see Understanding Malware Protection and File Control.
- The URL Statistics dashboard provides detailed information about allowed and denied traffic from your monitored network to external URLs, sorted by URL category and reputation. Note that you must have a URL Filtering license and enable URL Filtering for this dashboard to include URL category and reputation data. Note also that neither the DC500 nor Series 2 devices support URL filtering by reputation and category, so the DC500 cannot display this data and Series 2 devices do not detect it. See Performing Reputation-Based URL Blocking.
- The Access Controlled User Statistics dashboard provides detailed information about user activity and intrusion events on your monitored network. You can use this dashboard to track allowed and denied connections, traffic, and intrusion events associated with users on your network, as well as the number of unique users on the network. Because this dashboard depends on user awareness data, for this dashboard to display meaningful statistics you must configure at least one User Agent and a Defense Center-Active Directory LDAP server connection; see Using User Agents to Report Active Directory Logins.
You can use the predefined dashboards, modify the predefined dashboards, or create a custom dashboard to suit your needs. You can share custom dashboards among all users of an appliance, or you can create a custom dashboard solely for your own use. You can also set a custom dashboard as your default dashboard.
Some drill-down pages and table views of events include a Dashboard toolbar link that you can click to view a relevant predefined dashboard. The following table lists which event views correspond to which predefined dashboards. Note that if you delete a predefined dashboard or tab, the associated Dashboard links do not function.
For more information on dashboards and their contents, see the following sections:
Understanding Dashboard Widgets
A dashboard has one or more tabs, each of which can display one or more widgets in a three-column layout. The FireSIGHT System is delivered with many predefined dashboard widgets, each of which provides insight into a different aspect of the FireSIGHT System. Widgets are grouped into three categories:
- Analysis & Reporting widgets display data about the events collected and generated by the FireSIGHT System.
- Miscellaneous widgets display neither event data nor operations data. Currently, the only widget in this category displays an RSS feed.
- Operations widgets display information about the status and overall health of the FireSIGHT System.
The dashboard widgets that you can view depend on the type of appliance you are using and on your user role. In addition, each dashboard has a set of preferences that determines its behavior. You can minimize and maximize widgets, add and remove widgets from tabs, as well as rearrange the widgets on a tab.
Note For widgets that display event counts over a time range, the total number of events may not reflect the number of events for which detailed data is available in the event viewer. This occurs because the system sometimes prunes older event details to manage disk space usage. To minimize the occurrence of event detail pruning, you can fine-tune event logging to log only those events most important to your deployment. For more information, see Logging Connections in Network Traffic.
- Understanding Widget Availability
- Understanding Widget Preferences
- Understanding the Predefined Widgets
- Working with Dashboards
Understanding Widget Availability
The FireSIGHT System is delivered with several predefined dashboard widgets. The dashboard widgets that you can view depend on the type of appliance you are using and on your user role:
- An invalid widget is one that you cannot view because you are using the wrong type of appliance.
- An unauthorized widget is one that you cannot view because you do not have the necessary account privileges.
For example, the Current Sessions widget is available on all appliances, but only to users with Administrator account privileges, while the Appliance Status widget is available only on the Defense Center for users with Administrator, Maintenance User, Security Analyst, or Security Analyst (Read Only) account privileges.
Although you cannot add an unauthorized or invalid widget to a dashboard, if you import a dashboard created either on a different kind of appliance or by a user with different access privileges, that dashboard may contain unauthorized or invalid widgets. These widgets are disabled and display error messages that indicate the reason why you cannot view them.
Also note that widgets cannot display data to which an appliance has no access. For example, managed devices cannot access correlation events, intrusion events, discovery events, and so on. If you import a dashboard onto a managed device that contains a Custom Analysis widget configured to display one of those data types, the widget displays an error message. Individual widgets also display error messages when those widgets have timed out or are otherwise experiencing problems.
The content of a widget can differ depending on the type of appliance you are using. For example, the Custom Analysis widget on a Defense Center can display discovery information, but this feature is not available when you configure the Custom Analysis widget on a managed device. Note than you can sort any content generated in table format by clicking on the table column header.
You can delete or minimize unauthorized and invalid widgets, as well as widgets that display no data, keeping in mind that modifying a widget on a shared dashboard modifies it for all users of the appliance. For more information, see Minimizing and Maximizing Widgets and Deleting Widgets.
The following table lists the valid widgets each appliance can display.
The following table lists the user account privileges required to view each widget. Only user accounts with Administrator, Maintenance User, Security Analyst, or Security Analyst (Read Only) access can use dashboards.
Users with custom roles may have access to any combination of widgets, or none at all, as their user roles permit.
Understanding Widget Preferences
Each widget has a set of preferences that determines its behavior.
Widget preferences can be simple. For example, the following graphic shows the preferences for the Current Interface Status widget, which displays the current status of all enabled interfaces on the internal network. You can only configure the update frequency for this widget.
Widget preferences can also be more complex. For example, the following graphic shows the preferences for the Custom Analysis widget, which is a highly customizable widget that allows you to display detailed information on the events collected and generated by the FireSIGHT System.
To modify a widget’s preferences:
Access: Admin/Any Security Analyst/Maint
Step 1 On the title bar of the widget whose preferences you want to change, click the show preferences icon ( ).
).
The preferences section for that widget appears.
Step 2 Make changes as needed.
Your changes take effect immediately. For information on the preferences you can specify for individual widgets, see Understanding the Predefined Widgets.
Step 3 On the widget title bar, click the hide preferences icon ( ) to hide the preferences section.
Understanding the Predefined Widgets
The FireSIGHT System is delivered with several predefined widgets that, when used on dashboards, can provide you with at-a-glance views of current system status, including data about the events collected and generated by the system, as well as information about the status and overall health of the appliances in your deployment.
For detailed information on the widgets delivered with the FireSIGHT System, see the following sections:
- Understanding the Appliance Information Widget
- Understanding the Appliance Status Widget
- Understanding the Correlation Events Widget
- Understanding the Current Interface Status Widget
- Understanding the Current Sessions Widget
- Understanding the Custom Analysis Widget
- Understanding the Disk Usage Widget
- Understanding the Interface Traffic Widget
- Understanding the Intrusion Events Widget
- Understanding the Network Compliance Widget
- Understanding the Product Licensing Widget
- Understanding the Product Updates Widget
- Understanding the RSS Feed Widget
- Understanding the System Load Widget
- Understanding the System Time Widget
- Understanding the White List Events Widget
Note The dashboard widgets you can view depend on the type of appliance you are using and on your user role. For more information, see Understanding Widget Availability.
Understanding the Appliance Information Widget
The Appliance Information widget provides a snapshot of the appliance. It appears by default on the Status tabs of the Detailed Dashboard and the Summary Dashboard.
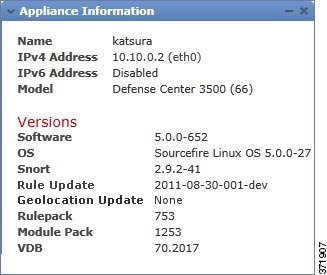
- the name, IPv4 address, IPv6 address, and model of the appliance
- the versions of the FireSIGHT System software, operating system, Snort, rule update, rule pack, module pack, vulnerability database (VDB), and geolocation update installed on the appliances with dashboards, except for virtual Defense Centers
- for managed appliances, the name and status of the communications link with the managing appliance
- for Defense Centers in a high availability pair, the name, model, and FireSIGHT System software and operating system versions of the peer Defense Center, as well as how recently the Defense Centers made contact
You can configure the widget to display more or less information by modifying the widget preferences to display a simple or an advanced view; the preferences also control how often the widget updates. For more information, see Understanding Widget Preferences.
Understanding the Appliance Status Widget
The Appliance Status widget indicates the health of the appliance and of any appliances it is managing. Note that because the Defense Center does not automatically apply a health policy to managed devices, you must manually apply a health policy to devices or their status appears as
Disabled
. This widget appears by default on the Status tabs of the Detailed Dashboard and the Summary Dashboard.
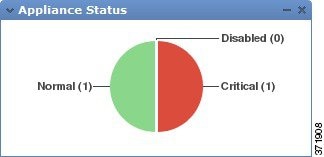
You can configure the widget to display appliance status as a pie chart or in a table by modifying the widget preferences.
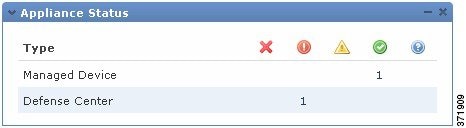
The preferences also control how often the widget updates. For more information, see Understanding Widget Preferences.
You can click a section on the pie chart or one of the numbers on the appliance status table to go to the Health Monitor page and view the compiled health status of the appliance and of any appliances it is managing. For more information, see Using the Health Monitor.
Understanding the Correlation Events Widget
The Correlation Events widget shows the average number of correlation events per second, by priority, over the dashboard time range. It appears by default on the Correlation tab of the Detailed Dashboard.
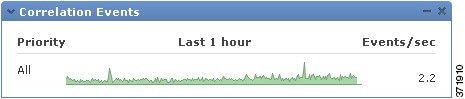
You can configure the widget to display correlation events of different priorities by modifying the widget preferences, as well as to select a linear (incremental) or logarithmic (factor of ten) scale.
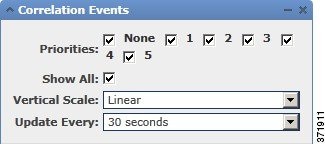
Select one or more Priorities check boxes to display separate graphs for events of specific priorities, including events that do not have a priority. Select Show All to display an additional graph for all correlation events, regardless of priority. The preferences also control how often the widget updates. For more information, see Understanding Widget Preferences.
You can click a graph to view correlation events of a specific priority, or click the All graph to view all correlation events. In either case, the events are constrained by the dashboard time range; accessing correlation events via the dashboard changes the events (or global) time window for the appliance. For more information on correlation events, see Viewing Correlation Events.
Understanding the Current Interface Status Widget
The Current Interface Status widget shows the status of all interfaces on the appliance, enabled or unused. On a Defense Center, you can display the management (
eth0
,
eth1
, and so on) interfaces. On a managed device, you can choose to show only sensing (
s1p1
and so on) interfaces or both management and sensing interfaces. Interfaces are grouped by type: management, inline, passive, switched, routed, stacked, and unused.
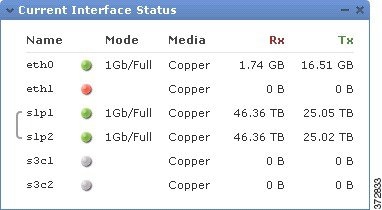
For each interface, the widget provides:
- the name of the interface
- the link state of the interface
- the link mode (for example, 100Mb full duplex, or 10Mb half duplex) of the interface
- the type of interface, that is, copper or fiber
- the amount of data received (Rx) and transmitted (Tx) by the interface
The color of the ball representing link state indicates the current status, as follows:
- green: link is up and at full speed
- yellow: link is up but not at full speed
- red: link is not up
- gray: link is administratively disabled
- blue: link state information is not available (for example, ASA)
The widget preferences control how often the widget updates. For more information, see Understanding Widget Preferences.
Understanding the Current Sessions Widget
The Current Sessions widget shows which users are currently logged into the appliance, the IP address associated with the machine where the session originated, and the last time each user accessed a page on the appliance (based on the local time for the appliance). The user that represents you, that is, the user currently viewing the widget, is marked with a user icon ( ) and rendered in bold type. Sessions are pruned from this widget’s data within one hour of logoff or inactivity. This widget appears by default on the Status tabs of the Detailed Dashboard and the Summary Dashboard.
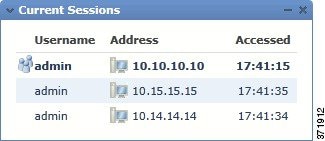
On the Current Sessions widget, you can:
- click any user name to manage user accounts on the User Management page; see Managing User Accounts
- click the host icon (
 ) or compromised host icon (
 ) next to any IP address to view the host profile for the associated machine; see Using Host Profiles (Defense Center with network discovery only)
- click any IP address or access time to view the audit log constrained by that IP address and by the time that the user associated with that IP address logged on to the web interface; see Viewing Audit Records
The widget preferences control how often the widget updates. For more information, see Understanding Widget Preferences.
Understanding the Custom Analysis Widget
The Custom Analysis widget is a highly customizable widget that allows you to display detailed information on the events collected and generated by the FireSIGHT System.
The Custom Analysis widget is delivered with numerous widget presets, which are groups of configurations that are predefined by Cisco. The presets serve as examples and can provide quick access to information about your deployment. You can use these presets or create a custom configuration.
When you configure the widget preferences, you must select which table and individual field you want to display, as well as the aggregation method that configures how the widget groups the data it displays.
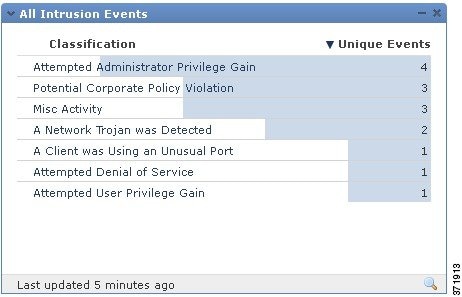
For example, you can configure the Custom Analysis widget to display a list of recent intrusion events by configuring the widget to display data from the Intrusion Events table. Selecting the Classification field and aggregating this data by Count tells you how many events of each type were generated. Note that the count includes reviewed events for intrusion events; if you view the count in an event viewer it will not include reviewed events.
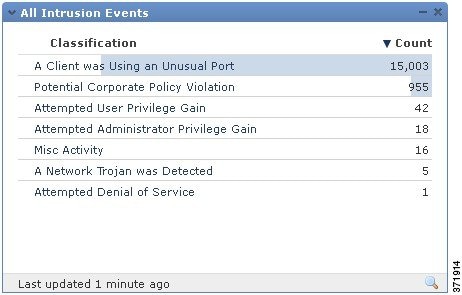
On the other hand, aggregating by Unique Events tells you how many unique intrusion events of each type have occurred (for example, how many detections of network trojans, potential violations of corporate policy, attempted denial-of-service attacks, and so on).
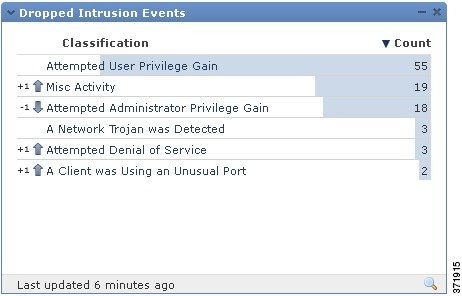
Optionally, you can further constrain the widget using a saved search, either one of the predefined searches delivered with your appliance or a custom search that you created. For example, constraining the first example (intrusion events using the Classification field, aggregated by Count ) using the Dropped Events search tells you how many intrusion events of each type were dropped.
The colored bars in the widget background show the relative number of occurrences of each event; you should read the bars from right to left. You can change the color of the bars as well as the number of rows that the widget displays. You can also configure the widget to display the most frequently occurring events or the least frequently occurring events.
The direction icon ( ) indicates and controls the sort order of the display. A downward-pointing icon indicates descending order; an upward-pointing icon indicates ascending order. To change the sort order, click the icon.
Next to each event, the widget can display one of three icons to indicate any changes from the most recent results:
 ) signifies that the event is new to the results.
- The up arrow icon (
 ) indicates that the event has moved up in the standings since the last time the widget updated. A number indicating how many places the event has moved up appears next to the icon.
- The down arrow icon (
 ) indicates that the event has moved down in the standings since the last time the widget updated. A number indicating how many places the event has moved down appears next to the icon.
The widget displays the last time it updated, based on the local time of the appliance. The widget updates with a frequency that depends on the dashboard time range. For example, if you set the dashboard time range to an hour, the widget updates every five minutes. On the other hand, if you set the dashboard time range to a year, the widget updates once a week. To determine when the dashboard will update next, hover your pointer over the Last updated notice in the bottom left corner of the widget.
Note If you constrain a Custom Analysis widget using a saved search, then edit the search, the widget does not reflect your changes until the next time it updates.
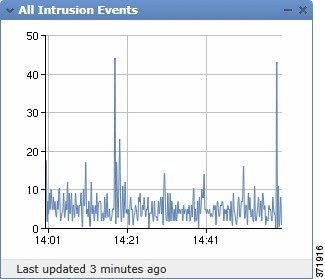
If you want information on events or other collected data over time, you can configure the Custom Analysis widget to display a line graph, such as one that displays the total number of intrusion events generated in your deployment over time. For graphs over time, you can choose the time zone that the widget uses as well as the color of the line.
Finally, you can choose a custom title for the widget.
From Custom Analysis widgets, you can invoke event views (that is, workflows) that provide detailed information about the events displayed in the widget. To do so, click the event for which you want more information.
You can also right-click any IP address in the custom analysis widget to display a context menu that allows you to obtain more information on the associated host, as well as add it to the global blacklist or whitelist for Security Intelligence filtering.
Note Depending on how you configure them, Custom Analysis widgets may place a drain on an appliance’s resources; a red-shaded Custom Analysis widget indicates that its use is harming system performance. If the widget continues to stay red over time, you should remove the widget.
Configuring the Custom Analysis Widget
Like all widgets, the Custom Analysis widget has preferences that determine its behavior. To configure a Custom Analysis widget, show the preferences as described in Understanding Widget Preferences.
A different set of preferences appears depending on whether you configure the widget to show relative occurrences of events (that is, a bar graph), or configure the widget to show a graph over time (that is, a line graph).
To configure the widget to show a bar graph, select any value except Time from the Field drop-down list.
To configure the widget to show a line graph, select Time from the Field drop-down list.
The following table describes the various preferences you can set in the Custom Analysis widget.
|
If you do not specify a title, the appliance uses the configured event type as the widget title. |
|
|
The Custom Analysis widget is delivered with numerous presets, which are widget configurations predefined by Cisco. The presets serve as examples and can provide quick access to information about your deployment. You can use these presets or you can create a custom configuration. For a detailed list of presets, see the Custom Analysis Widget Presets table. |
|
the table of events which contains the event data the widget displays. |
|
the aggregation method for the widget. The aggregation method configures how the widget groups the data it displays. For most event types, the default aggregation criterion is Count . |
|
a user-defined application filter that you want to use to further constrain the data that the widget displays. You can only use application filters if you are displaying data from the Application Statistics or Intrusion Event Statistics by Application tables. For more information on application filters, see Working with Application Filters. |
|
the saved search you want to use to further constrain the data that the widget displays. You do not have to specify a search, although some presets use predefined searches. If you create a saved connection event search that uses data in fields without an asterisk (*), the widget displays incorrect data. Only fields that constrain connection summaries can constrain custom analysis dashboard widgets based on connection events. Invalid searches are grayed out and cannot be selected. |
|
whether you want to display the most frequently occurring events ( Top ) or the least frequently occurring events ( Bottom ). |
|
the number of result rows you want to display. You can display from 10 to 25 result rows, in increments of five. |
|
whether you want to display the icons that indicate changes from the most recent results. |
|
which time zone you want to use to display results. The time zone appears whenever you select a time-based field. |
|
the color of the bars in the widget background that show the relative number of occurrences of each result. |
The following table describes the available presets for the Custom Analysis widget. It also indicates which, if any, Defense Center predefined dashboard uses each preset. Note the following:
- Predefined dashboards on managed devices do not include Custom Analysis widgets.
- The DC500 Defense Center does not display and Series 2 devices and Cisco NGIPS for Blue Coat X-Series do not detect data for features they do not support.
For more information on specific license types, see Service Subscriptions.
Viewing Associated Events from the Custom Analysis Widget
Depending on the kind of data that a Custom Analysis widget is configured to display, you can invoke an event view (that is, a workflow) that provides detailed information about the events displayed in the widget.
When you invoke an event view from the dashboard, the events appear in the default workflow for that event type, constrained by the dashboard time range. This also changes the appropriate time window for the appliance, depending on how many time windows you have configured and on what type of event you are trying to view.
For example, if you configure multiple time windows on your Defense Center and then access health events from a Custom Analysis widget, the events appear in the default health events workflow, and the health monitoring time window changes to the dashboard time range.
As another example, if you configure a single time window and then access any type of event from the Custom Analysis widget, the events appear in the default workflow for that event type, and the global time window changes to the dashboard time range.
For more information on time windows, see Default Time Windows and Specifying Time Constraints in Searches.
To view associated events from the Custom Analysis Widget:
Access: Admin/Any Security Analyst/Maint
Step 1 You have two options, depending on how you configured the widget:
- On widgets configured to show relative occurrences of events (that is, bar graphs), click any event to view associated events constrained by the widget preferences, as well as by that event. You can also click the view all icon (
 ) in the lower right corner of the widget to view all associated events, constrained by the widget preferences.
For information on working with specific event types, see the following sections:
- Working with Security Intelligence Lists and Feeds
- Viewing Audit Records
- Viewing Intrusion Events
- Viewing Discovery and Host Input Events
- Viewing File Events
- Viewing Malware Events
- Viewing Captured Files
- Viewing Hosts
- Viewing Host Attributes
- Viewing Indications of Compromise
- Viewing Servers
- Viewing Application Details
- Viewing Vulnerabilities
- Viewing Third-Party Vulnerabilities
- Viewing Connection and Security Intelligence Data
- Viewing Users
- Viewing User Activity Events
- Viewing Correlation Events
- Viewing White List Events
- Viewing White List Violations
- Viewing Health Events
- Viewing the Rule Update Log
- Working with Active Scan Results
- Using Geolocation
- Understanding Custom Tables
Custom Analysis Widget Limitations
There are some important points to keep in mind when using the Custom Analysis widget.
If you are configuring the widget on a shared dashboard, remember that not all users can view data of all event types, depending on the user’s account privileges. For example, Maintenance Users cannot view discovery events.
Similarly, if you are using a dashboard imported from another appliance, remember that not all appliances have access to data of all event types. For example, managed devices do not store correlation data. If your dashboard includes a Custom Analysis widget that displays data you cannot see, the widget indicates that you are unauthorized to view the data. Note, however, that you (and any other users who share the dashboard) can modify the preferences of the widget to display data that you can see, or even delete the widget. If you want to make sure that this does not happen, save the dashboard as private.
Remember that only you can access searches that you have saved as private. If you configure the widget on a shared dashboard and constrain its events using a private search, the widget resets to not using the search when another user logs in. This affects your view of the widget as well. If you want to make sure that this does not happen, save the dashboard as private.
You enable or disable the Custom Analysis widget from the Dashboard settings in your system policy. For more information, see Configuring Dashboard Settings.
Understanding the Disk Usage Widget
The Disk Usage widget displays the percentage of space used on the hard drive, based on disk usage category. It also indicates the percentage of space used on and capacity of each partition of the appliance’s hard drive. The Disk Usage widget displays the same information for the malware storage pack if installed in the device, or if the Defense Center manages a device containing a malware storage pack. This widget appears by default on the Status tabs of the Default Dashboard and the Summary Dashboard.
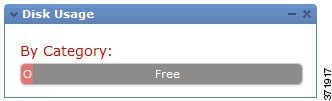
The By Category stacked bar displays each disk usage category as a proportion of the total available disk space used. The following table describes the available categories.
You can hover your pointer over a disk usage category in the By Category stacked bar to view the percentage of available disk space used by that category, the actual storage space on the disk, and the total disk space available for that category. Note that if you have a malware storage pack installed, the total disk space available for the Files category is the available disk space on the malware storage pack. For more information, see Understanding Captured File Storage.
You can configure the widget to display only the By Category stacked bar, or you can show the stacked bar plus the admin (
/
),
/Volume
, and
/boot
partition usage, as well as the
/var/storage
partition if the malware storage pack is installed, by modifying the widget preferences.
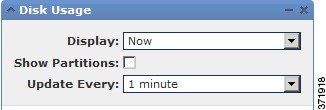
The widget preferences also control how often the widget updates, as well as whether it displays the current disk usage or collected disk usage statistics over the dashboard time range. For more information, see Understanding Widget Preferences.
Understanding the Interface Traffic Widget
The Interface Traffic widget shows the rate of traffic received (Rx) and transmitted (Tx) on the appliance’s management (
eth0
and so on) and sensing (
s1p1
and so on) interfaces over the dashboard time range. It does not appear by default on any of the predefined dashboards.
Outbound (transmitted) traffic includes flow control packets. Because of this, passive interfaces on your appliances may show transmitted traffic and generate events; this is expected behavior. Note also that devices with Malware licenses enabled periodically attempt to connect to the Cisco cloud even if you have not configured dynamic analysis. Because of this, these devices show transmitted traffic; this is also expected behavior.
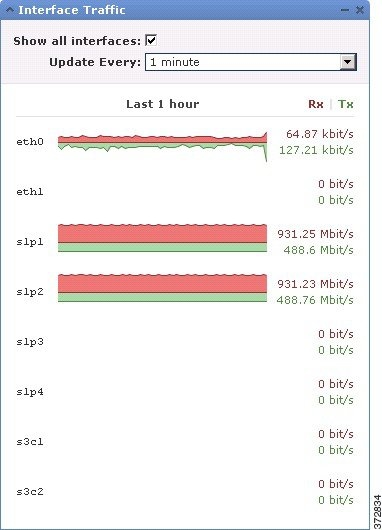
The widget preferences control how often the widget updates. On managed devices, the preferences also control whether the widget displays the traffic rate for unused interfaces (by default, the widget only displays the traffic rate for active interfaces). For more information, see Understanding Widget Preferences.
Understanding the Intrusion Events Widget
The Intrusion Events widget shows the intrusion events that occurred over the dashboard time range, organized by priority. This includes statistics on intrusion events with dropped packets and different impacts. This widget appears by default on the Intrusion Events tab of the Summary Dashboard.
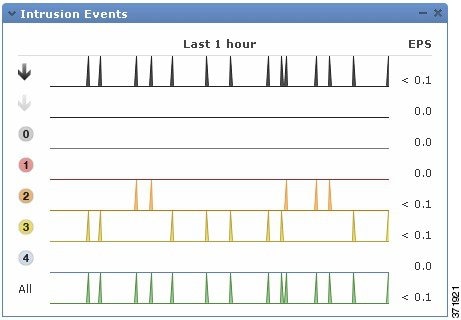
On managed devices, the widget can display statistics for dropped (or, on passively deployed devices, would have dropped) intrusion events, all intrusion events, or both. Note that you must enable local event storage or the widget will not have any data to display. Note also that the total rate represented by All does not include the dropped event rate.
On the Defense Center, but not managed devices, you can configure the widget to display intrusion events with dropped/would have dropped packets and different impacts by modifying the widget preferences. You can display dropped and would have dropped events on Defense Centers and devices. The following graphic shows the Defense Center version of the widget preferences.
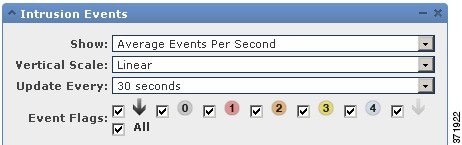
In the widget preferences, you can:
- on a Defense Center,select one or more Event Flags check boxes to display separate graphs for events with dropped packets, would have dropped packets, or specific impacts; select All to display an additional graph for all intrusion events, regardless of impact or rule state; see Using Impact Levels to Evaluate Events for more information
- select Show to choose Average Events Per Second or Total Events
- select Vertical Scale to choose Linear (incremental) or Logarithmic (factor of ten) scale
The preferences also control how often the widget updates. For more information, see Understanding Widget Preferences.
On the Intrusion Events widget, you can:
- on a Defense Center, click a graph corresponding to dropped packets, to would have dropped packets, or to a specific impact to view intrusion events of that type
- click the graph corresponding to dropped events to view dropped events
- click the graph corresponding to would have dropped events to view would have dropped events
- click the All graph to view all intrusion events
Note that the resulting event view is constrained by the dashboard time range; accessing intrusion events via the dashboard changes the events (or global) time window for the appliance. For more information on intrusion events, see Viewing Intrusion Events.
Note also that packets in a passive deployment are not dropped, regardless of the rule state or the inline drop behavior of the intrusion policy.
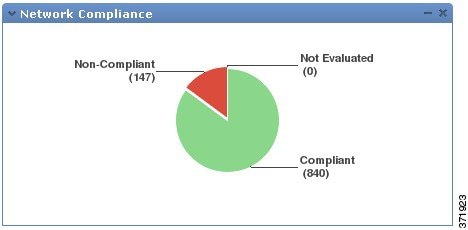
Understanding the Network Compliance Widget
The Network Compliance widget summarizes your hosts’ compliance with the white lists you configured (see Using the FireSIGHT System as a Compliance Tool). By default, the widget displays a pie chart that shows the number of hosts that are compliant, non-compliant, and that have not been evaluated, for all compliance white lists in active correlation policies. This widget appears by default on the Correlation tab of the Detailed Dashboard.
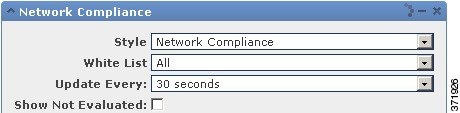
You can configure the widget to display network compliance either for all white lists or for a specific white list by modifying the widget preferences.
If you choose to display network compliance for all white lists, the widget considers a host to be non-compliant if it is not compliant with any white list in an active correlation policy.
You can also use the widget preferences to specify which of three different styles you want to use to display network compliance.
The Network Compliance style (the default) displays a pie chart that shows the number of hosts that are compliant, non-compliant, and that have not been evaluated. You can click the pie chart to view the host violation count, which lists the hosts that violate at least one white list. For more information, see Viewing White List Violations.
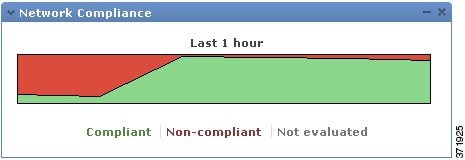
The Network Compliance over Time (%) style displays a stacked area graph showing the relative proportion of hosts that are compliant, non-compliant, and that have not yet been evaluated, over the dashboard time range.
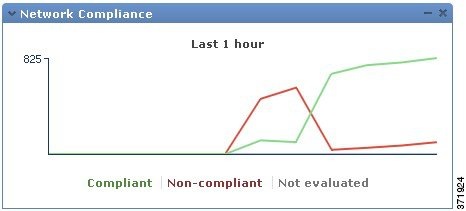
The Network Compliance over Time style displays a line graph that shows the number of hosts that are compliant, non-compliant, and that have not yet been evaluated, over the dashboard time range.
The preferences control how often the widget updates. You can check the Show Not Evaluated box to hide events which have not been evaluated. For more information, see Understanding Widget Preferences.
Understanding the Product Licensing Widget
The Product Licensing widget shows the device and feature licenses currently installed on the Defense Center. It also indicates the number of items (such as hosts or users) licensed and the number of remaining licensed items allowed. It does not appear by default on any of the predefined dashboards.
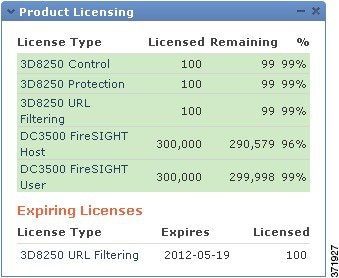
The top section of the widget displays all device and feature licenses installed on the Defense Center, including temporary licenses, while the Expiring Licenses section displays only temporary and expired licenses. For example, if you have two feature licenses for FireSIGHT Hosts, one of which is a permanent license and allows 750 hosts, and another that is temporary and allows an additional 750 hosts, the top section of the widget displays a FireSIGHT Hosts feature license with 1500 licensed hosts, while the Expiring Licenses section displays a FireSIGHT Hosts feature license with 750 hosts.
The bars in the widget background show the percentage of each type of license that is being used; you should read the bars from right to left. Expired licenses are marked with a strikethrough.
You can configure the widget to display either the features that are currently licensed, or all the features that you can license, by modifying the widget preferences. The preferences also control how often the widget updates. For more information, see Understanding Widget Preferences.
You can click any of the license types to go to the License page of the local configuration and add or delete feature licenses. For more information, see Licensing the FireSIGHT System.
Understanding the Product Updates Widget
The Product Updates widget provides you with a summary of the software (FireSIGHT System software and rule updates) currently installed on the appliance as well as information on available updates that you have downloaded, but not yet installed, for that software. This widget appears by default on the Status tabs of the Detailed Dashboard and the Summary Dashboard.
Note that the widget displays
Unknown
as the latest version of the software unless you have configured a scheduled task to download, push, or install software updates; the widget uses scheduled tasks to determine the latest version. For more information, see Scheduling Tasks.
The widget also provides you with links to pages where you can update the software; the Defense Center version of the widget provides you with similar links so you can update the software on your managed devices.
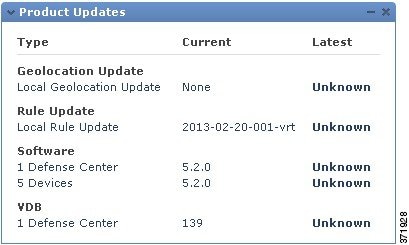
You can configure the widget to hide the latest versions by modifying the widget preferences. The preferences also control how often the widget updates. For more information, see Understanding Widget Preferences.
On the Product Updates widget, you can:
- manually update an appliance by clicking the current version of the FireSIGHT System software, rule update, geolocation update, or VDB:
- to update the system software, geolocation database, or VDB, see Updating System Software.
- to import the newest rule update, see Importing Rule Updates and Local Rule Files.
- create a scheduled task to download the latest version of the FireSIGHT System software, rule update, or VDB by clicking either the latest version or the Unknown link in the Latest column; see Scheduling Tasks.
Understanding the RSS Feed Widget
The RSS Feed widget adds an RSS feed to a dashboard. By default, the widget shows a feed of Cisco security news. It appears by default on the Status tabs of the Detailed Dashboard and the Summary Dashboard.
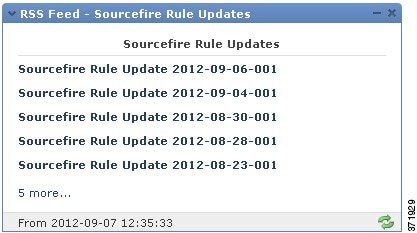
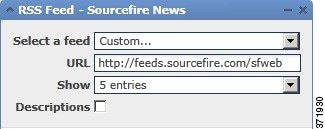
You can also configure the widget to display a preconfigured feed of company news, the Snort.org blog, or the Vulnerability Research Team (VRT) blog, or you can create a custom connection to any other RSS feed by specifying its URL in the widget preferences.
Feeds update every 24 hours (although you can manually update the feed), and the widget displays the last time the feed was updated based on the local time of the appliance. Keep in mind that the appliance must have access to the web site (for the two preconfigured feeds) or to any custom feed you configure.
When you configure the widget, you can also choose how many stories from the feed you want to show in the widget, as well as whether you want to show descriptions of the stories along with the headlines; keep in mind that not all RSS feeds use descriptions.
 ) to manually update the feed
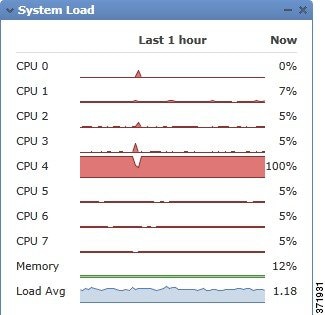
Understanding the System Load Widget
The System Load widget shows the CPU usage (for each CPU), memory (RAM) usage, and system load (also called the load average, measured by the number of processes waiting to execute) on the appliance, both currently and over the dashboard time range. It appears by default on the Status tabs of the Detailed Dashboard and the Summary Dashboard.
You can configure the widget to show or hide the load average by modifying the widget preferences. The preferences also control how often the widget updates. For more information, see Understanding Widget Preferences.
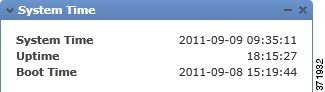
Understanding the System Time Widget
The System Time widget shows the local system time, uptime, and boot time for the appliance. It appears by default on the Status tabs of the Detailed Dashboard and the Summary Dashboard.
You can configure the widget to hide the boot time by modifying the widget preferences. The preferences also control how often the widget synchronizes with the appliance’s clock. For more information, see Understanding Widget Preferences.
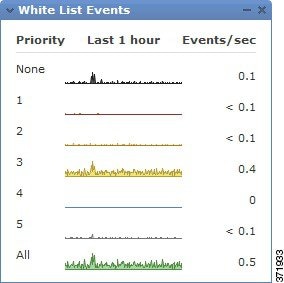
Understanding the White List Events Widget
The White List Events widget shows the average events per second by priority, over the dashboard time range. It appears by default on the Correlation tab of the Default Dashboard.
You can configure the widget to display white list events of different priorities by modifying the widget preferences.
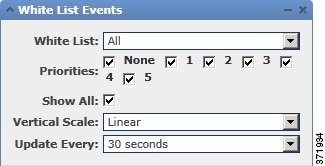
In the widget preferences, you can:
- select one or more Priorities check boxes to display separate graphs for events of specific priorities, including events that do not have a priority
- select Show All to display an additional graph for all white list events, regardless of priority
- select Vertical Scale to choose Linear (incremental) or Logarithmic (factor of ten) scale
The preferences also control how often the widget updates. For more information, see Understanding Widget Preferences.
You can click a graph to view white list events of a specific priority, or click the All graph to view all white list events. In either case, the events are constrained by the dashboard time range; accessing white list events via the dashboard changes the events (or global) time window for the Defense Center. For more information on white list events, see Viewing White List Events.
Working with Dashboards
You can view and modify the widgets that appear on the dashboard.
You manage dashboards on the Dashboard Management page (see Viewing Dashboards). You can create, view, modify, export, and delete dashboards.
For each dashboard, the page indicates the owner (that is, the user who created it) and whether a dashboard is private. Note that, unless you have Administrator access, you can only see your own private dashboards; you cannot view or modify private dashboards created by other users.
Finally, the page indicates which dashboard is the default. You specify the default dashboard in your user preferences; for more information, see Specifying Your Default Dashboard.
For more information on working with dashboards, see:
- Creating a Custom Dashboard
- Viewing Dashboards
- Modifying Dashboards
- Deleting a Dashboard
- Exporting Configurations
Creating a Custom Dashboard
When you create a new dashboard, you can choose to base it on any existing dashboard, whether user-created or predefined by Cisco. This makes a copy of the preexisting dashboard; you can modify this copy to suit your needs. Optionally, you can create a blank new dashboard by choosing not to base your dashboard on any preexisting dashboards.
You must also specify (or disable) the tab change and page refresh intervals. These settings determine how often the dashboard cycles through its tabs and how often the entire dashboard page refreshes.
Refreshing the entire dashboard allows you to see any preference or layout changes that were made to a shared dashboard by another user, or that you made to a private dashboard on another computer, since the last time the dashboard refreshed. This may be useful, for example, in a network operations center (NOC) where a dashboard is displayed at all times. If you want to make changes to the dashboard, you can make the changes at a local computer. Then, the dashboard in the NOC automatically refreshes at the interval you specify and displays your changes without you having to manually refresh the dashboard in the NOC. Note that you do not need to refresh the entire dashboard to see data updates; individual widgets update according to their preferences.
Finally, you can choose to associate the new dashboard with your user account by saving it as a private dashboard. If you choose not to save the dashboard as private, all other users of the appliance can view it.
Keep in mind that because not all user roles have access to all dashboard widgets, users with fewer permissions viewing a dashboard created by a user with more permissions may not be able to use all of the widgets on the dashboard. Although the unauthorized widgets still appear on the dashboard, they are disabled.
You should also keep in mind that any user with dashboard access, regardless of role, can modify shared dashboards. If you want to make sure that only you can modify a particular dashboard, save it as private.
Tip Instead of creating a new dashboard, you can export a dashboard from another appliance, then import it onto your appliance. You can then edit the imported dashboard to suit your needs. Note that the dashboard widgets you can view depend on the type of appliance you are using and on your user role; for example, a dashboard created on the Defense Center and imported onto a managed device may display some invalid, disabled widgets. For more information, see Importing and Exporting Configurations.
Access: Admin/Any Security Analyst/Maint
Step 1 Select Overview > Dashboards > Management .
The Dashboard Management page appears.
Step 2 Click Create Dashboard .
The Create Dashboard page appears.
Step 3 Use the Copy Dashboard drop-down list to select the dashboard on which you want to base the new dashboard.
You can select any predefined or user-defined dashboard. Optionally, select None (the default) to create a blank dashboard.
Step 4 Type a name and optional description for the dashboard.
Step 5 In the Change Tabs Every field, specify (in minutes) how often the dashboard should change tabs.
Unless you pause the dashboard or your dashboard has only one tab, this setting advances your view to the next tab at the interval you specify. To disable tab cycling, enter
0
in the
Change Tabs Every
field.
Step 6 In the Refresh Page Every field, specify (in minutes) how often the current dashboard tab should refresh with new data. This value must be greater than the Change Tabs Every setting.
Unless you pause the dashboard, this setting will refresh the entire dashboard at the interval you specify. To disable the periodic page refresh, enter
0
in the
Refresh Page Every
field.
Note that this setting is separate from the update interval available on many individual widgets; although refreshing the dashboard page resets the update interval on individual widgets, widgets will update according to their individual preferences even if you disable the Refresh Page Every setting.
Step 7 Optionally, select the Save As Private check box to associate the dashboard with your user account and to prevent other users from viewing and modifying the dashboard.
Your dashboard is created and appears in the web interface. You can now tailor it to suit your needs by adding tabs and widgets (and, if you based it on a preexisting dashboard, by rearranging and deleting widgets). For more information, see Modifying Dashboards.
Viewing Dashboards
By default, the home page for your appliance displays the default dashboard. If you do not have a default dashboard defined, the home page shows the Dashboard Management page, where you can choose a dashboard to view. At any time, to view the default dashboard you have configured for your appliance, select Overview > Dashboards ; to view details of all available dashboards, select Overview > Dashboards > Management .
Tip You can configure your appliance to display a different default home page, including pages that are not dashboard pages. You can also change the default dashboard. For more information, see Specifying Your Home Page and Specifying Your Default Dashboard.
Each dashboard has a time range that constrains its widgets. You can change the time range to reflect a period as short as the last hour (the default) or as long as the last year. When you change the time range, the widgets that can be constrained by time automatically update to reflect the new time range.
Note that not all widgets can be constrained by time. For example, the dashboard time range has no effect on the Appliance Information widget, which provides information that includes the appliance name, model, and current version of the FireSIGHT System software.
Keep in mind that for enterprise deployments of the FireSIGHT System, changing the time range to a long period may not be useful for widgets like the Custom Analysis widget, depending on how often newer events replace older events.
You can also pause a dashboard, which allows you to examine the data provided by the widgets without the display changing and interrupting your analysis. Pausing a dashboard has the following effects:
- Individual widgets stop updating, regardless of any Update Every widget preference.
- Dashboard tabs stop cycling, regardless of the Cycle Tabs Every setting in the dashboard properties.
- Dashboard pages stop refreshing, regardless of the Refresh Page Every setting in the dashboard properties.
- Changing the time range has no effect.
When you are finished with your analysis, you can unpause the dashboard. Unpausing the dashboard causes all appropriate widgets on the page to update to reflect the current time range. In addition, dashboard tabs resume cycling and the dashboard page resumes refreshing according to the settings you specified in the dashboard properties.
If you experience connectivity problems or other issues that interrupt the flow of system information to the dashboard, the dashboard automatically pauses and an error notice appears until the problem is resolved.
Note Your session normally logs you out after 1 hour of inactivity (or another configured interval), regardless of whether the dashboard is paused. If you plan to passively monitor the dashboard for long periods of time, consider exempting some users from session timeout, or changing the system timeout settings. For more information, see Managing User Login Settings and Configuring User Interface Settings.
Access: Admin/Any Security Analyst/Maint
Step 1 Select Overview > Dashboards . You have two options, depending on whether you have a default dashboard defined:
The dashboard you selected appears.
To change the dashboard time range:
Access: Admin/Any Security Analyst/Maint
Step 1 From the Show the Last drop-down list, choose a dashboard time range.
Unless the dashboard is paused, all appropriate widgets on the page update to reflect the new time range.
Access: Admin/Any Security Analyst/Maint
Step 1 On the time range control, click the pause icon ( ).
).
The dashboard is paused until you unpause it.
Access: Admin/Any Security Analyst/Maint
Step 1 On the time range control of a paused dashboard, click the play icon ( ).
).
Modifying Dashboards
A dashboard has one or more tabs. You can add, delete, and rename tabs. Note that you cannot change the order of dashboard tabs.
Each tab can display one or more widgets in a three-column layout. You can minimize and maximize widgets, add and remove widgets from tabs, as well as rearrange the widgets on a tab.
You can also change the basic dashboard properties, which include its name and description, the tab cycle and page refresh intervals, and whether you want to share the dashboard with other users.
Note that any user with dashboard access, regardless of role, can modify shared dashboards. If you want to make sure that only you can modify a particular dashboard, make sure to set it as a private dashboard in the dashboard properties.
Every configuration of the Custom Analysis widget in the Cisco predefined dashboards corresponds to a preset for that widget. If you change or delete one of these widgets, you can restore it by creating a new Custom Analysis widget based on the appropriate preset. For more information, see
Tip Every configuration of the Custom Analysis widget in the Cisco predefined dashboards corresponds to a system preset for that widget. If you change or delete one of these widgets, you can restore it by creating a new Custom Analysis widget based on the appropriate preset. For more information, see Configuring the Custom Analysis Widget.
Changing Dashboard Properties
Use the following procedure to change the basic dashboard properties, which include its name and description, the tab cycle and page refresh intervals, and whether you want to share the dashboard with other users.
To change a dashboard’s properties:
Access: Admin/Any Security Analyst/Maint
Step 1 Select Overview > Dashboards > Management .
The Dashboard Management page appears.
Step 2 Click the edit icon ( ) next to the dashboard whose properties you want to change.
The Edit Dashboard page appears. See Creating a Custom Dashboard for information on the various configurations you can change.
Step 3 Make changes as needed and click Save .
Adding Tabs
Use the following procedure to add a tab to a dashboard.
Access: Admin/Any Security Analyst/Maint
Step 1 View the dashboard where you want to add a tab.
For more information, see Viewing Dashboards.
Step 2 To the right of the existing tabs, click the add tab icon ( ).
).
A pop-up window appears, prompting you to name the tab.
Step 3 Type a name for the tab (maximum 25 characters) and click OK , or simply click OK to accept the default name. Note that you can rename the tab at any time; see Renaming Tabs.
The new tab is added. You can now add widgets to the new tab. For more information, see Adding Widgets.
Deleting Tabs
Use the following procedure to delete a dashboard tab and all its widgets. You cannot delete the last tab from a dashboard; each dashboard must have at least one tab.
To delete a tab from a dashboard:
Access: Admin/Any Security Analyst/Maint
Step 1 View the dashboard where you want to delete a tab.
For more information, see Viewing Dashboards.
Step 2 On the tab you want to delete, click the delete icon ( ).
).
Step 3 Confirm that you want to delete the tab.
Renaming Tabs
Use the following procedure to rename a dashboard tab.
Access: Admin/Any Security Analyst/Maint
Step 1 View the dashboard where you want to rename a tab.
For more information, see Viewing Dashboards.
Step 2 Click the tab you want to rename.
A pop-up window appears, prompting you to rename the tab.
Step 4 Type a name for the tab (maximum 25 characters) and click OK .
Adding Widgets
To add a widget to a dashboard, you must first decide to which tab you want to add the widget. When you add a widget to a tab, the appliance automatically adds it to the column with the fewest widgets. If all columns have an equal number of widgets, the new widget is added to the leftmost column. You can add a maximum of 15 widgets to a dashboard tab.
Tip After you add widgets, you can move them to any location on the tab. You cannot, however, move widgets from tab to tab. For more information, see Rearranging Widgets.
To add a widget to a dashboard:
Access: Admin/Any Security Analyst/Maint
Step 1 View the dashboard where you want to add a widget.
For more information, see Viewing Dashboards.
Step 2 Select the tab where you want to add the widget.
The widgets that you can add depend on the type of appliance you are using and on your user role. They are organized according to function: Analysis & Reporting, Miscellaneous, and Operations. You can view the widgets in each category by clicking on the category name, or you can view all widgets by clicking All Categories .
Step 4 Click Add next to the widgets you want to add.
Tip To add multiple widgets of the same type (for example, you may want to add multiple RSS Feed widgets, or multiple Custom Analysis widgets), click Add again.
The widget is immediately added to the dashboard. The Add Widgets page indicates how many widgets of each type are on the tab, including the widget you just added.
Step 5 Optionally, when you are finished adding widgets, click Done to return to the dashboard.
The tab where you added the widgets appears again, reflecting the changes you made.
Rearranging Widgets
You can change the location of any widget on a tab. Note, however, that you cannot move widgets from tab to tab. If you want a widget to appear on a different tab, you must delete it from the existing tab and add it to the new tab.
Access: Admin/Any Security Analyst/Maint
Step 1 Click the title bar of the widget you want to move, then drag it to its new location.
Minimizing and Maximizing Widgets
You can minimize widgets to simplify your view, then maximize them when you want to see them again.
Access: Admin/Any Security Analyst/Maint
Step 1 Click the minimize icon ( ) in a widget’s title bar.
Access: Admin/Any Security Analyst/Maint
Step 1 Click the maximize icon ( ) in a minimized widget’s title bar.
Deleting Widgets
Delete a widget if you no longer want to view it on a tab.
Access: Admin/Any Security Analyst/Maint
Step 1 Click the close icon (
) in the title bar of the widget.
Step 2 Confirm that you want to delete the widget.
The widget is deleted from the tab.
Deleting a Dashboard
Delete a dashboard if you no longer need to use it.
If you delete your default dashboard, you must define a new default or the appliance will force you to select a dashboard to view every time you attempt to view a dashboard. For more information, see Specifying Your Default Dashboard.
Access: Admin/Any Security Analyst/Maint
Step 1 Select Overview > Dashboards > Management .
The Dashboard Management page appears.
Step 2 Click the delete icon ( ) next to the dashboard you want to delete.
Step 3 Confirm that you want to delete the dashboard.
 Feedback