-
Cisco MDS 9000 Family Troubleshooting Guide, Release 3.x
-
Index
-
New and Changed Information
-
Preface
-
Troubleshooting Overview
-
Troubleshooting Installs, Upgrades, and Reboots
-
Managing Storage Services Modules
-
Troubleshooting Hardware
-
Troubleshooting Mixed Generation Hardware
-
Troubleshooting Licensing
-
Troubleshooting Cisco Fabric Services
-
Troubleshooting Ports
-
Troubleshooting N-Port Virtualization
-
Troubleshooting PortChannels and Trunking
-
Troubleshooting VSANs, Domains, and FSPF
-
Troubleshooting SAN Device Virtualization
-
Troubleshooting IVR
-
Troubleshooting Zones and Zone Sets
-
Troubleshooting Distributed Device Alias Services
-
Troubleshooting FICON
-
Troubleshooting RADIUS and TACACS+
-
Troubleshooting Users and Roles
-
Troubleshooting FC-SP, Port Security, and Fabric Binding
-
Troubleshooting IP Storage Services
-
Troubleshooting IP Access Lists
-
Troubleshooting IPsec
-
Troubleshooting SANTap
-
Troubleshooting Digital Certificates
-
Troubleshooting Call Home
-
Troubleshooting Fabric Manager
-
Before Contacting Technical Support
-
Troublelshooting Tools and Methodology
-
Configuration Limits for Cisco MDS SAN-OS Release 3.x
-
 Feedback
Table Of Contents
Troubleshooting Tools and Methodology
Using Cisco MDS 9000 Family Tools
Command-Line Interface Troubleshooting Commands
Viewing Running Processes on Device Manager
Using the show processes CLI Command
Viewing CPU Time In Device Manager
Using the show processes cpu CLI Command
Using the show system resource CLI Command
Using On-Board Failure Logging
Configuring OBFL for the Switch
Fabric Manager and Device Manager
Analyzing Switch Device Health
Analyzing End-to-End Connectivity
Analyzing Switch Fabric Configuration
Analyzing the Results of Merging Zones
Device Manager: RMON Threshold Manager
Enabling Logging for Telnet or SSH
Using Cisco Network Management Products
Cisco MDS 9000 Family Port Analyzer Adapter
Using Other Troubleshooting Products
Fibre Channel Protocol Analyzers
Troubleshooting Tools and Methodology
This appendix describes the troubleshooting tools and methodology available for the Cisco MDS 9000 Family multilayer directors and fabric switches. It includes the following sections:
•
Using Cisco MDS 9000 Family Tools
•
•
Using Cisco MDS 9000 Family Tools
If the server does not see its storage and you cannot use the information available on the host side to determine the root cause of the problem, you can obtain additional information from a different viewpoint using the troubleshooting tools provided with the Cisco MDS 9000 Family switches. This section introduces these tools and describes the kinds of problems for which you can use each tool. It includes the following topics:
•
•
•
Command-Line Interface Troubleshooting Commands
The command-line interface (CLI) lets you configure and monitor a Cisco MDS 9000 Family switch using a local console or remotely using a Telnet or SSH session. The CLI provides a command structure similar to Cisco IOS® software, with context-sensitive help, show commands, multi-user support, and roles-based access control.
Note
CLI Debug
The Cisco MDS 9000 Family switches support an extensive debugging feature set for actively troubleshooting a storage network. Using the CLI, you can enable debugging modes for each switch feature and view a real-time updated activity log of the control protocol exchanges. Each log entry is time-stamped and listed in chronological order. Access to the debug feature can be limited through the CLI roles mechanism and can be partitioned on a per-role basis. While debug commands show realtime information, the show commands can be used to list historical information as well as realtime.
Note
By using the '?' option, you can see the options that are available for any switch feature, such as FSPF. A log entry is created for each entered command in addition to the actual debug output. The debug output shows a time-stamped account of activity occurring between the local switch and other adjacent switches.
You can use the debug facility to keep track of events, internal messages, and protocol errors. However, you should be careful with using the debug utility in a production environment, because some options may prevent access to the switch by generating too many messages to the console or if very CPU-intensive may seriously affect switch performance.
Note
The following is an example of the output from the debug flogi event command:
switch# debug flogi event interface fc1/1Dec 10 23:40:26 flogi: current state [FLOGI_ST_FLOGI_RECEIVED]Dec 10 23:40:26 flogi: current event [FLOGI_EV_VALID_FLOGI]Dec 10 23:40:26 flogi: next state [FLOGI_ST_GET_FCID]Dec 10 23:40:26 flogi: fu_fsm_execute: ([1]21:00:00:e0:8b:08:96:22)Dec 10 23:40:26 flogi: current state [FLOGI_ST_GET_FCID]Dec 10 23:40:26 flogi: current event [FLOGI_EV_VALID_FCID]Dec 10 23:40:26 flogi: next state [FLOGI_ST_PERFORM_CONFIG]Dec 10 23:40:26 flogi: fu_fsm_execute: ([1]21:00:00:e0:8b:08:96:22)Dec 10 23:40:26 flogi: current state [FLOGI_ST_PERFORM_CONFIG]Dec 10 23:40:26 flogi: current event [FLOGI_EV_CONFIG_DONE_PENDING]Dec 10 23:40:26 flogi: next state [FLOGI_ST_PERFORM_CONFIG]Dec 10 23:40:26 flogi: fu_fsm_execute: ([1]21:00:00:e0:8b:08:96:22)Dec 10 23:40:26 flogi: current state [FLOGI_ST_PERFORM_CONFIG]Dec 10 23:40:26 flogi: current event [FLOGI_EV_RIB_RESPOSE]Dec 10 23:40:26 flogi: next state [FLOGI_ST_PERFORM_CONFIG]The following is a summary of some of the common debug commands available Cisco SAN-OS:
FC Ping and FC Traceroute
Note
Ping and traceroute are two of the most useful tools for troubleshooting TCP/IP networking problems. The ping utility generates a series of echo packets to a destination across a TCP/IP internetwork. When the echo packets arrive at the destination, they are rerouted and sent back to the source. Using ping, you can verify connectivity to a particular destination across an IP routed network.
The traceroute utility operates in a similar fashion, but can also determine the specific path that a frame takes to its destination on a hop-by-hop basis.
These tools have been migrated to Fibre Channel for use with the Cisco MDS 9000 Family switches and are called FC ping and FC traceroute. You can access FC ping and FC traceroute from the CLI or from Fabric Manager.
This section contains the following topics:
Using FC Ping
The FC ping tool:
•
•
FC ping allows you to ping a Fibre Channel N port or end device. (See Example B-1.) By specifying the FCID or Fibre Channel address, you can send a series of frames to a target N port. Once these frames reach the target device's N port, they are looped back to the source and a time-stamp is taken. FC ping helps you to verify the connectivity to an end N port. FC ping uses the PRLI Extended Link Service, and verifies the presence of a Fibre Channel entity in case of positive or negative answers.
The FC Ping feature verifies reachability of a node by checking its end-to-end connectivity.
•
•
switch# fcping pwwn 20:00:00:2e:c4:91:d4:54switch# fcping fcid 0x123abcExample B-1 FC Ping Command
switch# fcping fcid 0xef02c9 vsan 128 bytes from 0xef02c9 time = 1408 usec28 bytes from 0xef02c9 time = 379 usec28 bytes from 0xef02c9 time = 347 usec28 bytes from 0xef02c9 time = 361 usec28 bytes from 0xef02c9 time = 363 usec5 frames sent, 5 frames received, 0 timeoutsRound-trip min/avg/max = 347/571/1408 usecUsing FC Traceroute
Use the FC Trace feature to:
•
•
FC traceroute identifies the path taken on a hop-by-hop basis and includes a timestamp at each hop in both directions. (See Example B-2.) FC ping and FC traceroute are useful tools to check for network connectivity problems or verify the path taken toward a specific destination. You can use FC traceroute to test the connectivity of TE ports along the path between the generating switch and the switch closest to the destination.
Choose Tools > Traceroute on Fabric Manager or use the fctrace CLI command to access this feature.
Use FC Trace by providing the FC ID, the N port, or the NL port WWN of the destination. The frames are routed normally as long as they are forwarded through TE ports. After the frame reaches the edge of the fabric (the F port or FL port connected to the end node with the given port WWN or the FC ID), the frame is looped back (swapping the source ID and the destination ID) to the originator.
If the destination cannot be reached, the path discovery starts, which traces the path up to the point of failure.
The FC Trace feature works only on TE Ports. Make sure that only TE ports exist in the path to the destination. If there is an E Port in the path:
•
•
•
Note
Example B-2 fctraceroute Command
switch# fctrace fcid 0xef0000 vsan 1Route present for : 0xef000020:00:00:05:30:00:59:de(0xfffcee)Latency: 0 msec20:00:00:05:30:00:58:1e(0xfffc6c)Timestamp Invalid.20:00:00:05:30:00:59:1e(0xfffcef)Latency: 0 msec20:00:00:05:30:00:59:1e(0xfffcef)Latency: 174860 msec20:00:00:05:30:00:58:1e(0xfffc6c)
Note
switch# show fcns database vsan 600VSAN 600--------------------------------------------------------------------------FCID TYPE PWWN (VENDOR) FC4-TYPEFEATURE--------------------------------------------------------------------------0xeb01e8 NL 210000203767f7a2 (Seagate) scsi-fcptarget0xec00e4 NL 210000203767f48a (Seagate) scsi-fcp0xec00e8 NL 210000203767f507 (Seagate) scsi-fcpTotal number of entries = 3switch# fctrace fcid 0xeb01e8 vsan 600Route present for 0xeb01e82000000530007ade(0xfffcee) ---> MDS originating the traceLatency 0 msec2000000c30575ec0(0xfffced) --->first hop MDS towards destination FCIDLatency 30820 msec2000000c306c2440(0xfffceb) --> MDS which connects directly to the traced FCID (0xeb01e8)Latency 0 msec2000000c306c2440(0xfffceb) -->idem, but looped aroundLatency 0 msec2000000c30575ec0(0xfffced) --> first hop MDS on the return path from traced FCID to originorswitch#Monitoring Processes and CPUs
There are features in both CLI and Device Manager for monitoring switch processes and CPU status and utilization.
This section contains the following topics:
•
•
•
•
•
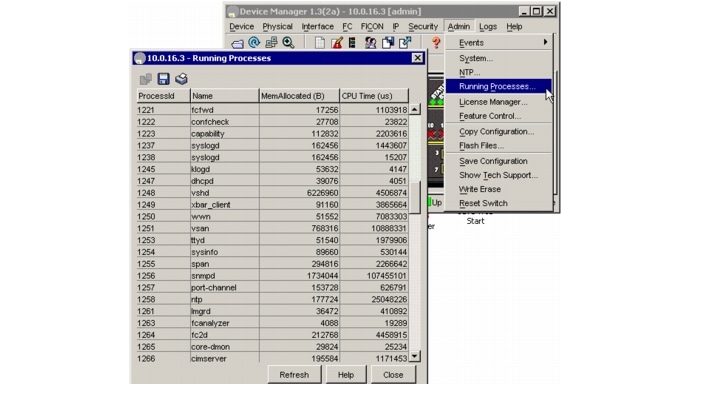
Viewing Running Processes on Device Manager
Choose Admin > Running Processes on Device Manager to view information about the processes currently running on a switch. The Running Processes dialog box (See Figure B-1.)
The dialog display includes:
•
•
•
•
Figure B-1 Running Processes Dialog Box
Using the show processes CLI Command
Use the show processes command to identify the processes that are running and the status of each process. (See Example B-3.) The command output includes:
•
•
•
•
•
•
Process states are:
•
•
•
•
•
•
•
Note
Example B-3 show processes Command
switch# show processes ?cpu Show processes CPU Infolog Show information about process logsmemory Show processes Memory Infoswitch# show processesPID State PC Start_cnt TTY Process----- ----- -------- ----------- ---- -------------. . .457 S 2abaa76f 1 - portmap1218 S 2acbac24 1 - licmgr1249 S 2ade633e 1 - xbar_client1250 S 2aca833e 1 - wwn1251 S 2aebbc24 1 - vsan1253 S 2ade433e 1 - ttyd1254 S 2ac51ef4 1 - sysinfo1255 S 2af7333e 1 - spanViewing CPU Time In Device Manager
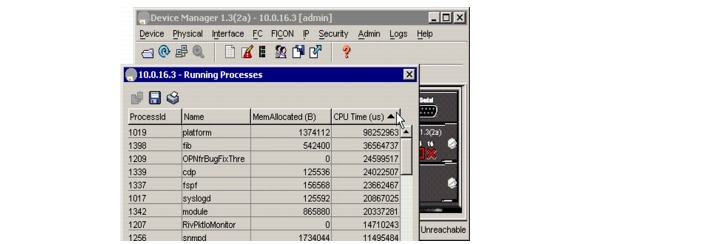
The Running Processes dialog display can be sorted based on any column header. To sort on CPU utilization, click the CPU column header. An arrow in the column header indicates the order of CPU utilization. Click the column header to toggle between ascending or descending order.
Example B-4 CPU Time Column Header
Using the show processes cpu CLI Command
Use the show processes cpu command to display CPU utilization. The command output includes:
•
•
•
•
Example B-5 show processes cpu Command
switch# show processes cpuPID Runtime(ms) Invoked uSecs 1Sec Process----- ----------- -------- ----- ----- -----------1016 7 2 3714 0.0 tftpd1017 20627 2921172 7 0.0 syslogd1218 299 11710 25 0.0 licmgr1219 25 38 676 0.0 fs-daemon1220 1558 6985 223 0.0 feature-mgr1221 263 11772 22 0.0 fcfwd1223 512 8996 56 0.0 capability1237 313 29072 10 0.0 syslogd1249 912 18815 48 0.0 xbar_client1250 1481 6214 238 0.0 wwn1251 1460 68079 21 0.0 vsan1253 457 29220 15 0.0 ttyd1254 138 6309 21 0.0 sysinfoUsing the show system resource CLI Command
Use the show system resources command to display system-related CPU and memory statistics. The output includes the following:
•
•
•
•
Example B-6 show system resources Command
switch# show system resourcesLoad average: 1 minute: 0.00 5 minutes: 0.00 15 minutes: 0.00Processes : 152 total, 3 runningCPU states : 0.0% user, 0.0% kernel, 100.0% idleMemory usage: 960080K total, 412900K used, 547180K free2340K buffers, 292380K cacheUsing On-Board Failure Logging
The Generation 2 Fibre Channel switching modules provide the facility to log failure data to persistent storage, which can be retrieved and displayed for analysis. This on-board failure logging (OBFL) feature stores failure and environmental information in nonvolatile memory on the module. The information will help in post-mortem analysis of failed cards.
The data stored by the OBFL facility includes the following:
•
•
•
•
•
•
•
•
•
•
•
•
•
•
Configuring OBFL for the Switch
To configure OBFL for all the modules on the switch, follow these steps
Use the show logging onboard status command to display the configuration status of OBFL.
switch# show logging onboard statusSwitch OBFL Log: EnabledModule: 6 OBFL Log: Enablederror-stats Enabledexception-log Enabledmiscellaneous-error Enabledobfl-log (boot-uptime/device-version/obfl-history) Enabledsystem-health Enabledstack-trace EnabledConfiguring OBFL for a Module
To configure OBFL for specific modules on the switch, follow these steps
Use the show logging onboard status command to display the configuration status of OBFL.
switch# show logging onboard statusSwitch OBFL Log: EnabledModule: 6 OBFL Log: Enablederror-stats Enabledexception-log Enabledmiscellaneous-error Enabledobfl-log (boot-uptime/device-version/obfl-history) Enabledsystem-health Enabledstack-trace EnabledDisplaying OBFL Logs
To display OBFL information stored in CompactFlash on a module, use the following commands:
Fabric Manager Tools
Fabric Manager provides fabric-wide management capabilities including discovery, multiple switch configuration, network monitoring, and troubleshooting. It provides the troubleshooting features described in the following topics:
•
•
•
•
•
•
Note
Fabric Manager and Device Manager
Fabric Manager provides a map of the discovered fabric and includes tables that display statistical information about the switches in the fabric. You can also select troubleshooting tools from the Fabric Manager Tools menu.
Note
Device Manager provides a graphic display of a specific switch and shows the status of each port on the switch. From Device Manager, you can drill down to get detailed statistics about a specific switch or port.
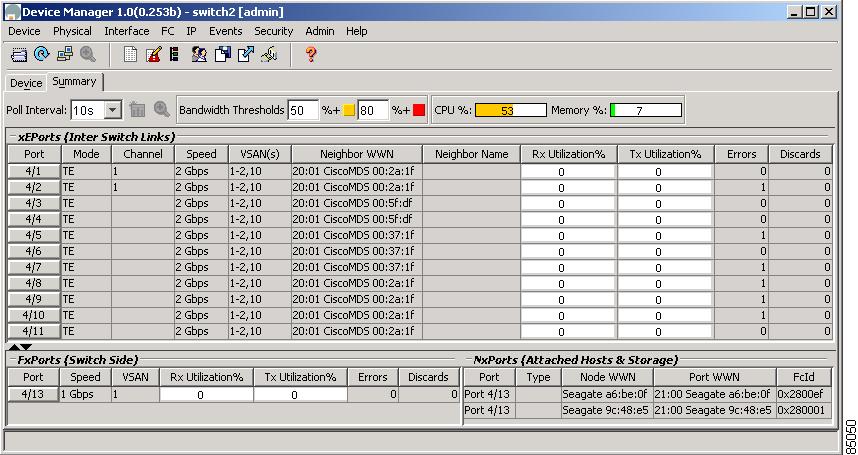
Figure B-2 shows the Device Manager Summary View window.
Figure B-2 Cisco Device Manager Summary View
The Summary View window lets you analyze switch performance issues, diagnose problems, and change parameters to resolve problems or inconsistencies. This view shows aggregated statistics for the active Supervisor Module and all switch ports. Information is presented in tabular or graphical formats, with bar, line, area, and pie chart options. You can also use the Summary View to capture the current state of information for export to a file or output to a printer.
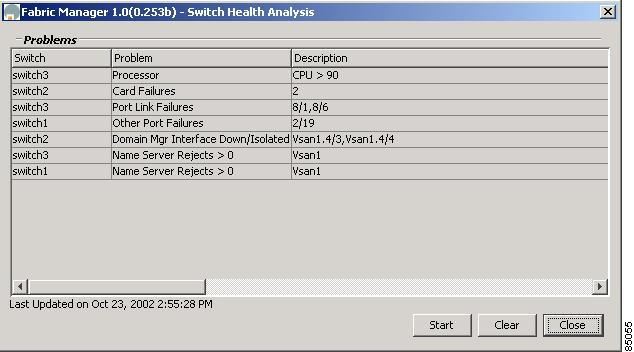
Analyzing Switch Device Health
Choose the Switch Health option from the Fabric Manager Tools menu to determine the status of the components of a specific switch.
Figure B-3 Switch Health Analysis Window
The Switch Health Analysis window displays any problems affecting the selected switches.
Analyzing End-to-End Connectivity
Select Tools > End to End Connectivity option from Fabric Manager to determine connectivity and routes among devices with the switch fabric. The connectivity tool checks to see that every pair of end devices in an active zone can talk to each other, using a Ping test and by determining if they are in the same VSAN. This option uses versions of the ping and traceroute commands modified for Fibre Channel networks.
The End to End Connectivity Analysis window displays the selected end points with the switch to which each is attached, and the source and target ports used to connect it.
The output shows all the requests which have failed. The possible descriptions are:
•
•
•
•
•
•
•
•
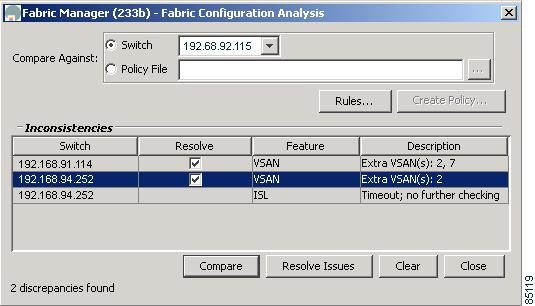
Analyzing Switch Fabric Configuration
Select the Fabric Configuration option from the Fabric Manager Tools menu to analyze the configuration of a switch by comparing the current configuration to a specific switch or to a policy file. You can save a switch configuration to a file and then compare all switches against the configuration in the file.
Figure B-4 Fabric Configuration Analysis Window
You use a policy file to define the rules to be applied when running the Fabric Checker. When you create a policy file, the system saves the rules selected for the selected switch.
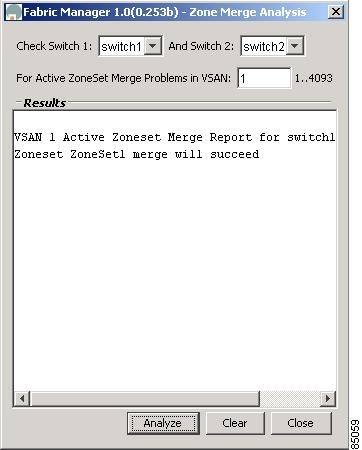
Analyzing the Results of Merging Zones
Cisco Fabric Manager provides a very useful tool for troubleshooting problems that occur when merging zones configured on different switches.
Select the Zone Merge option on the Fabric Manager Tools menu to determine if two connected switches have compatible zone configurations.
Figure B-5 Zone Merge Analysis Window
The Zone Merge Analysis window displays any inconsistencies between the zone configuration of the two selected switches.
You can use the following options on the Fabric Manager Tools menu to verify connectivity to a selected object or to open other management tools:
•
•
•
Alerts and Alarms
You can configure and monitor SNMP, RMON, Syslog, and Call Home alarms and notifications using the different options on the Device Manager Events menu. SNMP provides a set of preconfigured traps and informs that are automatically generated and sent to the destinations (trap receivers) that you identify. The RMON Threshold Manager lets you configure thresholds for specific events that trigger log entries or notifications. You can use either Fabric Manager or Device Manager to identify Syslog servers that will record different events or to configure Call Home, which can alert you through e-mail messages or paging when specific events occur.
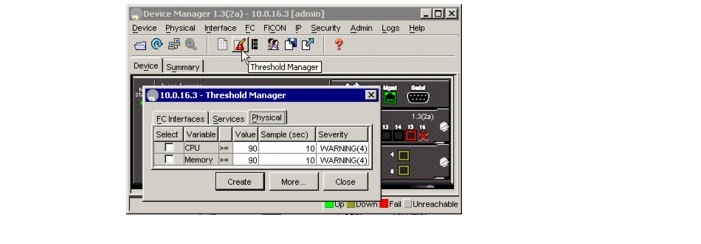
Device Manager: RMON Threshold Manager
Use the options on the Device Manager Events menu to configure and monitor Simple Network Management Protocol (SNMP), Remote Monitor (RMON), Syslog, and Call Home alarms and notifications. SNMP provides a set of preconfigured traps and informs that are automatically generated and sent to the destinations (trap receivers) chosen by the user.
Use the RMON Threshold Manager to configure event thresholds that will trigger log entries or notifications. Use either Fabric Manager or Device Manager to:
•
•
The RMON groups that have been adapted for use with Fibre Channel include the AlarmGroup and EventGroup. The AlarmGroup provides services to set alarms. Alarms can be set on one or multiple parameters within a device. For example, an RMON alarm can be set for a specific level of CPU utilization or crossbar utilization on a switch. The EventGroup allows configuration of events (actions to be taken) based on an alarm condition. Supported event types include logging, SNMP traps, and log-and-trap.
Figure B-6 RMON Threshold Manager
Fibre Channel Name Service
The Fibre Channel name service is a distributed service in which all connected devices participate. As new SCSI target devices attach to the fabric, they register themselves with the name service, which is then distributed among all participating fabric switches. This information can then be used to help determine the identity and topology of nodes connected to the fabric.
SCSI Target Discovery
The SCSI Target Discovery feature provides added insight into connected SCSI targets. This feature allows the switch to briefly log into connected SCSI target devices and issue a series of SCSI inquiry commands to help discover additional information. The additional information that is queried includes logical unit number (LUN) details including the number of LUNs, the LUN IDs, and the sizes of the LUNs.
This information is then compiled and made available to through CLI commands, through the Cisco Fabric Manager, and also via an embedded SNMP MIB which allows the information to be easily retrieved by an upstream management application. Using the SCSI Target Discovery feature, you can have a much more detailed view of the fabric and its connected SCSI devices.
The following is an example of output from the discover scsi-target command:
switch# discover scsi-target local remotediscovery startedswitch# show scsi-target lun vsan 1- ST318203FC from SEAGATE (Rev 0004)FCID is 0xef02b5 in VSAN 1, PWWN is 21:00:00:20:37:46:78:97-----------------------------------------------------------------------------LUN Capacity Status Serial Number Device-Id(MB)-----------------------------------------------------------------------------0x0 18210 Online LRA2510000007027 C:1 A:0 T:3 20:00:00:20:37:46:78:97- ST318203FC from SEAGATE (Rev 0004)FCID is 0xef02b6 in VSAN 1, PWWN is 21:00:00:20:37:5b:cf:b9-----------------------------------------------------------------------------LUN Capacity Status Serial Number Device-Id(MB)-----------------------------------------------------------------------------0x0 18210 Online LR94873000007029 C:1 A:0 T:3 20:00:00:20:37:5b:cf:b9- ST318203FC from SEAGATE (Rev 0004)FCID is 0xef02b9 in VSAN 1, PWWN is 21:00:00:20:37:18:6f:90-----------------------------------------------------------------------------LUN Capacity Status Serial Number Device-Id(MB)-----------------------------------------------------------------------------0x0 18210 Online LR18591800001004 C:1 A:0 T:3 20:00:00:20:37:18:6f:90For more information about SCSI target discovery, refer to the Cisco MDS 9000 Family Configuration Guide.
Note
SNMP and RMON Support
The Cisco MDS 9000 Family switches provide extensive SNMPv1, v2, and v3support, including Management Information Bases (MIBs) and notifications (traps and informs).
The applications provided by Cisco that use SNMP include Fabric Manager and CiscoWorks RME. Also, the SNMP standard allows any third-party applications that support the different MIBs to manage and monitor Cisco MDS 9000 Family switches.
SNMPv3 provides extended security. Each switch can be selectively enabled or disabled for SNMP service. In addition, each switch can be configured with a method of handling SNMPv1 and v2 requests.
Note
Cisco MDS 9000 Family switches support over 50 different MIBs, which can be divided into the following six categories:
•
These MIBs are used to report information on the physical devices themselves in terms of physical attributes etc.
•
These MIBs are used to report additional physical device information about Cisco-only devices such as their configuration.
•
These MIBs are used to report transport-oriented statistics on such protocols as IP, TCP, and UDP. These transports are used in the management of the Cisco MDS 9000 Family through the OOB Ethernet interface on the Supervisor module.
•
óThese MIBs were written by Cisco to help expose information that is discovered within a fabric to management applications not connected to the fabric itself. In addition to exposing configuration details for features like zoning and Virtual SANs (VSANs) via MIBs, discovered information from sources like the FC-GS-3 Name Server can be pulled via a MIB. Additionally, MIBs are provided to configure/enable features within the Cisco MDS 9000 Family. There are over 20 new MIBs provided by Cisco for this information and configuration capability.
•
óWhile many of these MIBs are still work-in-progress, Cisco is helping to draft such MIBs for protocols such as iSCSI and Fibre Channel-over-IP (FCIP) to be standardized within the IETF.
•
óThere are several other MIBs provided in the Cisco MDS 9000 Family switches for tasks such as defining the SNMP framework or creating SNMP partitioned views.
You can use SNMPv3 to assign different SNMP capabilities to specific roles.
Cisco MDS 9000 Family switches also support Remote Monitoring (RMON) for Fibre Channel. RMON provides a standard method to monitor the basic operations of network protocols providing connectivity between SNMP management stations and monitoring agents. RMON also provides a powerful alarm and event mechanism for setting thresholds and sending notifications based on changes in network behavior.
The RMON groups that have been adapted for use with Fibre Channel include the AlarmGroup and the EventGroup. The AlarmGroup provides services to set alarms. Alarms can be set on one or multiple parameters within a device. For example, you can set an RMON alarm for a specific level of CPU utilization or crossbar utilization on a switch. The EventGroup lets you configure events that are actions to be taken based on an alarm condition. The types of events that are supported include logging, SNMP traps, and log-and-trap.
Note
Using RADIUS
RADIUS is fully supported for the Cisco MDS 9000 Family switches through the Fabric Manager and the CLI. RADIUS is a protocol used for the exchange of attributes or credentials between a head-end RADIUS server and a client device. These attributes relate to three classes of services:
•
•
•
Authentication refers to the authentication of users for access to a specific device. You can use RADIUS to manage user accounts for access to Cisco MDS 9000 Family switches. When you try to log into a switch, the switch validates you with information from a central RADIUS server.
Authorization refers to the scope of access that you have once you have been authenticated. Assigned roles for users can be stored in a RADIUS server along with a list of actual devices that the user should have access to. Once the user has been authenticated, then switch can then refer to the RADIUS server to determine the extent of access the user will have within the switch network.
Accounting refers to the log information that is kept for each management session in a switch. This information may be used to generate reports for troubleshooting purposes and user accountability. Accounting can be implemented locally or remotely (using RADIUS).
The following is an example of an accounting log entries.
switch# show accounting logSun Dec 15 04:02:27 2002:start:/dev/pts/0_1039924947:adminSun Dec 15 04:02:28 2002:stop:/dev/pts/0_1039924947:admin:vsh exited normallySun Dec 15 04:02:33 2002:start:/dev/pts/0_1039924953:adminSun Dec 15 04:02:34 2002:stop:/dev/pts/0_1039924953:admin:vsh exited normallySun Dec 15 05:02:08 2002:start:snmp_1039928528_172.22.95.167:publicSun Dec 15 05:02:08 2002:update:snmp_1039928528_172.22.95.167:public:Switchname
Note
Using Syslog
The system message logging software saves messages in a log file or directs the messages to other devices. This feature provides the following capabilities:
•
•
•
Syslog lets you store a chronological log of system messages locally or sent to a central Syslog server. Syslog messages can also be sent to the console for immediate use. These messages can vary in detail depending on the configuration that you choose.
Syslog messages are categorized into 7 severity levels from debug to critical events. You can limit the severity levels that are reported for specific services within the switch. For example, you may wish only to report debug events for the FSPF service but record all severity level events for the Zoning service.
A unique feature within the Cisco MDS 9000 Family switches is the ability to send RADIUS accounting records to the Syslog service. The advantage of this feature is that you can consolidate both types of messages for easier correlation. For example, when you log into a switch and change an FSPF parameter, Syslog and RADIUS provide complimentary information that will help you formulate a complete picture of the event.
Log messages are not saved across system reboots. However, a maximum of 100 log messages with a severity level of critical and below (levels 0, 1, and 2) are saved in NVRAM. You can view this log at any time with the show logging nvram command.
Logging Levels
The MDS supports the following logging levels:
•
•
•
•
•
•
•
•
By default, the switch logs normal but significant system messages to a log file and sends these messages to the system console. Users can specify which system messages should be saved based on the type of facility and the severity level. Messages are time-stamped to enhance real-time debugging and management.
Enabling Logging for Telnet or SSH
System logging messages are sent to the console based on the default or configured logging facility and severity values.
Users can disable logging to the console or enable logging to a given Telnet or SSH session.
•
•
Note
The no logging console command shown in Example B-7:
•
•
Example B-7 no logging console Command
switch(config)# no logging consoleThe terminal monitor command shown in Example B-8:
•
•
Example B-8 terminal monitor Command
switch# terminal monitorUsing Fibre Channel SPAN
You can use the Switched Port Analyzer (SPAN) utility to perform detailed troubleshooting or to take a sample of traffic from a particular application host for proactive monitoring and analysis. This utility is most helpful when you have a Fibre Channel protocol analyzer available and you are monitoring user traffic between two FC IDs.
When you have a problem in your storage network that you cannot solve by fixing the device configuration, you typically need to take a look at the protocol level. You can use debug commands to look at the control traffic between an end node and a switch. However, when you need to focus on all the traffic originating from or destined to a particular end node such as a host or a disk, you can use a protocol analyzer to capture protocol traces.
To use a protocol analyzer, you must insert the analyzer in-line with the device under analysis, which disrupts input and output (I/O) to and from the device. This problem is worse when the point of analysis is on an Inter-Switch Link (ISL) link between two switches. In this case, the disruption may be significant depending on what devices are downstream from the severed ISL link.
In Ethernet networks, this problem can be solved using the SPAN utility, which is provided with the Cisco Catalyst Family of Ethernet switches. SPAN has also been implemented with the Cisco MDS 9000 Family switches for use in Fibre Channel networks. SPAN lets you take a copy of all traffic and direct it to another port within the switch. The process is non-disruptive to any connected devices and is facilitated in hardware, which prevents any unnecessary CPU load. Using Fibre Channel SPAN, you can connect a Fibre Channel analyzer, such as a Finisar analyzer, to an unused port on the switch and then SPAN a copy of the traffic from a port under analysis to the analyzer in a non-disruptive fashion.
SPAN allows you to create up to 16 independent SPAN sessions within the switch. Each session can have up to four unique sources and one destination port. In addition, you can apply a filter to capture only the traffic received or the traffic transmitted. With Fibre Channel SPAN, you can even capture traffic from a particular Virtual SAN (VSAN).
To start the SPAN utility use the CLI command span session session_num, where session_num identifies a specific SPAN session. When you enter this command, the system displays a submenu, which lets you configure the destination interface and the source VSAN or interfaces.
switch2# config terminalswitch2(config)# span session 1 <<=== Create a span sessionswitch2(config-span)# source interface fc1/8 <<=== Specify the port to be spannedswitch2(config-span)# destination interface fc1/3 <<==== Specify the span destination portswitch2(config-span)# endswitch2# show span session 1Session 1 (active)Destination is fc1/1No session filters configuredIngress (rx) sources arefc1/8,Egress (tx) sources arefc1/8,For more information about configuring SPAN, refer to the Cisco MDS 9000 Family Configuration Guide.
Using Cisco Network Management Products
This section describes network management tools that are available from Cisco and are useful for troubleshooting problems with Cisco MDS 9000 Family switches and connected devices and includes the following topics:
•
Cisco MDS 9000 Family Port Analyzer Adapter
The Cisco MDS 9000 Family Port Analyzer Adapter is a stand-alone adapter card that converts Fibre Channel frames to Ethernet frames by encapsulating each Fibre Channel frame into an Ethernet frame. This product is meant to be used for analyzing SPAN traffic from a Fibre channel port on a Cisco MDS 9000 Family switch.
The Cisco MDS 9000 Family Port Analyzer Adapter provides two physical interfaces:
•
•
Note
The Cisco MDS 9000 Family Port Analyzer Adapter provides the following features:
•
•
•
•
•
•
•
•
•
•
•
•
•
•
When used in conjunction with the open source protocol analyzer, Ethereal (http//www.ethereal.com), the Cisco MDS 9000 Family Port Analyzer Adapter provides a cost-effective and powerful troubleshooting tool. It allows any PC with a Ethernet card to provide the functionality of a flexible Fibre Channel analyzer. For more information on using the Cisco MDS 9000 Family Port Analyzer Adapter see the Cisco MDS 9000 Family Port Analyzer Adapter Installation and Configuration Guide.
Cisco Fabric Analyzer
The ultimate tool for troubleshooting network protocol problems is the protocol analyzer. Protocol analyzers promiscuously capture network traffic and completely decode the captured frames down to the protocol level. Using a protocol analyzer, you can conduct a detailed analysis by taking a sample of a storage network transaction and by mapping the transaction on a frame-by-frame basis, complete with timestamps. This kind of information lets you pinpoint a problem with a high degree of accuracy and arrive at a solution more quickly. However, dedicated protocol analyzers are expensive and they must be placed locally at the point of analysis within the network.
With the Cisco Fabric Analyzer, Cisco has brought Fibre Channel protocol analysis within a storage network to a new level of capability. Using Cisco Fabric Analyzer, you can capture Fibre Channel control traffic from a switch and decode it without having to disrupt any connectivity, and without having to be present locally at the point of analysis.
The Cisco Fabric Analyzer consists of three main components:
•
•
•
The text-based interface to the Cisco Fabric Analyzer is a CLI-based program for controlling the analyzer and providing output of the decoded results. Using the CLI, you can remotely access an Cisco MDS 9000 Family switch, using Telnet or a secure method such as Secure Shell (SSH). You can then capture and decode Fibre Channel control traffic, which offers a convenient method for conducting detailed, remote troubleshooting. In addition, because this tool is CLI-based, you can use roles-based policies to limit access to this tool as required.
The GUI-based implementation (Ethereal) can be installed on any Windows or Linux workstation. This application provides an easier-to-use interface that is more easily customizable. The GUI interface lets you easily sort, filter, crop, and save traces to your local workstation.
The Ethereal application allows remote access to Fibre Channel control traffic and does not require a Fibre Channel connection on the remote workstation.
The Cisco Fabric Analyzer lets you capture and decode Fibre Channel traffic remotely over Ethernet. It captures Fibre Channel traffic, encapsulates it in TCP/IP, and transports it over an Ethernet network to the remote client. The remote client then deencapsulates and fully decodes the Fibre Channel frames. This capability provides flexibility for troubleshooting problems in remote locations.
The Cisco Fabric Analyzer captures and analyzes control traffic coming to the Supervisor Card. This tool is much more effective than the debug facility for packet trace and traffic analysis, because it is not very CPU intensive and it provides a graphic interface for easy analysis and decoding of the captured traffic.
switch# config terminalswitch(config)# fcanalyzer local briefCapturing on eth20.000000 ff.ff.fd -> ff.ff.fd SW_ILS 1 0x59b7 0xffff 0x7 -> 0xf HLO0.000089 ff.ff.fd -> ff.ff.fd FC 1 0x59b7 0x59c9 0xff -> 0x0 Link Ctl, ACK11.991615 ff.ff.fd -> ff.ff.fd SW_ILS 1 0x59ca 0xffff 0xff -> 0x0 HLO1.992024 ff.ff.fd -> ff.ff.fd FC 1 0x59ca 0x59b8 0x7 -> 0xf Link Ctl, ACK1fcanalyer example of fully decoded frame.switch2(config)# fcanalyzer localCapturing on eth2Frame 1 (96 bytes on wire, 96 bytes captured)Arrival Time Jan 13, 2003 135038.787671000Time delta from previous packet 0.000000000 secondsTime relative to first packet 0.000000000 secondsFrame Number 1Packet Length 96 bytesCapture Length 96 bytesEthernet II, Src 00000000000a, Dst 00000000ee00Destination 00000000ee00 (00000000ee00)Source 00000000000a (00000000000a)Type Vegas FC Frame Transport (0xfcfc)MDS Header(SOFf/EOFn)MDS HeaderPacket Len 66.... 0000 0001 11.. = Dst Index 0x0007.... ..00 1111 1111 = Src Index 0x00ff.... 0000 0000 0001 = VSAN 1MDS TrailerEOF EOFn (3)Fibre ChannelR_CTL 0x02Dest Addr ff.fc.7eCS_CTL 0x00Src Addr ff.fc.7fType SW_ILS (0x22)F_CTL 0x290000 (Exchange Originator, Seq Initiator, Exchg First, Seq Last,CS_CTL, Transfer Seq Initiative, Last Data Frame - No Info, ABTS - Abort/MS, )SEQ_ID 0x11DF_CTL 0x00SEQ_CNT 0OX_ID 0x5a06RX_ID 0x0000Parameter 0x00000000SW_ILSCmd Code SW_RSCN (0x1b)0010 .... = Event Type Port is offline (2).... 0000 = Address Format Port Addr Format (0)Affected Port ID 7f.00.01Detection Function Fabric Detected (0x00000001)Num Entries 1Device Entry 0Port State 0x20Port Id 7f.00.01Port WWN 1000000530005f1f (000530)Node WWN 1000000530005f1f (000530)However, the Cisco Fabric Analyzer is not the right tool for troubleshooting end-to-end problems because it cannot access any traffic between the server and storage subsystems. That traffic is switched locally on the linecards, and does not reach the Supervisor card. In order to debug issues related to the communication between server and storage subsystems, you need to use Fibre Channel SPAN with an external protocol analyzer.
There are two ways you can start the Cisco Fabric Analyzer from the CLI.
•
•
For more information about using the Cisco Fabric Analyzer, refer to the Cisco MDS 9000 Family Configuration Guide.
IP Network Simulator
Network simulators let you simulate various kinds of IP data network conditions. A simulator allows you to troubleshoot IP network problems, and can also help you understand the potential impact of additional traffic or specific network conditions to your existing network configuration.
Network simulator is a generic tool that provides simulation features for all Ethernet traffic, and handles full duplex Gigabit Ethernet traffic at full line rate. It is supported on the 8-port IP Storage Services (IPS-8) module and on the 4-port IP Storage Services (IPS-4) module only. It requires the SAN Extension Tuner, which is available in either the SAN extension over IP package for IPS-8 modules (SAN_EXTN_OVER_IP) or the SAN extension over IP package for IPS-4 modules (SAN_EXTN_OVER_IP_IPS4).
The network simulator tool can simulate the following network functions:
•
•
•
•
•
For more information about using the IP Network Simulator, refer to the Cisco MDS 9000 Family CLI Configuration Guide.
Using Other Troubleshooting Products
This section describes products from other vendors that you might find useful when troubleshooting problems with your storage network and connected devices. It includes the following topics:
•
Fibre Channel Testers
Fibre Channel testers are generally used to troubleshoot low-level protocol functions (such as Link Initialization). Usually these devices operate at 1- or 2-Gbps and provide the capability to create customized low-level Fibre Channel primitive sequences.
Fibre Channel testers are primarily used to ensure physical connectivity and low-level protocol compatibility, such as with different operative modes like Point-to-Point or Loop mode.
Fibre Channel testers and more generalized optical testers may used to spot broken cables, speed mismatch, link initialization problems and transmission errors. These devices sometimes incorporate higher-level protocol analysis tools and may bundled with generic protocol analyzers.
Fibre Channel Protocol Analyzers
An external protocol analyzer (for example from Finisar), is capable of capturing and decoding link level issues and the fibre channel ordered sets which comprise the fibre channel frame. The Cisco MDS 9000 Family Port Analyzer Adapter, does not capture and decode at the ordered set level.
A Fibre Channel protocol analyzer captures transmitted information from the physical layer of the Fibre Channel network. Because these devices are physically located on the network instead of at a software re-assembly layer like most Ethernet analyzers, Fibre Channel protocol analyzers can monitor data from the 8b/10b level all the way to the embedded upper-layer protocols.
Fibre Channel network devices (HBAs, switches, and storage subsystems) are not able to monitor many SAN behavior patterns. Also, management tools that gather data from these devices are not necessarily aware of problems occurring at the Fibre Channel physical, framing, or SCSI upper layers for a number of reasons.
Fibre Channel devices are specialized for handling and distributing incoming and outgoing data streams. When devices are under maximum loads, which is when problems often occur, the device resources available for error reporting are typically at a minimum and are frequently inadequate for accurate error tracking. Also, Fibre Channel host bus adapters (HBAs) do not provide the ability to capture raw network data.
For these reasons, a protocol analyzer may be more important in troubleshooting a storage network than in a typical Ethernet network. There are a number of common SAN problems that occur in deployed systems and test environments that are visible only with a Fibre Channel analyzer. These include the following:
•
•
•
Using Host Diagnostic Tools
Most host systems provide utilities or other tools that you can use for troubleshooting the connection to the allocated storage. For example, on a Windows system, you can use the Diskmon or Disk Management tool to verify accessibility of the storage and to perform some basic monitoring and administrative tasks on the visible volumes.
Alternatively, you can use Iometer, an I/O subsystem measurement and characterization tool, to generate a simulated load and measure performance. Iometer is a public domain software utility for Windows, originally written by Intel, that provides correlation functionality to assist with performance analysis.
Iometer measures the end-to-end performance of a SAN without cache hits. This can be an important measurement because if write or read requests go to the cache on the controller (a cache hit) rather than to the disk subsystems, performance metrics will be artificially high. You can obtain Iometer from SourceForge.net at the following URL:
http://sourceforge.net/projects/iometer/
Iometer is not the only I/O generator you can use to simulate traffic through the SAN fabric. Other popular I/O generators and benchmark tools used for SAN testing include Iozone and Postmark. Iozone is a file system benchmark tool that generates and measures a variety of file operations. It has been ported to many systems and is useful for performing a broad range of file system tests and analysis.
Postmark was designed to create a large pool of continually changing files, which simulates the transaction rates of a large Internet mail server.
PostMark generates an initial pool of random text files in a configurable range of sizes. Creation of the pool produces statistics on continuous small file creation performance. Once the pool is created, PostMark generates a specified number of transactions, each of which consists of a pair of smaller transactions:
•
•
Benchmarking tools offer a variety of capabilities and you should select the one that provides the best I/O characteristics of your application environment.
Utilities provided by the Sun Solaris operating system let you determine if the remote storage has been recognized and exported to you in form of a raw device or mounted file system, and to issue some basic queries and tests to the storage. You can measure performance and generate loads using the iostat utility, the perfmeter GUI utility, the dd utility, or a third-party utility like Extreme SCSI.
Every UNIX version provides similar utilities, but this guide only provides examples for Solaris. Refer to the documentation for your specific operating system for details.