-
Cisco MDS 9000 Family Troubleshooting Guide, Release 3.x
-
Index
-
New and Changed Information
-
Preface
-
Troubleshooting Overview
-
Troubleshooting Installs, Upgrades, and Reboots
-
Managing Storage Services Modules
-
Troubleshooting Hardware
-
Troubleshooting Mixed Generation Hardware
-
Troubleshooting Licensing
-
Troubleshooting Cisco Fabric Services
-
Troubleshooting Ports
-
Troubleshooting N-Port Virtualization
-
Troubleshooting PortChannels and Trunking
-
Troubleshooting VSANs, Domains, and FSPF
-
Troubleshooting SAN Device Virtualization
-
Troubleshooting IVR
-
Troubleshooting Zones and Zone Sets
-
Troubleshooting Distributed Device Alias Services
-
Troubleshooting FICON
-
Troubleshooting RADIUS and TACACS+
-
Troubleshooting Users and Roles
-
Troubleshooting FC-SP, Port Security, and Fabric Binding
-
Troubleshooting IP Storage Services
-
Troubleshooting IP Access Lists
-
Troubleshooting IPsec
-
Troubleshooting SANTap
-
Troubleshooting Digital Certificates
-
Troubleshooting Call Home
-
Troubleshooting Fabric Manager
-
Before Contacting Technical Support
-
Troublelshooting Tools and Methodology
-
Configuration Limits for Cisco MDS SAN-OS Release 3.x
-
 Feedback
Table Of Contents
Troubleshooting IP Storage Services
Initial Troubleshooting Checklist
Common Troubleshooting Tools in Fabric Manager
Common Troubleshooting Commands in the CLI
Verifying Basic Connectivity Using Device Manager
Verifying Basic Connectivity Using the CLI
Verification of Switch Connectivity
Verifying Switch Connectivity Using Fabric Manager
Verifying Switch Connectivity Using the CLI
Verification of Static IP Routing
Verifying Static IP Routing Using Device Manager
Verifying Static IP Routing Using the CLI
Cannot Assign IP Address to an Interface
One-to-One FCIP Tunnel Creation and Monitoring
Configuring the First Switch with the CLI
Displaying the Default Values Using the CLI
Setting the Static Route for FCIP Tunnels Using the CLI
Debugging the Configuration of the Second Switch Using the CLI
Displaying the Debug Output from FCIP Tunnel Supervisor Using the CLI
Displaying the Debug Output from the FCIP Tunnel IPS Module Using the CLI
Verifying the Configuration of the Profiles Using the CLI
Verifying the Establishment of the FCIP Tunnel Using the CLI
Verifying the Establishment of Default TCP Connections for Each Configured FCIP Tunnel Using the CLI
Verifying the Statistics of the ASIC Chip on Each Gigabit Ethernet Port Using the CLI
Ethereal Screen Captures of the TCP Connection and FCIP Tunnels
One-to-Three FCIP Tunnel Creation and Monitoring
Displaying the Configuration of the First Switch Using the CLI
Creating the FCIP Interface for the Second Tunnel Using the CLI
FCIP Profile Misconfiguration Examples
Displaying Incorrect or Nonexistent IP Address for an FCIP Profile Using the CLI
Displaying Configuration Errors When Bringing Up a Tunnel on a Selected Port Using the CLI
FCIP Interface Misconfiguration Examples
Displaying FCIP Misconfiguration Examples Using the CLI
Displaying the FCIP Interface as Administratively Shut Down Using the CLI
Displaying the Debug Output from the Second Switch Using the CLI
Displaying Passive Mode Set on Both Sides of the FCIP Tunnel with the CLI
Displaying a Time Stamp Acceptable Difference Failure Using the CLI
FCIP Special Frame Tunnel Creation and Monitoring
Configuring and Displaying an FCIP Tunnel with Special Frame Using the CLI
Special Frame Misconfiguration Example
Troubleshooting FCIP Link Flaps
Troubleshooting FCIP ISL Link Failures
Troubleshooting FCIP and Compression
Troubleshooting iSCSI Authentication
Displaying iSCSI Authentication Using Fabric Manager
Displaying iSCSI Authentication Using the CLI
Troubleshooting User Name and Password Configuration
Verifying iSCSI User Account Configuration Using Fabric Manager
Verifying iSCSI User Account Configuration Using the CLI
RADIUS Configuration Troubleshooting
Verifying RADIUS Key and Port for Authentication and Accounting
Troubleshooting RADIUS Routing Configuration
Displaying the Debug Output for RADIUS Authentication Request Routing Using the CLI
Troubleshooting Dynamic iSCSI Configuration
Performing Basic Dynamic iSCSI Troubleshooting
Useful Show Commands to Debug Dynamic iSCSI Configuration
Useful Show Commands to Debug Static iSCSI Configuration
CLI Commands Used to Access Performance Data
Understanding TCP Parameters for iSCSI
Configuring from the Bottom Switch Using the CLI
Verifying Connectivity Between Client and IPS iSCSI Service
Displaying the Gigabit Ethernet Interface
Verifying that the Host Is Configured for High MTU or MSS with the CLI
iSLB Configuration Not Distributed to All Switches in the Fabric
iSCSI Initiator and Virtual Target Configuration Not Distributed
iSLB Configuration, Commit, or Merge Failed—"VSAN ID is Not Yet Configured"
iSLB Configuration, Commit, or Merge Failed—"Failed to Allocate WWN"
iSLB Configuration, Commit, or Merge Failed—"Duplicate WWN Found as..."
iSLB Configuration, Commit, or Merge Failed—"Duplicate Node Name"
iSLB Configuration Failed—"Pending iSLB CFS Config Has Reached Its Limit..."
iSCSI Disable Failed—"Cannot Disable Iscsi - Large Iscsi Config Present..."
Session Down—"pWWN in Use At Remote Switch"
Redirected Session Does Not Come Up
iSLB Zones Not Present in Active Zone Set
Traffic Description After iSLB Commit or Activation of Zone Set
iSLB Zone Set Activation Failed
Resolving an iSLB Merge Failure
Troubleshooting IP Storage Services
This chapter describes how to identify and resolve IP storage services problems that might occur in the Cisco MDS 9000 Family products. It includes the following sections:
•
Initial Troubleshooting Checklist
Overview
Using open-standard, IP-based technology, the Cisco MDS 9000 Family IP Storage (IPS) module enables you to extend the reach of Fibre Channel SANs. The switch can connect separated SAN islands through IP networks using FCIP, and allow IP hosts to access Fibre Channel storage using the iSCSI protocol.
The IPS module allows you to use FCIP and iSCSI features. It supports the full range of features available on other switching modules, including VSANs, security, and traffic management. The IPS module can be used in any Cisco MDS 9000 Family switch and has eight Gigabit Ethernet ports. Each port can run the FCIP and iSCSI protocols simultaneously.
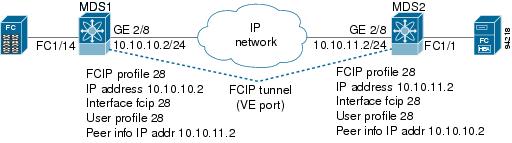
FCIP transports Fibre Channel frames transparently over an IP network between two Cisco MDS 9000 Family switches or other FCIP standards-compliant devices (see Figure 20-1). Using the iSCSI protocol, the IPS module provides IP hosts access to Fibre Channel storage devices. IP host-initiated iSCSI commands are encapsulated in IP, and sent to an MDS 9000 IPS port. There, the commands are routed from the IP network into a Fibre Channel network, and forwarded to the intended target.
Figure 20-1 Connecting MDS 9000 Family Switches Over IP
Note
•
•
iSCSI Restrictions
iSCSI has the following limits in Cisco SAN-OS Release 3.0(1) and later:
•
•
•
•
If more ISCSI sessions try to come up simultaneously on a port, the initiator gets a temporary error and then the initiator retries.
•
iSLB Restrictions
iSLB has the following restrictions in Cisco SAN-OS Release 3.0(1) and later:
•
•
•
•
•
•
•
•
•
•
Initial Troubleshooting Checklist
Begin troubleshooting IP storage services issues by checking the following issues:
Common Troubleshooting Tools in Fabric Manager
Use the following Fabric Manager procedures to access IP interfaces, FCIP, and iSCSI:
•
•
•
Common Troubleshooting Commands in the CLI
Use the following commands to troubleshoot IP interface, FCIP, and iSCSI issues:
•
•
•
•
•
•
Use the following commands to troubleshoot iSLB issues:
•
•
•
•
•
•
•
Use the following commands as directed by your customer support representative to further troubleshoot iSLB issues:
Note
•
•
Use the following commands to troubleshoot the iSLB initiator and initiator target configuration:
•
•
•
•
Use the following commands to troubleshoot iSLB CFS:
•
•
Use the following command to troubleshoot load balancing:
•
Use the following debug commands to gather more information for iSLB:
•
•
•
•
•
•
IP Issues
If you suspect that all or part of your IP connection has failed, you can verify that by performing one or more of the procedures in this section. Using these procedures, you can verify connectivity for IEEE 802.1Q, EtherChannel, and VRRP for iSCSI. This section includes the following topics:
•
•
•
Note
Verifying Basic Connectivity
Use the procedures in this section to verify that you have IP connectivity.
Verifying Basic Connectivity Using Device Manager
To verify basic connectivity using Device Manager, follow these steps:
Step 1
Step 2
Verifying Basic Connectivity Using the CLI
To verify basic connectivity using the CLI, follow these steps:
Step 1
switch# ping 11.18.185.121PING 11.18.185.121 (172.18.185.121): 56 data bytes64 bytes from 11.18.185.121: icmp_seq=0 ttl=128 time=0.3 ms64 bytes from 11.18.185.121: icmp_seq=1 ttl=128 time=0.1 ms64 bytes from 11.18.185.121: icmp_seq=2 ttl=128 time=0.2 ms64 bytes from 11.18.185.121: icmp_seq=3 ttl=128 time=0.2 ms64 bytes from 11.18.185.121: icmp_seq=4 ttl=128 time=0.1 ms64 bytes from 11.18.185.121: icmp_seq=5 ttl=128 time=0.1 ms--- 11.18.185.121 ping statistics ---6 packets transmitted, 6 packets received, 0% packet lossround-trip min/avg/max = 0.1/0.1/0.3 msStep 2
switch# traceroute 11.18.185.121traceroute to 11.18.185.121 (11.18.185.121), 30 hops max, 38 byte packets1 11.18.189.129 (11.18.189.129) 0.413 ms 0.257 ms 0.249 ms2 11.18.0.33 (11.18.0.33) 0.296 ms 0.260 ms 0.258 ms3 11.81.254.69 (11.81.254.69) 0.300 ms 0.273 ms 0.277 ms4 * * *5 * * *Step 3
switch # show ip routeCodes: C - connected, S - staticDefault gateway is 11.18.185.97C 11.18.185.96/27 is directly connected, mgmt0C 11.18.189.128/26 is directly connected, gigabitethernet4/7Step 4
switch# clear ips arp interface gigabitethernet 4/7arp clear successfulStep 5
switch# show ips arp interface gigabitethernet 4/7Protocol Address Age (min) Hardware Addr Type InterfaceInternet 172.18.185.97 0 00:d0:01:3b:38:0a ARPA GigabitEthernet4/7Internet 172.18.189.156 0 00:08:02:b3:45:1b ARPA GigabitEthernet4/7Step 6
GigabitEthernet4/7 is upHardware is GigabitEthernet, address is 0005.3000.9f58Internet address is 172.18.189.137/26MTU 1500 bytes, BW 1000000 KbitPort mode is IPSSpeed is 1 GbpsBeacon is turned off5 minutes input rate 688 bits/sec, 86 bytes/sec, 0 frames/sec5 minutes output rate 312 bits/sec, 39 bytes/sec, 0 frames/sec156643 packets input, 16859832 bytes0 multicast frames, 0 compressed0 input errors, 0 frame, 0 overrun 0 fifo144401 packets output, 7805631 bytes, 0 underruns0 output errors, 0 collisions, 0 fifo0 carrier errors
Verification of Switch Connectivity
Use the procedures in this section to verify connectivity to a destination switch.
Note
Verifying Switch Connectivity Using Fabric Manager
To verify connectivity to a destination switch using Fabric Manager, follow these steps:
Step 1
Step 2
Step 3
Verifying Switch Connectivity Using the CLI
To verify connectivity to a destination switch using the CLI, follow these steps:
Step 1
switch# show fcdomain domain-list vsan 200
Number of domains: 7
Domain ID WWN
--------- -----------------------
0x01(1) 20:c8:00:05:30:00:59:df [Principal]
0x02(2) 20:c8:00:0b:5f:d5:9f:c1
0x6f(111) 20:c8:00:05:30:00:60:df
0xda(218) 20:c8:00:05:30:00:87:9f [Local]
0x06(6) 20:c8:00:0b:46:79:f2:41
0x04(4) 20:c8:00:05:30:00:86:5f
0x6a(106) 20:c8:00:05:30:00:f8:e3
Step 2
Step 3
switch# fcping fcid 0xFFFCDA vsan 200
28 bytes from 0xFFFCDA time = 298 usec
28 bytes from 0xFFFCDA time = 260 usec
28 bytes from 0xFFFCDA time = 298 usec
28 bytes from 0xFFFCDA time = 294 usec
28 bytes from 0xFFFCDA time = 292 usec
5 frames sent, 5 frames received, 0 timeouts
Round-trip min/avg/max = 260/288/298 usec
Verification of Static IP Routing
Use the procedures in this section to verify static IP routing.
Verifying Static IP Routing Using Device Manager
Choose IP > Routes in Device Manager to verify the static IP routes.
Verifying Static IP Routing Using the CLI
To verify static IP routes using the CLI, follow these steps:
Step 1
switch# show ip route configDestination Gateway Mask Metric Interfacedefault 172.17.8.1 0.0.0.0 0 mgmt011.2.36.0 11.3.36.1 255.255.252.0 011.2.56.0 11.3.56.1 255.255.252.0 011.3.36.0 0.0.0.0 255.255.252.0 0 GigabitEthernet8/711.3.56.0 0.0.0.0 255.255.252.0 0 GigabitEthernet8/8172.17.8.0 0.0.0.0 255.255.255.0 0 mgmt0Step 2
switch# show ip routeCodes: C - connected, S - staticDefault gateway is 172.17.8.1C 172.17.8.0/24 is directly connected, mgmt0S 11.2.36.0/22 via 11.3.36.1, gigabitethernet8/7C 11.3.36.0/22 is directly connected, gigabitethernet8/7C 11.3.56.0/22 is directly connected, gigabitethernet8/8S 11.2.56.0/22 via 11.3.56.1, gigabitethernet8/8
Cannot Assign IP Address to an Interface
You may encounter a problem when assigning an IP address to an interface. If that IP address is already in use by another interface (for example, a remote VRRP interface), you may see the following message:
Invalid configuration: this IP address overlaps with another interface in network
You can recover from this problem by using the shutdown CLI command on that VRRP interface, programming the IP address, and then using the no shutdown CLI command on that VRRP interface.
FCIP Issues
This section contains information on troubleshooting FCIP tunnels with and without special frames and includes the following topics:
•
•
•
•
•
•
•
•
•
Note
One-to-One FCIP Tunnel Creation and Monitoring
This section describes the configuration for one-to-one FCIP tunnel with FCIP debug activated (MDS2) and without debug activated (MDS1). Figure 20-2 shows the one-to-one topology used for configuration.
Figure 20-2 One-to-One Topology
Configuring the First Switch with the CLI
To configure the first switch using the CLI, follow these steps:
Step 1
Step 2
MDS1(config)# interface gigabitethernet 2/8Step 3
MDS1(config-if)#ip address 10.10.10.2 255.255.255.0Step 4
MDS1(config-if)# no shutdownStep 5
MDS1(config)# fcip profile 28The profile number can be any number between 1 - 255
Step 6
MDS1(config-profile)# ip address 10.10.10.2Step 7
MDS1(config-profile)# exitStep 8
MDS1(config)# interface fcip 28The interface FCIP can be any number between 1 - 255 and does not need to be the same as the profile number. In this example the same number is used for simplicity.
Step 9
MDS1(config-if)# use-profile 28The FCIP interface will use the local FCIP profile. The FCIP profile binds the FCIP interface to the physical Gigabit Ethernet port and configures the TCP settings used by the FCIP interface.
MDS1(config-if)# peer-info ipaddr 10.10.11.2The IP address in this example indicates the remote endpoint IP address of the FCIP tunnel.
MDS1(config-if)# no shutdownMDS1(config-if)# end
Displaying the Default Values Using the CLI
The following example displays the default values from the show running-config command.
MDS1# show running-configBuilding Configuration ...fcip profile 28ip address 10.10.10.2port 3225tcp keepalive-timeout 60tcp max-retransmissions 4tcp pmtu-enable reset-timeout 3600tcp initial-retransmit-time 100tcp window-size 64vsan databasevsan 2 name grumpy_02interface fcip28no shutdownuse-profile 28peer-info ipaddr 10.10.11.2ip route 10.10.11.0 255.255.255.0 10.10.10.1Setting the Static Route for FCIP Tunnels Using the CLI
The static route must be set for FCIP tunnels. This route could also be ip route 10.10.11.0 255.255.255.0 interface gigabitethernet 2/8.
ips heartbeatips hapresetips bootinterface GigabitEthernet2/8ip address 10.10.10.2 255.255.255.0(This is the IP address used by the FCIP profile.)
no shutdownDebugging the Configuration of the Second Switch Using the CLI
The following example shows the configuration of a switch (MDS2) with debug mode activated. To activate debug mode for this situation, run the debug ips flow fcip command on a separate terminal.
MDS2(config)# fcip profile 28Mar 10 21:41:04 ips: Dequeued mts msg MTS_OPC_IPS_FCIP_CMI_REQUEST(mts opc 3321, msg id 32222)Mar 10 21:41:04 ips: Create Entity 28Mar 10 21:41:04 ips: entity28: add to config pssMDS2(config-profile)# ip address 10.10.11.2Mar 10 21:41:15 ips: Dequeued mts msg MTS_OPC_IPS_FCIP_CMI_REQUEST(mts opc 3321, msg id 32258)Mar 10 21:41:15 ips: entity28: IP address changed to 10.10.11.2Mar 10 21:41:15 ips: entity28: IP 10.10.11.2 configured for interface GigabitEthernet2/8Mar 10 21:41:15 ips: entity28: Apply the entity config and save to config pssMar 10 21:41:15 ips: entity28: add to config pssMDS2(config-profile)# exitMDS2(config)# interface fcip 28Mar 10 21:41:46 ips: Dequeued mts msg MTS_OPC_IPS_FCIP_CMI_REQUEST(mts opc 3321, msg id 32358)Mar 10 21:41:46 ips: Verified FCIP28 Create:0Mar 10 21:41:46 ips: FCIP28: Verified Create:0Mar 10 21:41:46 ips: Dequeued mts msg MTS_OPC_IPS_FCIP_CMI_REQUEST(mts opc 3321, msg id 32360)Mar 10 21:41:46 ips: FCIP28: Creating FCIP tunnelMar 10 21:41:46 ips: FCIP28: add to admin pssMar 10 21:41:46 ips: FCIP28: add to run-time pssMar 10 21:41:46 ips: FCIP28: log: 0 phy: 0 state: 0 syslog: 0MDS2(config-if)# use-profile 28Mar 10 21:42:23 ips: Dequeued mts msg MTS_OPC_IPS_FCIP_CMI_REQUEST(mts opc 3321, msg id 32480)Mar 10 21:42:23 ips: FCIP28: Process tunnel configuration eventMar 10 21:42:23 ips: FCIP28: Change Entity-id from 0 to 28Mar 10 21:42:23 ips: FCIP: Optimal IF lookup for GigabitEthernet2/8 is GigabitEthernet2/8Mar 10 21:42:23 ips: FCIP28: bind with GigabitEthernet2/8 (phy GigabitEthernet2/8)Mar 10 21:42:23 ips: FCIP28: Queueing bind tunnel to src if event to tunnel FSM resource: 0Mar 10 21:42:23 ips: Locked fcip_if_fsm for MTS_OPC_IPS_FCIP_CMI_REQUEST(msg id 32480)Mar 10 21:42:23 ips: FCIP28: Send bind for GigabitEthernet2/8 to PM (phy GigabitEthernet2/8)Mar 10 21:42:23 ips: FCIP28: add to run-time pssMar 10 21:42:23 ips: FCIP28: log: 2087000 phy: 2087000 state: 0 syslog: 0Mar 10 21:42:23 ips: Dequeued mts msg MTS_OPC_IPS_CFG_FCIP_IF(mts opc 1905, msg id 7304)Mar 10 21:42:23 ips: Hndlr MTS_OPC_IPS_CFG_FCIP_IF (mts_opc 1905 msg_id 7304)Mar 10 21:42:23 ips: FCIP28: Got a tunnel param pull request from LCMar 10 21:42:23 ips: Added to pending queue event-id [29] event-cat [2]Mar 10 21:42:23 ips: FCIP28: Queueing Process a Pull Request event to Pending queue resource: 0Mar 10 21:42:23 ips: Dequeued mts msg MTS_OPC_PM_FCIP_BIND(mts opc 335, msg id 32495)Mar 10 21:42:23 ips: Hndlr MTS_OPC_PM_FCIP_BIND (mts_opc 335 msg_id 32495)Mar 10 21:42:23 ips: FCIP28: Success received from PM for bind to GigabitEthernet2/8 (phy GigabitEthernet2/8)Mar 10 21:42:23 ips: FCIP28: Bind-resp event processing bind...Mar 10 21:42:23 ips: FCIP28: add to run-time pssMar 10 21:42:23 ips: FCIP28: log: 2087000 phy: 2087000 state: 1 syslog: 0Mar 10 21:42:23 ips: FCIP28: Last reference....Mar 10 21:42:23 ips: FCIP28: Update the tunnel param and save to PSSMar 10 21:42:23 ips: FCIP28: add to admin pssMar 10 21:42:23 ips: FCIP28: add to run-time pssMar 10 21:42:23 ips: FCIP28: log: 2087000 phy: 2087000 state: 1 syslog: 0Mar 10 21:42:23 ips: Unlocked fcip_if_fsm for MTS_OPC_IPS_FCIP_CMI_REQUEST(msg id 32480)Mar 10 21:42:23 ips: Dequeued pending queue msg event_id [29] cat [2]Mar 10 21:42:23 ips: (ips_demux) Mts Opcode is 1905, id is 7304Mar 10 21:42:23 ips: FCIP28: Processing Pull Config RequestMar 10 21:42:23 ips: FCIP28: Bound to entity 28 port: 3225 ip: 10.10.11.2MDS2(config-if)# peer-info ipaddr 10.10.10.2Mar 10 21:43:01 ips: Dequeued mts msg MTS_OPC_IPS_FCIP_CMI_REQUEST(mts opc 3321, msg id 32616)Mar 10 21:43:01 ips: FCIP28: Process tunnel configuration eventMar 10 21:43:01 ips: FCIP28: Change Peer IP from 0.0.0.0 to 10.10.10.2 and port from 3225 to 3225Mar 10 21:43:01 ips: FCIP28: Queueing Set tunnel param event to tunnel FSM resource: 0Mar 10 21:43:01 ips: Locked fcip_if_fsm for MTS_OPC_IPS_FCIP_CMI_REQUEST(msg id 32616)Mar 10 21:43:01 ips: FCIP28: Send tunnel params to LC to DPP: 7Mar 10 21:43:01 ips: Dequeued mts msg MTS_OPC_IPS_FCIP_SET_LC_TUNNEL_PARAM(mts opc 1897, msg id 7358)Mar 10 21:43:01 ips: Hndlr MTS_OPC_IPS_FCIP_SET_LC_TUNNEL_PARAM (mts_opc 1897 msg_id 7358)Mar 10 21:43:01 ips: In handler : Received resp code: 0Mar 10 21:43:01 ips: FCIP28: Received the tunnel params from LCMar 10 21:43:01 ips: FCIP28: Update the tunnel param and save to PSSMar 10 21:43:01 ips: FCIP28: add to admin pssMar 10 21:43:01 ips: FCIP28: add to run-time pssMar 10 21:43:01 ips: FCIP28: log: 2087000 phy: 2087000 state: 1 syslog: 0Mar 10 21:43:01 ips: Unlocked fcip_if_fsm for MTS_OPC_IPS_FCIP_CMI_REQUEST(msg id 32616)MDS2(config-if)#MDS2(config-if)# no shutdownMDS2(config-if)# Mar 10 21:43:32 ips: Dequeued mts msg MTS_OPC_PM_LOGICAL_PORT_STATE_CHANGE_RANGE(mts opc 3114, msg id 32737)Mar 10 21:43:32 ips: Hndlr MTS_OPC_PM_LOGICAL_PORT_STATE_CHANGE_RANGE (mts_opc 3114 msg_id 32737)Mar 10 21:43:32 ips: Dequeued mts msg MTS_OPC_PM_LOGICAL_PORT_STATE_CHANGE_RANGE(mts opc 3114, msg id 32778)Mar 10 21:43:32 ips: Hndlr MTS_OPC_PM_LOGICAL_PORT_STATE_CHANGE_RANGE (mts_opc 3114 msg_id 32778)Mar 10 21:43:32 ips: Dequeued mts msg MTS_OPC_PM_LOGICAL_PORT_STATE_CHANGE_RANGE(mts opc 3114, msg id 32783)Mar 10 21:43:32 ips: Hndlr MTS_OPC_PM_LOGICAL_PORT_STATE_CHANGE_RANGE (mts_opc 3114 msg_id 32783)Displaying the Debug Output from FCIP Tunnel Supervisor Using the CLI
The following example shows the debug output from the supervisor of the FCIP tunnel.
MDS2(config)# interface fcip 28MDS2(config-if)# no shutdownMDS2(config-if)# Mar 10 22:59:46 ips: fu_priority_select: - setting fd[3] for select call - found data in FU_PSEL_Q_CAT_MTS queue, fd(3), usr_q_info(1)Mar 10 22:59:46 ips: fu_priority_select_select_queue: round credit(0)Mar 10 22:59:46 ips: curr_q - FU_PSEL_Q_CAT_CQ, usr_q_info(3), priority(4), credit(0), emptyMar 10 22:59:46 ips: Starting a new roundMar 10 22:59:46 ips: fu_priority_select: returning FU_PSEL_Q_CAT_MTS queue, fd(3), usr_q_info(1)Mar 10 22:59:46 ips: Dequeued mts msg MTS_OPC_PM_LOGICAL_PORT_STATE_CHANGE_RANGE(mts opc 3114, msg id 47540)Mar 10 22:59:46 ips: ips_mts_hdlr_pm_logical_port_state_change_range:Mar 10 22:59:46 ips: Hndlr MTS_OPC_PM_LOGICAL_PORT_STATE_CHANGE_RANGE (mts_opc 3114 msg_id 47540)Mar 10 22:59:46 ips: fu_fsm_execute_all: match_msg_id(0), log_already_open(0)Mar 10 22:59:46 ips: fu_fsm_execute_all: null fsm_event_listMar 10 22:59:46 ips: fu_fsm_engine: mts msg MTS_OPC_PM_LOGICAL_PORT_STATE_CHANGE_RANGE(msg_id 47540) droppedMar 10 22:59:46 ips: fu_priority_select: - setting fd[3] for select call - found data in FU_PSEL_Q_CAT_MTS queue, fd(3), usr_q_info(1)Mar 10 22:59:46 ips: fu_priority_select_select_queue: round credit(6)Mar 10 22:59:46 ips: curr_q - FU_PSEL_Q_CAT_CQ, usr_q_info(3), priority(4), credit(3), emptyMar 10 22:59:46 ips: fu_priority_select: returning FU_PSEL_Q_CAT_MTS queue, fd(3), usr_q_info(1)Mar 10 22:59:46 ips: Dequeued mts msg MTS_OPC_PM_LOGICAL_PORT_STATE_CHANGE_RANGE(mts opc 3114, msg id 47589)Mar 10 22:59:46 ips: ips_mts_hdlr_pm_logical_port_state_change_range:Mar 10 22:59:46 ips: Hndlr MTS_OPC_PM_LOGICAL_PORT_STATE_CHANGE_RANGE (mts_opc 3114 msg_id 47589)Mar 10 22:59:46 ips: fu_fsm_execute_all: match_msg_id(0), log_already_open(0)Mar 10 22:59:46 ips: fu_fsm_execute_all: null fsm_event_listMar 10 22:59:46 ips: fu_fsm_engine: mts msg MTS_OPC_PM_LOGICAL_PORT_STATE_CHANGE_RANGE(msg_id 47589) droppedMar 10 22:59:46 ips: fu_priority_select: - setting fd[3] for select call - found data in FU_PSEL_Q_CAT_MTS queue, fd(3), usr_q_info(1)Mar 10 22:59:46 ips: fu_priority_select_select_queue: round credit(4)Mar 10 22:59:46 ips: curr_q - FU_PSEL_Q_CAT_CQ, usr_q_info(3), priority(4), credit(2), emptyMar 10 22:59:46 ips: fu_priority_select: returning FU_PSEL_Q_CAT_MTS queue, fd(3), usr_q_info(1)Mar 10 22:59:46 ips: Dequeued mts msg MTS_OPC_PM_LOGICAL_PORT_STATE_CHANGE_RANGE(mts opc 3114, msg id 47602)Mar 10 22:59:46 ips: ips_mts_hdlr_pm_logical_port_state_change_range:Mar 10 22:59:46 ips: Hndlr MTS_OPC_PM_LOGICAL_PORT_STATE_CHANGE_RANGE (mts_opc 3114 msg_id 47602)Mar 10 22:59:46 ips: fu_fsm_execute_all: match_msg_id(0), log_already_open(0)Mar 10 22:59:46 ips: fu_fsm_execute_all: null fsm_event_listMar 10 22:59:46 ips: fu_fsm_engine: mts msg MTS_OPC_PM_LOGICAL_PORT_STATE_CHANGE_RANGE(msg_id 47602) droppedDisplaying the Debug Output from the FCIP Tunnel IPS Module Using the CLI
The following example shows the debug output from the IPS module of the FCIP tunnel.
MDS2# attach module 2module-2# debug ips fcip fsm port 8(This is the Gigabit Ethernet port 2/8.)
Mar 13 19:18:19  port8: 2700:FCIP28: Received new TCP connection from peer:
10.10.10.2:65455
Mar 13 19:18:19 port8: 2701:FCIP: (fcip_de_create): DE = 0xdc02ca40Mar 13 19:18:19 port8: 2702:FCIP28: Create a DE 0xdc02ca40 for this tunnelMar 13 19:18:19 port8: 2703:FCIP28: Bind the DE 0xdc02ca40 [1] to tunnel LEP 0x801ebac0Mar 13 19:18:19 port8: 2704:FCIP28: Bind DE 1 to TCP-hdl 0xdc489800Mar 13 19:18:19 port8: 2705:FCIP28: Bind DE 1 to eport 0x801eaaa0Mar 13 19:18:19 port8: 2706:FCIP28: bind de 1 in eport 0x801eaaa0, hash = 1 num-conn: 2Mar 13 19:18:19 port8: 2707:FCIP28: Received new TCP connection from peer: 10.10.10.2:65453Mar 13 19:18:19 port8: 2708:FCIP: (fcip_de_create): DE = 0xdc02cb40Mar 13 19:18:19 port8: 2709:FCIP28: Create a DE 0xdc02cb40 for this tunnelMar 13 19:18:19 port8: 2710:FCIP28: Bind the DE 0xdc02cb40 [2] to tunnel LEP 0x801ebac0Mar 13 19:18:19 port8: 2711:FCIP28: Bind DE 2 to TCP-hdl 0xdc488800Mar 13 19:18:19 port8: 2712:FCIP28: Bind DE 2 to eport 0x801eaaa0Mar 13 19:18:19 port8: 2713:FCIP28: bind de 2 in eport 0x801eaaa0, hash = 2 num-conn: 2Mar 13 19:18:19 port8: 2714:FCIP28: Send LINK UP to SUPMar 13 19:18:20 port8: 2715:FCIP28: *** Received eisl frame in E modeMar 13 19:18:20 port8: 2716:FCIP28: SUP-> Set trunk mode: 2Mar 13 19:18:20 port8: 2717:FCIP28: Change the operational mode to TRUNKMar 13 19:18:20 port8: 2718:FCIP28: Tunnel bringup debounce timer callbeck, try to bring up tunnelMar 13 19:18:20 port8: 2719:FCIP28: Tunnel is already in oper UP state, don't try to bring up again...Verifying the Configuration of the Profiles Using the CLI
Use the show fcip profile command to verify that the configuration of the profiles are correct. The IP address and TCP port are the ports to listen on, and both are adjustable in the FCIP profile. Thefollowing example displays all the default values that are adjustable while configuring the FCIP profile.
MDS1# show fcip profile-------------------------------------------------------------------------------ProfileId Ipaddr TcpPort-------------------------------------------------------------------------------28 10.10.10.2 3225MDS1# show fcip profile 28FCIP Profile 28Listen Port is 3225TCP parametersSACK is disabledPMTU discover is enabled, reset timeout is 3600 secKeep alive is 60 secMinimum retransmission timeout is 100 msMaximum number of re-transmissions is 4Advertised window size is 64 KBVerifying the Establishment of the FCIP Tunnel Using the CLI
Use the show interface fcip command to verify that the FCIP tunnel is established and that traffic is passing through.
MDS1# show interface fcip 28FCIP28 is trunkingHardware is GigabitEthernetPort WWN is 20:5e:00:05:30:00:59:dePeer port WWN is 20:5e:00:0b:5f:d5:9f:c0Admin port mode is auto, trunk mode is onPort mode is TE(The FCIP tunnel will be either E (ISL or TE (EISL) passing through multiple VSANs.)
vsan is 1Trunk vsans (allowed active) (1-2)Trunk vsans (operational) (1-2)Trunk vsans (up) (1-2)Trunk vsans (isolated) ()Trunk vsans (initializing) ()Using Profile id 28 (interface GigabitEthernet2/8)(This is the FCIP profile and the Gigabit Ethernet being used by the FCIP tunnel.)
Peer InformationPeer Internet address is 10.10.11.2 and port is 3225(This is the remote endpoint's IP address and listening port.)
Special Frame is disabled(The special frame for verification of a remote MDS is not being used.)
Maximum number of TCPconnections is 2(The default is 2 TCP connections being used, one for class F and the other for class 2 and 3.)
Time Stamp is disabled(The time stamp can be activated under the FCIP interface.)
B-port mode disabledTCP Connection Information2 Active TCP connectionsControl connection: Local 10.10.10.2:3225, Remote 10.10.11.2:65519(The above is class F traffic.)
Data connection: Local 10.10.10.2:3225, Remote 10.10.11.2:65521(This is class 2,3 traffic.)
6 Attempts for active connections, 3 close of connectionsTCP ParametersPath MTU 1500 bytesCurrent retransmission timeout is 100 ms <<< Default, adjusted underRound trip time: Smoothed 10 ms, Variance: 5(This is the calculated round trip time of the FCIP tunnel. Large round trip times will require increasing the TCP window size under the FCIP profile.)
Advertized window: Current: 64 KB, Maximum: 64 KB, Scale: 1(This is the local advertised TCP window size, and the default is 64 KB.)
Peer receive window: Current: 64 KB, Maximum: 64 KB, Scale: 1(This is the remote endpoint advertised TCP window size.)
Congestion window: Current: 2 KB(This is the minimum window size used during congestion, and it is not configurable.)
5 minutes input rate 136 bits/sec, 17 bytes/sec, 0 frames/sec5 minutes output rate 136 bits/sec, 17 bytes/sec, 0 frames/sec2288 frames input, 211504 bytes2288 Class F frames input, 211504 bytes0 Class 2/3 frames input, 0 bytes0 Error frames2288 frames output, 211520 bytes2288 Class F frames output, 211520 bytes0 Class 2/3 frames output, 0 bytes0 Error frames 0 reass framesMDS1# show interface fcip 28 brief-------------------------------------------------------------------------------Interface Vsan Admin Admin Status Oper Profile Port-channelMode Trunk ModeMode-------------------------------------------------------------------------------fcip28 1 auto on trunking TE 28 --MDS1# show interface fcip 28 counters brief-------------------------------------------------------------------------------Interface Input (rate is 5 min avg) Output (rate is 5 min avg)----------------------------- -----------------------------Rate Total Rate TotalMbits/s Frames Mbits/s Frames-------------------------------------------------------------------------------fcip28 18 0 18 0(These are the frames that averaged over 5 minutes and the total count of frames since the last clear counters command was issued, or since the last tunnel up.)
Verifying the Establishment of Default TCP Connections for Each Configured FCIP Tunnel Using the CLI
Verify that two default TCP connections are established for each FCIP tunnel configured, one for control traffic and one for data traffic.
MDS1# show ips stats tcp interface gigabitethernet 2/8TCP Statistics for port GigabitEthernet2/8Connection Stats6 active openings, 8 accepts6 failed attempts, 0 reset received, 8 establishedSegment stats295930 received, 1131824 sent, 109 retransmitted(Excessive retransmits indicate possible core drops and/or that the TCP window size should be adjusted.)
0 bad segments received, 0 reset sentTCP Active ConnectionsLocal Address Remote Address State Send-Q Recv-Q10.10.10.2:3225 10.10.11.2:65519 ESTABLISH 0 0(This is used for F control traffic only.)
10.10.10.2:3225 10.10.11.2:65521 ESTABLISH 87568 0(Send-Q increasing during read-only test.)
10.10.10.2:3225 0.0.0.0:0 LISTEN 0 0(The TCP listen port is ready for new TCP connections.)
You can use the following command to verify that traffic is incrementing on the Gigabit Ethernet port of the FCIP tunnel.
MDS1# show ips stats mac interface gigabitethernet 2/8Ethernet MAC statistics for port GigabitEthernet2/8Hardware Transmit Counters1074898 frame 1095772436 bytes0 collisions, 0 late collisions, 0 excess collisions0 bad frames, 0 FCS error, 0 abort, 0 runt, 0 oversizeHardware Receive Counters33488196 bytes, 298392 frames, 277 multicasts, 16423 broadcasts0 bad, 0 runt, 0 CRC error, 0 length error0 code error, 0 align error, 0 oversize errorSoftware Counters298392 received frames, 1074898 transmit frames0 frames soft queued, 0 current queue, 0 max queue0 dropped, 0 low memoryVerifying the Statistics of the ASIC Chip on Each Gigabit Ethernet Port Using the CLI
Traffic statistics can be verified on the internal ASIC chip on each Gigabit Ethernet port.
MDS1# show ips stats flamingo interface gigabitethernet 2/8Flamingo ASIC Statistics for port GigabitEthernet2/8Hardware Egress Counters2312 Good, 0 bad protocol, 0 bad header cksum, 0 bad FC CRC(Good frames and CRC error frames can be monitored.)
Hardware Ingress Counters(Verify good increments on the active tunnel.)
2312 Good, 0 protocol error, 0 header checksum error0 FC CRC error, 0 iSCSI CRC error, 0 parity errorSoftware Egress Counters2312 good frames, 0 bad header cksum, 0 bad FIFO SOP0 parity error, 0 FC CRC error, 0 timestamp expired error0 unregistered port index, 0 unknown internal type0 RDL, 0 RDL too big RDL, 0 TDL ttl_13957292257 idle poll count, 0 loopback, 0 FCC PQ, 0 FCC EQFlow Control: 0 [0], 0 [1], 0 [2], 0 [3]Software Ingress Counters2312 Good frames, 0 header cksum error, 0 FC CRC error0 iSCSI CRC error, 0 descriptor SOP error, 0 parity error0 frames soft queued, 0 current Q, 0 max Q, 0 low memory0 out of memory drop, 0 queue full drop0 RDL, 0 too big RDL dropFlow Control: 0 [0], 0 [1], 0 [2], 0 [3]Ethereal Screen Captures of the TCP Connection and FCIP Tunnels
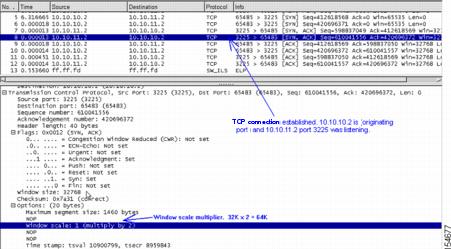
Figure 20-3, Figure 20-4, and Figure 20-5 are screen captures taken with Ethereal of TCP connections being established, and of FCIP tunnels. Note that FCIP tunnel activation is the same as an FC EISL becoming active (such as ELP, ESC, and EFP). The following traces were captured after configuration on both MDS 9000 Family switches, and the last no shutdown was entered on switch MDS1. All settings are default (for example, SACK is disabled, and the TCP window is set to 64K).
Figure 20-3 First Capture of TCP Connection
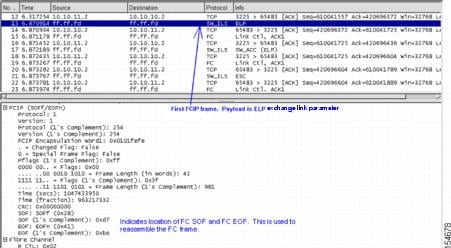
Figure 20-4 shows more of the trace, with frame 13 being the first FCIP frame. This frame carries the FC Standard ELP.
Figure 20-4 Second Capture of TCP Connection
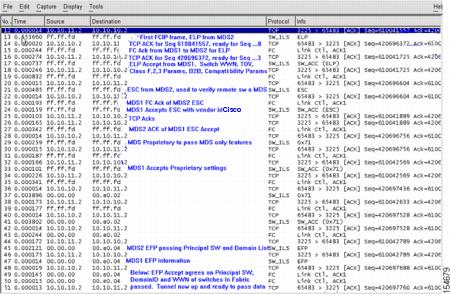
Figure 20-5 shows the FC portion of the EISL initialization over the FCIP tunnel.
Figure 20-5 Third Capture of TCP Connection
One-to-Three FCIP Tunnel Creation and Monitoring
Figure 20-6 shows the configuration of switch MDS1 for three tunnels from one Gigabit Ethernet port.
Figure 20-6 MDS1 Configured for Three FCIP Tunnels
Displaying the Configuration of the First Switch Using the CLI
The following example shows the configuration of switch MDS1 for three tunnels from one Gigabit Ethernet port.
MDS1(config)# fcip profile 21MDS1(config-profile)# ip address 10.10.10.2MDS1(config-profile)# exitMDS1(config)# interface fcip 21MDS1(config-if)# use-profile 21MDS1(config-if)# peer-info ipaddr 10.10.11.2MDS1(config-if)# no shutdownMDS1(config-if)# exitMDS1(config)# ip route 10.10.11.0 255.255.255.0 10.10.10.1MDS1(config)# ip route 10.10.11.0 255.255.255.0 interface gigabitethernet 2/1Creating the FCIP Interface for the Second Tunnel Using the CLI
Now the interface FCIP is created for the second tunnel. The same FCIP profile is used for this example. A separate FCIP profile can be used for each FCIP interface if desired.
MDS1(config-if)#MDS1(config-if)# interface fcip 23MDS1(config-if)# use-profile 21MDS1(config-if)# peer-info ipaddr 10.10.8.2MDS1(config-if)# no shutdownMDS1(config-if)# exitMDS1(config)#Now the FCIP interface is created for the third tunnel.
MDS1(config)# interface fcip 28MDS1(config-if)# use-profile 21MDS1(config-if)# peer-info ipaddr 10.10.7.2MDS1(config-if)# no shutMDS1(config-if)# endMDS1(config)#FCIP Profile Misconfiguration Examples
The examples in this section show FCIP profile misconfigurations.
Displaying Incorrect or Nonexistent IP Address for an FCIP Profile Using the CLI
MDS22(config)# fcip profile 21MDS22(config-profile)# ip addr 1.1.1.1MDS22(config-profile)# ip addr 34.34.34.34MDS22(config-profile)# exitMDS22(config)# exitMDS22# show fcip profile 21FCIP Profile 21Internet Address is 34.34.34.34(In this line, the interface Gigabit Ethernet port is not shown. This means the IP address is not assigned a Gigabit Ethernet port.
Listen Port is 3225TCP parametersSACK is disabledPMTU discover is enabled, reset timeout is 3600 secKeep alive is 60 secMinimum retransmission timeout is 300 msMaximum number of re-transmissions is 4Advertised window size is 64 KBMDS22# config tEnter configuration commands, one per line. End with CNTL/Z.MDS22(config)# interface gigabitethernet 2/5MDS22(config-if)# ip addr 34.34.34.34 255.255.255.0MDS22(config-if)# no shutdownMDS22(config-if)# endMDS22# show fcip profile 34error: fcip profile not foundMDS22# show fcip profile 21FCIP Profile 21Internet Address is 34.34.34.34 (interface GigabitEthernet2/5)(In this line, the Gigabit Ethernet port is now shown and the FCIP profile is bound to a physical port.)
Listen Port is 3225TCP parametersSACK is disabledPMTU discover is enabled, reset timeout is 3600 secKeep alive is 60 secMinimum retransmission timeout is 300 msMaximum number of re-transmissions is 4Advertised window size is 64 KBThe following example shows a configuration error when using multiple FCIP profiles on one physical Gigabit Ethernet port.MDS2(config)# fcip profile 21MDS2(config-profile)# ip address 10.10.11.2error: fcip another profile exists with same port & ip(Multiple FCIP profiles can be used on one physical Gigabit Ethernet port, but each profile must have a different listening port.)
MDS2(config-profile)# port 32(Change the TCP listen port on the profile. The default is 3225.)
MDS2(config-profile)# ip address 10.10.11.2(The IP address for the Gigabit Ethernet port 2/1 is now accepted, and two FCIP profiles are using the same Gigabit Ethernet port.)
MDS2(config-profile)# endMDS2# show fcip profile 21FCIP Profile 21Internet Address is 10.10.11.2 (interface GigabitEthernet2/1)Listen Port is 32(This is a new TCP listen port.)
TCP parametersSACK is disabledPMTU discover is enabled, reset timeout is 3600 secKeep alive is 60 secMinimum retransmission timeout is 300 msMaximum number of re-transmissions is 4Advertised window size is 64 KBMDS2# show fcip profile 28FCIP Profile 28Internet Address is 10.10.11.2 (interface GigabitEthernet2/1)Listen Port is 3225(This is the default listen port.)
TCP parametersSACK is disabledPMTU discover is enabled, reset timeout is 3600 secKeep alive is 60 secMinimum retransmission timeout is 300 msMaximum number of re-transmissions is 4Advertised window size is 64 KBDisplaying Configuration Errors When Bringing Up a Tunnel on a Selected Port Using the CLI
The following example shows a configuration error when bringing a tunnel up on the selected port. This could be either an FCIP profile issue or an FCIP interface issue. Both sides must be configured correctly.
MDS2(config)# fcip profile 21MDS2(config-profile)# port 13(Change the TCP listen port on switch MDS2.)
MDS2(config-profile)# endMDS2(config)# interface fcip 21MDS2(config-if)# passive-mode(Put interface fcip 21 in passive mode to guarantee MDS1 initiates a TCP connection.)
module-2# debug ips fcip fsm port 1module-2# Mar 14 23:08:02 port1: 863:FCIP21: SUP-> Set Port mode 1Mar 14 23:08:02 port1: 864:FCIP21: SUP-> Port VSAN (1) already set to same valueMar 14 23:08:02 port1: 865:FCIP21: SUP-> Trunk mode (1) already set to same valueMar 14 23:08:02 port1: 866:FCIP21: SUP-> Enable tunnel ADMIN UPMar 14 23:08:02 port1: 867:FCIP21: Try to Bring UP the TunnelMar 14 23:08:02 port1: 868:FCIP21: Start TCP listener with peer: 10.10.10.2:13(This debug output from switch MDS2 shows that the FCIP tunnel will not come up because switch MDS2 is listening on port 13, and switch MDS1 is trying to establish the connection on the default port 3225.)
Mar 14 23:08:02 port1: 869:FCIP: Create a new listener object for 10.10.11.2:13Mar 14 23:08:02 port1: 870:FCIP: Create FCIP Listener with local info: 10.10.11.2:13MDS1(config)# interface fcip 21MDS1(config-if)# peer-info ip 10.10.11.2 port 13(The remote end FCIP interface must be configured to establish a TCP connection on a port that is being used as a TCP listen port.)
MDS1(config-if)# endMDS1# show interface fcip 21fcip21 is trunking(The FCIP tunnel is now up.)
Hardware is GigabitEthernetPort WWN is 20:42:00:05:30:00:59:dePeer port WWN is 20:42:00:0b:5f:d5:9f:c0Admin port mode is auto, trunk mode is onPort mode is TEvsan is 1Trunk vsans (allowed active) (1-2)Trunk vsans (operational) (1-2)Trunk vsans (up) ()Trunk vsans (isolated) ()Trunk vsans (initializing) (1-2)Using Profile id 21 (interface GigabitEthernet2/1)Peer InformationPeer Internet address is 10.10.11.2 and port is 13Special Frame is disabledMaximum number of TCP connections is 2Time Stamp is disabledB-port mode disabledTCP Connection Information2 Active TCP connectionsControl connection: Local 10.10.10.2:65188, Remote 10.10.11.2:13(The port is 13 as configured.)
Data connection: Local 10.10.10.2:65190, Remote 10.10.11.2:13174 Attempts for active connections, 5 close of connectionsMDS2# show ips stats tcp interface gigabitethernet 2/1TCP Statistics for port GigabitEthernet2/1Connection Stats44 active openings, 2 accepts26 failed attempts, 0 reset received, 20 establishedSegment stats2515 received, 2342 sent, 0 retransmitted0 bad segments received, 0 reset sentTCP Active ConnectionsLocal Address Remote Address State Send-Q Recv-Q10.10.11.2:13 10.10.10.2:65188 ESTABLISH 0 0(The port is 13 as configured.)
10.10.11.2:13 10.10.10.2:65190 ESTABLISH 0 0(The port is 13 as configured.)
10.10.11.2:13 0.0.0.0:0 LISTEN 0 00.0.0.0:3260 0.0.0.0:0 LISTEN 0 0FCIP Interface Misconfiguration Examples
The examples in this section show FCIP interface misconfigurations.
Displaying FCIP Misconfiguration Examples Using the CLI
The following example shows that the peer-info IP address of the remote endpoint is missing. The debug output is from the IPS module.
Module-2# debug ips fcip fsm port 1module-2# Mar 14 21:37:05 port1: 38:FCIP21: SUP-> Set Port mode 1Mar 14 21:37:05 port1: 39:FCIP21: SUP-> Port VSAN (1) already set to same valueMar 14 21:37:05 port1: 40:FCIP21: SUP-> Trunk mode (1) already set to same valueMar 14 21:37:05 port1: 41:FCIP21: SUP-> Enable tunnel ADMIN UPMar 14 21:37:05 port1: 42:FCIP21: Try to Bring UP the TunnelMar 14 21:37:05 port1: 43:FCIP21: Bring up tunnel Failed, peer-ip not set(The peer IP address is not set.)
MDS2# show interface fcip 21fcip21 is down (Link failure or not-connected)Hardware is GigabitEthernetPort WWN is 20:42:00:0b:5f:d5:9f:c0Admin port mode is auto, trunk mode is onvsan is 1Using Profile id 21 (interface GigabitEthernet2/1)Peer Information(This line shows the Peer Information as empty. The line should read "Peer Internet address is 10.10.10.2 and port is 3225.")
Special Frame is disabledMaximum number of TCP connections is 2Time Stamp is disabledB-port mode disabledTCP Connection Information0 Attempts for active connections, 0 close of connections5 minutes input rate 0 bits/sec, 0 bytes/sec, 0 frames/sec5 minutes output rate 0 bits/sec, 0 bytes/sec, 0 frames/sec0 frames input, 0 bytes0 Class F frames input, 0 bytes0 Class 2/3 frames input, 0 bytes0 Error frames0 frames output, 0 bytes0 Class F frames output, 0 bytes0 Class 2/3 frames output, 0 bytes0 Error frames 0 reass framesDisplaying the FCIP Interface as Administratively Shut Down Using the CLI
The following example shows that the FCIP interface is administratively shut down. The debug output is from the IPS module.
Module-2# debug ips fcip fsm port 1module-2# Mar 14 21:32:27 port1: 1:FCIP21: Create tunnel with ifindex: a000014Mar 14 21:32:27 port1: 2:FCIP21: Get the peer info from the SUP-IPS-MGRMar 14 21:32:27 port1: 3:FCIP21: SUP-> Disable tunnel: already in disable stateMar 14 21:32:27 port1: 4:FCIP21: SUP-> Set Port mode 1Mar 14 21:32:27 port1: 5:FCIP21: SUP-> Set port index: 21Mar 14 21:32:27 port1: 6:FCIP21: Try to Bring UP the TunnelMar 14 21:32:27 port1: 7:FCIP21: Tunnel in admin down state(The tunnel needs no shut down on the FCIP interface.)
Mar 14 21:32:27 port1: 8:FCIP21: SUP-> Set port VSAN: 1Mar 14 21:32:27 port1: 9:FCIP21: Try to Bring UP the TunnelMar 14 21:32:27 port1: 10:FCIP21: Tunnel in admin down stateMar 14 21:32:27 port1: 11:FCIP21: SUP-> Set port WWN: 0x2042000b5fd59fc0Mar 14 21:32:27 port1: 12:FCIP21: Try to Bring UP the TunnelMar 14 21:32:27 port1: 13:FCIP21: Tunnel in admin down state(The tunnel needs no shut down on the FCIP interface.)
Mar 14 21:32:27 port1: 14:FCIP21: SUP-> Set trunk mode: 1Mar 14 21:32:27 port1: 15:FCIP21: SUP-> Set source IF: 2080000Mar 14 21:32:27 port1: 16:FCIP21: Try to Bring UP the TunnelMar 14 21:32:27 port1: 17:FCIP21: Tunnel in admin down stateMar 14 21:32:27 port1: 18:FCIP21: SUP-> Switch WWN: 0x2000000b5fd59fc0Mar 14 21:32:27 port1: 19:FCIP21: Try to Bring UP the TunnelMar 14 21:32:27 port1: 20:FCIP21: Tunnel in admin down stateMar 14 21:32:27 port1: 21:FCIP21: SUP-> Response to SB's pull all tunnel infoMar 14 21:32:27 port1: 22:FCIP21: SUP-> Set peer port: 3225 current port: 3225Mar 14 21:32:27 port1: 23:FCIP21: peer port has same value, do nothingMar 14 21:32:27 port1: 24:FCIP21: Set number of tcp connection 2Mar 14 21:32:27 port1: 25:FCIP21: SUP-> Set Local listen IP: 10.10.11.2 current ip 0.0.0.0Mar 14 21:32:27 port1: 26:FCIP21: SUP-> Set Local listen Port: 3225 current port 3225Mar 14 21:32:27 port1: 27:FCIP21: SUP-> Enable PMTU Discovery, timeout 3600Mar 14 21:32:27 port1: 28:FCIP21: SUP-> Set round-trip time to 300 ms. Current value 100 msMar 14 21:32:27 port1: 29:FCIP21: SUP-> Set keep-alive time to 60 sec. current value 60 secMDS2# show interface fcip 21fcip21 is down (Administratively down)Hardware is GigabitEthernetPort WWN is 20:42:00:0b:5f:d5:9f:c0Admin port mode is auto, trunk mode is onvsan is 1Using Profile id 21 (interface GigabitEthernet2/1)Peer InformationPeer Internet address is 10.10.10.2 and port is 3225Special Frame is disabledMaximum number of TCP connections is 2Local MDS trying to connect to remote end point on port 13 and remote end point set to default listen port 3225MDS2# show interface fcip 21fcip21 is down (Link failure or not-connected)Hardware is GigabitEthernetPort WWN is 20:42:00:0b:5f:d5:9f:c0Admin port mode is auto, trunk mode is onvsan is 1Using Profile id 21 (interface GigabitEthernet2/1)Peer InformationPeer Internet address is 10.10.10.2 and port is 13MDS1# show fcip profile 21FCIP Profile 21Internet Address is 10.10.10.2 (interface GigabitEthernet2/1)Listen Port is 3225TCP parametersSACK is disabledPMTU discover is enabled, reset timeout is 3600 secKeep alive is 60 secMinimum retransmission timeout is 300 msMaximum number of re-transmissions is 4Advertised window size is 64 KBDisplaying the Debug Output from the Second Switch Using the CLI
The following debug output is from switch MDS2.
Mar 14 23:26:07 port1: 1340:FCIP21: Start TCP listener with peer: 10.10.10.2:3225Mar 14 23:26:07 port1: 1341:FCIP: Create a new listener object for 10.10.11.2:3225Mar 14 23:26:07 port1: 1342:FCIP: Create FCIP Listener with local info: 10.10.11.2:3225Mar 14 23:26:07 port1: 1343:FCIP21: Create a DE 0xd802d140 for this tunnelMar 14 23:26:07 port1: 1344:FCIP21: Bind the DE 0xd802d140 [1] to tunnel LEP 0x80111570Mar 14 23:26:07 port1: 1345:FCIP21: Start the active connection [1] to 10.10.10.2:13Mar 14 23:26:07 port1: 1346:FCIP21: Create a DE 0xd802cdc0 for this tunnelMar 14 23:26:07 port1: 1347:FCIP21: Bind the DE 0xd802cdc0 [2] to tunnel LEP 0x80111570Mar 14 23:26:07 port1: 1348:FCIP21: Start the active connection [2] to 10.10.10.2:13(The switch is attempting to create a TCP connection on port 13. The creation port must match the TCP listen port on the remote endpoint.)
Mar 14 23:26:07 port1: 1349:FCIP21: Active Connect creation FAILED [1]Mar 14 23:26:07 port1: 1350:FCIP21: Delete the DE [1]0xd802d140Mar 14 23:26:07 port1: 1351:FCIP21: Delete the DE object [1] 0xd802d140Mar 14 23:26:07 port1: 1352:FCIP21: Try 7 to bring up the tunnelMar 14 23:26:07 port1: 1353:FCIP21: Start the bringup tunnel timer, timeout: 64000Mar 14 23:26:07 port1: 1354:FCIP21: Active Connect creation FAILED [2]Mar 14 23:26:07 port1: 1355:FCIP21: Delete the DE [2]0xd802cdc0Mar 14 23:26:07 port1: 1356:FCIP21: Set lep operation state to DOWNMar 14 23:26:07 port1: 1357:FCIP21: Delete the DE object [2] 0xd802cdc0Mar 14 23:26:07 port1: 1358:FCIP21: Try 8 to bring up the tunnelMar 14 23:26:07 port1: 1359:FCIP21: Start the bringup tunnel timer, timeout: 128000MDS2(config-if)# peer-info ipaddr 10.10.10.2 port 3225(This changes the start active connection port to match the default port 3225.)
Or you can use this command:
MDS2(config-if)# no peer-info ipaddr 10.10.10.2 port 13(Removing port 13 will also set it to the default of 3225.)
MDS2# show interface fcip 21fcip21 is trunkingHardware is GigabitEthernetPort WWN is 20:42:00:0b:5f:d5:9f:c0Peer port WWN is 20:42:00:05:30:00:59:deAdmin port mode is auto, trunk mode is onPort mode is TEvsan is 1Trunk vsans (allowed active) (1-2)Trunk vsans (operational) (1-2)Trunk vsans (up) (1-2)Trunk vsans (isolated) ()Trunk vsans (initializing) ()Using Profile id 21 (interface GigabitEthernet2/1)Peer InformationPeer Internet address is 10.10.10.2 and port is 3225Special Frame is disabledMaximum number of TCP connections is 2Time Stamp is disabledB-port mode disabledTCP Connection Information2 Active TCP connectionsControl connection: Local 10.10.11.2:65330, Remote 10.10.10.2:3225Data connection: Local 10.10.11.2:65332, Remote 10.10.10.2:3225Displaying Passive Mode Set on Both Sides of the FCIP Tunnel with the CLI
In the following example, passive mode is set on both sides of the FCIP tunnel.
module-2# Mar 14 23:49:06 port1: 1870:FCIP21: SUP-> Set Port mode 1Mar 14 23:49:06 port1: 1871:FCIP21: SUP-> Port VSAN (1) already set to same valueMar 14 23:49:06 port1: 1872:FCIP21: SUP-> Trunk mode (1) already set to same valueMar 14 23:49:06 port1: 1873:FCIP21: SUP-> Enable tunnel ADMIN UPMar 14 23:49:06 port1: 1874:FCIP21: Try to Bring UP the TunnelMar 14 23:49:06 port1: 1875:FCIP21: Start TCP listener with peer: 10.10.10.2:3225Mar 14 23:49:06 port1: 1876:FCIP: Create a new listener object for 10.10.11.2:3225Mar 14 23:49:06 port1: 1877:FCIP: Create FCIP Listener with local info: 10.10.11.2:3225Mar 14 23:49:06 port1: 1878:FCIP21: Passive mode set, don't initiate TCP connection(A TCP connection will not be established when passive mode is set.The Gigabit Ethernet port will only listen.)
MDS2# show interface fcip 21fcip21 is down (Link failure or not-connected)Hardware is GigabitEthernetPort WWN is 20:42:00:0b:5f:d5:9f:c0Admin port mode is auto, trunk mode is onvsan is 1Using Profile id 21 (interface GigabitEthernet2/1)Peer InformationPeer Internet address is 10.10.10.2 and port is 3225Passive mode is enabled(Passive mode is set, so a TCP connection will not be established.)
Special Frame is disabledMDS1# show interface fcip 21fcip21 is down (Link failure or not-connected)Hardware is GigabitEthernetPort WWN is 20:42:00:05:30:00:59:deAdmin port mode is auto, trunk mode is onvsan is 1Using Profile id 21 (interface GigabitEthernet2/1)Peer InformationPeer Internet address is 10.10.11.2 and port is 3225Passive mode is enabled(Both sides are set to passive mode. You must change one or both sides to no passive-mode under the FCIP interface.)
Special Frame is disabledMDS2(config)# interface fcip 21MDS2(config-if)# no passive-mode(Change one or both sides to no passive-mode.)
MDS2# show interface fcip 21fcip21 is trunkingDisplaying a Time Stamp Acceptable Difference Failure Using the CLI
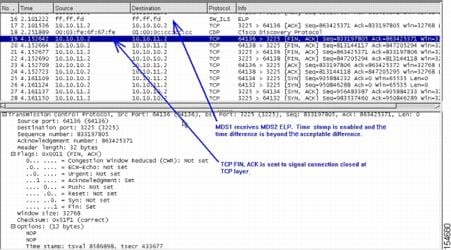
The following example shows a time stamp acceptable difference failure, or no NTP server connected to synchronize clocks. When using time stamps, the MDS switch must be a synchronized clock. NTP is configurable on the MDS 9000 switch.
MDS2(config)# interface fcip 21MDS2(config-if)# time-stampmodule-2# debug ips fcip fsm port 1Mar 15 00:01:35 port1: 3248:FCIP21: IPS-> Enable timestamp acceptable difference 1000(Time stamp is enabled under the FCIP interface. The default acceptable difference is 1000.)
Mar 15 00:01:35 port1: 3249:FCIP21: IPS-> acc diff in sec: 0x1 frac: 0x0Mar 15 00:01:35 port1: 3250:FCIP21: Sending response code: 0Mar 15 00:01:48 port1: 3251:FCIP21: Time stamp tolerance check failed local time: 0x3e726d6c2db994b7 tolerance: 0x100000000 recv time: 0x3e7251ace20db73a(The timestamp difference failed the acceptable difference.)
Mar 15 00:01:48  port1: 3252:FCIP21: Time stamp tolerance check failed local time:
0x3e726d6c2db994b7 tolerance: 0x100000000 recv time: 0x3e7251ace20db73a
Mar 15 00:01:48 port1: 3253:FCIP21: Time stamp tolerance check failed local time: 0x3e726d6c2db994b7 tolerance: 0x100000000 recv time: 0x3e7251ace20db73a<<< cut >>> Mar 15 00:01:48 port1: 3290:FCIP21: Time stamp tolerance check failed local time: 0x3e726d6c2db994b7 tolerance: 0x100000000 recv time: 0x3e7251ace20db73aMar 15 00:01:48 port1: 3291:FCIP21: (fcip_de_rcv): Previous partial packet - ConcatenatingMar 15 00:01:48 port1: 3292:FCIP21: Time stamp tolerance check failed local time: 0x3e726d6c2db994b7 tolerance: 0x100000000 recv time: 0x3e7251ace20db73aMar 15 00:01:48 port1: 3293:FCIP21: FCIP frame len 0x300 is not within correct range <<< ?? >>>Mar 15 00:01:48 port1: 3294:FCIP21: Delete the DE [2]0xd802d680Mar 15 00:01:48 port1: 3295:FCIP21: replace the eport entry at index: 1Mar 15 00:01:48 port1: 3296:FCIP21: DE [-670902656] 0x00000002 terminate tcp connection 0xd8072800(The TCP connection is disconnected because the time stamp difference is too large.)
Mar 15 00:01:48 port1: 3297:FCIP21: Delete the DE object [2] 0xd802d680Mar 15 00:01:48 port1: 3298:FCIP21: Delete the DE [1]0xd802cf00Mar 15 00:01:48 port1: 3299:FCIP21: Unregister from flamingo port_index: 0x21Mar 15 00:01:48 port1: 3300:FCIP21: Send Link down to SUPMar 15 00:01:48 port1: 3301:FCIP21: Start the bringup tunnel timer, timeout: 18470Mar 15 00:01:48 port1: 3302:FCIP21: replace the eport entry at index: 0Mar 15 00:01:48 port1: 3303:FCIP21: Set lep operation state to DOWNMar 15 00:01:48 port1: 3304:FCIP21: DE [-670904576] 0x00000001 terminate tcp connection 0xd8072c00Mar 15 00:01:48 port1: 3305:FCIP21: Delete the DE object [1] 0xd802cf00Mar 15 00:01:50 port1: 3306:FCIP21: Received new TCP connection from peer: 10.10.10.2:65066(The TCP connection begins trying to reestablish the connection.)
Mar 15 00:01:50  port1: 3307:FCIP21: Tunnel is not ADMIN UP state, reject new TCP
connection from 10.10.10.2:65066
Mar 15 00:01:50 port1: 3308:FCIP21: Received new TCP connection from peer: 10.10.10.2:65064Mar 15 00:01:50 port1: 3309:FCIP21: Tunnel is not ADMIN UP state, reject new TCP connection from 10.10.10.2:65064Mar 15 00:01:56 port1: 3310:FCIP21: SUP-> Set Port mode 1Mar 15 00:01:56 port1: 3311:FCIP21: SUP-> Port VSAN (1) already set to same valueMar 15 00:01:56 port1: 3312:FCIP21: SUP-> Set trunk mode: 1Mar 15 00:01:56 port1: 3313:FCIP21: SUP-> Enable tunnel ADMIN UPMar 15 00:01:56 port1: 3314:FCIP21: Try to Bring UP the TunnelMar 15 00:01:56 port1: 3315:FCIP21: tunnel bring-up debounce timer set, wait for timer to pop(Connect the NTP server or synchronized clocks, or increase the acceptable difference.)
module-2# debug ips fcip fsm port 1module-2#Jan 14 14:22:08 port1: 854886:FCIP21: IPS-> Enable timestamp acceptable difference 2000Jan 14 14:22:08 port1: 854887:FCIP21: IPS-> acc diff in sec: 0x2 frac: 0x0(The time stamp acceptable difference passes and the tunnel continues to be brought up.)
module-2#module-2# Jan 14 14:22:39 port1: 854932:FCIP21: Received new TCP connection from peer: 10.10.10.2:64172Jan 14 14:22:39 port1: 854933:FCIP21: Create a DE 0xd802d5c0 for this tunnelJan 14 14:22:39 port1: 854934:FCIP21: Bind the DE 0xd802d5c0 [1] to tunnel LEP 0x80111570Jan 14 14:22:39 port1: 854935:FCIP21: Bind DE 1 to TCP-hdl 0xd8071000Jan 14 14:22:39 port1: 854936:FCIP21: Bind DE 1 to eport 0x80110550Jan 14 14:22:39 port1: 854937:FCIP21: bind de 1 in eport 0x80110550, hash = 1 num-conn: 2Jan 14 14:22:39 port1: 854938:FCIP21: Received new TCP connection from peer: 10.10.10.2:64170Jan 14 14:22:39 port1: 854939:FCIP21: Create a DE 0xd802c900 for this tunnelJan 14 14:22:39 port1: 854940:FCIP21: Bind the DE 0xd802c900 [2] to tunnel LEP0x80111570Jan 14 14:22:39 port1: 854941:FCIP21: Bind DE 2 to TCP-hdl 0xd8070000Jan 14 14:22:39 port1: 854942:FCIP21: Bind DE 2 to eport 0x80110550Jan 14 14:22:39 port1: 854943:FCIP21: bind de 2 in eport 0x80110550, hash = 2 num-conn: 2Jan 14 14:22:39 port1: 854944:FCIP21: Send LINK UP to SUPJan 14 14:22:39 port1: 854945:FCIP21: *** Received eisl frame in E modeJan 14 14:22:39 port1: 854946:FCIP21: SUP-> Set trunk mode: 2Jan 14 14:22:39 port1: 854947:FCIP21: Change the operational mode to TRUNKMDS2# show interface fcip 21fcip21 is trunkingHardware is GigabitEthernetPort WWN is 20:42:00:0b:5f:d5:9f:c0Peer port WWN is 20:42:00:05:30:00:59:deAdmin port mode is auto, trunk mode is onPort mode is TEvsan is 1Trunk vsans (allowed active) (1-2)Trunk vsans (operational) (1-2)Trunk vsans (up) (1-2)Trunk vsans (isolated) ()Trunk vsans (initializing) ()Using Profile id 21 (interface GigabitEthernet2/1)Peer InformationPeer Internet address is 10.10.10.2 and port is 3225Special Frame is disabledMaximum number of TCP connections is 2Time Stamp is enabled, acceptable time difference 2000 msB-port mode disabledTCP Connection InformationFigure 20-7 shows a trace of time stamp difference failure.
Figure 20-7 Trace of Time-stamp Difference Failure
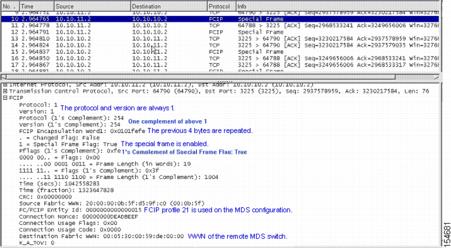
Figure 20-8 shows a trace of timestamp difference accepted.
Figure 20-8 Trace of Time-stamp Difference Accepted
FCIP Special Frame Tunnel Creation and Monitoring
The FCIP tunnel configuration (see the "One-to-One FCIP Tunnel Creation and Monitoring" section and the "One-to-Three FCIP Tunnel Creation and Monitoring" section) must be completed before adding the FCIP special frame configuration. This section describes how to correctly configure and show an FCIP tunnel with a special frame.
Configuring and Displaying an FCIP Tunnel with Special Frame Using the CLI
To configure an display an FCIP tunnel with a special frame using the CLI, follow these steps:
Step 1
MDS2# show wwn switchSwitch WWN is 20:00:00:0b:5f:d5:9f:c0Step 2
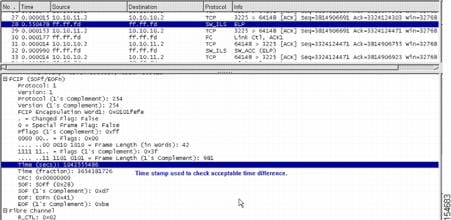
MDS2(config)# interface fcip 21MDS2(config-if)# special-frame peer-wwn 20:00:00:05:30:00:59:de profile-id 1module-2#Jan 14 15:25:38 port1: 857314:FCIP21: SUP-> Set Port mode 1Jan 14 15:25:38 port1: 857315:FCIP21: SUP-> Port VSAN (1) already set to same valueJan 14 15:25:38 port1: 857316:FCIP21: SUP-> Trunk mode (1) already set to same valueJan 14 15:25:38 port1: 857317:FCIP21: SUP-> Enable tunnel ADMIN UPJan 14 15:25:38 port1: 857318:FCIP21: Try to Bring UP the TunnelJan 14 15:25:38 port1: 857319:FCIP21: Start TCP listener with peer: 10.10.10.2:3225Jan 14 15:25:38 port1: 857320:FCIP: Create a new listener object for 10.10.11.2:3225Jan 14 15:25:38 port1: 857321:FCIP: Create FCIP Listener with local info: 10.10.11.2:3225Jan 14 15:25:38 port1: 857322:FCIP21: Create a DE 0xd802cd00 for this tunnelJan 14 15:25:38 port1: 857323:FCIP21: Bind the DE 0xd802cd00 [1] to tunnel LEP 0x80111570Jan 14 15:25:38 port1: 857324:FCIP21: Start the active connection [1] to 10.10.10.2:3225Jan 14 15:25:38 port1: 857325:FCIP21: Create a DE 0xd802db40 for this tunnelJan 14 15:25:38 port1: 857326:FCIP21: Bind the DE 0xd802db40 [2] to tunnel LEP 0x80111570Jan 14 15:25:38 port1: 857327:FCIP21: Start the active connection [2] to 10.10.10.2:3225Jan 14 15:25:38 port1: 857328:FCIP21: Active Connect creation SUCCEEDED [1]Jan 14 15:25:38 port1: 857329:FCIP21: Bind DE 1 to TCP-hdl 0xd8072c00Jan 14 15:25:38 port1: 857330:FCIP21: Setup for Special Frame handling: I'm Originator(This begins the Special Frame setup of the Originator.)Jan 14 15:25:38 port1: 857331:FCIP21: Send the SF as Originator & wait for response(The Special Frame is sent.)Jan 14 15:25:38 port1: 857332:FCIP21: Setup timer to wait for SFJan 14 15:25:38 port1: 857333:FCIP21: Active Connect creation SUCCEEDED [2](The Special Frame is correctly configured with the WWN of the remote MDS 9000 switch.)Jan 14 15:25:38 port1: 857334:FCIP21: Bind DE 2 to TCP-hdl 0xd8072000Jan 14 15:25:38 port1: 857335:FCIP21: Setup for Special Frame handling: I'm OriginatorJan 14 15:25:38 port1: 857336:FCIP21: Send the SF as Originator & wait for responseJan 14 15:25:38 port1: 857337:FCIP21: Setup timer to wait for SFJan 14 15:25:38 port1: 857338:FCIP21: processing SF frame, I'm OriginatorJan 14 15:25:38 port1: 857339:FCIP21: Bind DE 1 to eport 0x80110550Jan 14 15:25:38 port1: 857340:FCIP21: bind de 1 in eport 0x80110550, hash = 1 num-conn: 2Jan 14 15:25:38 port1: 857341:FCIP21: processing SF frame, I'm OriginatorJan 14 15:25:38 port1: 857342:FCIP21: Bind DE 2 to eport 0x80110550Jan 14 15:25:38 port1: 857343:FCIP21: bind de 2 in eport 0x80110550, hash = 2 num-conn: 2Jan 14 15:25:38 port1: 857344:FCIP21: Send LINK UP to SUPJan 14 15:25:39 port1: 857345:FCIP21: SUP-> Set trunk mode: 2Jan 14 15:25:39 port1: 857346:FCIP21: Change the operational mode to TRUNKJan 14 15:25:39 port1: 857347:FCIP21: *** Received non-eisl frame in TE mode 64 64Step 3
MDS2# show interface fcip 21fcip21 is trunkingHardware is GigabitEthernetPort WWN is 20:42:00:0b:5f:d5:9f:c0Peer port WWN is 20:42:00:05:30:00:59:deAdmin port mode is auto, trunk mode is onPort mode is TEvsan is 1Trunk vsans (allowed active) (1-2)Trunk vsans (operational) (1-2)Trunk vsans (up) (1-2)Trunk vsans (isolated) ()Trunk vsans (initializing) ()Using Profile id 21 (interface GigabitEthernet2/1)Peer InformationPeer Internet address is 10.10.10.2 and port is 3225Special Frame is enabledPeer switch WWN is 20:00:00:05:30:00:59:deMaximum number of TCP connections is 2Time Stamp is enabled, acceptable time difference 3000 msB-port mode disabledTCP Connection Information2 Active TCP connectionsControl connection: Local 10.10.11.2:64792, Remote 10.10.10.2:3225Data connection: Local 10.10.11.2:64794, Remote 10.10.10.2:3225372 Attempts for active connections, 345 close of connectionsTCP ParametersPath MTU 1500 bytesCurrent retransmission timeout is 300 msRound trip time: Smoothed 10 ms, Variance: 5Advertized window: Current: 64 KB, Maximum: 64 KB, Scale: 1Peer receive window: Current: 64 KB, Maximum: 64 KB, Scale: 1Congestion window: Current: 2 KB, Slow start threshold: 1048560 KBStep 4
Figure 20-9 shows a trace of an FCIP tunnel with a special frame.
Figure 20-9 Trace of FCIP Tunnel with a Special Frame
Special Frame Misconfiguration Example
The following example shows an incorrect peer WWN when using a special frame.
Example 20-1 Annotated Example of Incorrect Peer WWN with Special Frame Enabled
module-2# Jan 14 15:14:30 port1: 855278:FCIP21: SUP-> Set Port mode 1Jan 14 15:14:30 port1: 855279:FCIP21: SUP-> Port VSAN (1) already set to same valueJan 14 15:14:30 port1: 855280:FCIP21: SUP-> Trunk mode (1) already set to sameJan 14 15:14:30 port1: 855281:FCIP21: SUP-> Enable tunnel ADMIN UPJan 14 15:14:30 port1: 855282:FCIP21: Try to Bring UP the TunnelJan 14 15:14:30 port1: 855283:FCIP21: Start TCP listener with peer: 10.10.10.2:3225Jan 14 15:14:30 port1: 855284:FCIP: Create a new listener object for 10.10.11.2:3225Jan 14 15:14:30 port1: 855285:FCIP: Create FCIP Listener with local info: 10.10.11.2:3225Jan 14 15:14:30 port1: 855286:FCIP21: Create a DE 0xd802d240 for this tunnelJan 14 15:14:30 port1: 855287:FCIP21: Bind the DE 0xd802d240 [1] to tunnel LEP 0x80111570Jan 14 15:14:30 port1: 855288:FCIP21: Start the active connection [1] to 10.10.10.2:3225Jan 14 15:14:30 port1: 855289:FCIP21: Create a DE 0xd802d200 for this tunnelJan 14 15:14:30 port1: 855290:FCIP21: Bind the DE 0xd802d200 [2] to tunnel LEP 0x80111570Jan 14 15:14:30 port1: 855291:FCIP21: Start the active connection [2] to 10.10.10.2:3225Jan 14 15:14:30 port1: 855292:FCIP21: Active Connect creation SUCCEEDED [1]Jan 14 15:14:30 port1: 855293:FCIP21: Bind DE 1 to TCP-hdl 0xd8072c00Jan 14 15:14:30 port1: 855294:FCIP21: Setup for Special Frame handling: I'm OriginatorJan 14 15:14:30 port1: 855295:FCIP21: Send the SF as Originator & wait for responseJan 14 15:14:30 port1: 855296:FCIP21: Setup timer to wait for SFJan 14 15:14:30 port1: 855297:FCIP21: Active Connect creation SUCCEEDED [2]Jan 14 15:14:30 port1: 855298:FCIP21: Bind DE 2 to TCP-hdl 0xd8072000Jan 14 15:14:30 port1: 855299:FCIP21: Setup for Special Frame handling: I'm OriginatorJan 14 15:14:30 port1: 855300:FCIP21: Send the SF as Originator & wait for responseJan 14 15:14:30 port1: 855301:FCIP21: Setup timer to wait for SFJan 14 15:14:30 port1: 855302:FCIP21: TCP Received a close connection [1] reason 1Jan 14 15:14:30 port1: 855303:FCIP21: Delete the DE [1]0xd802d240Jan 14 15:14:30 port1: 855304:FCIP21: DE [-670903744] 0x00000001 terminate tcp connection 0xd8072c00Jan 14 15:14:30 port1: 855305:FCIP21: Delete the DE object [1] 0xd802d240Jan 14 15:14:30 port1: 855306:FCIP21: lep not bound, close only de [1]Jan 14 15:14:30 port1: 855307:FCIP21: TCP Received a close connection [2] reason 1Jan 14 15:14:30 port1: 855308:FCIP21: Delete the DE [2]0xd802d200Jan 14 15:14:30 port1: 855309:FCIP21: Set lep operation state to DOWNJan 14 15:14:30 port1: 855310:FCIP21: Start the bringup tunnel timer, timeout: 38740Jan 14 15:14:30 port1: 855311:FCIP21: DE [-670903808] 0x00000002 terminate tcp connection 0xd8072000Jan 14 15:14:30 port1: 855312:FCIP21: Delete the DE object [2] 0xd802d200Jan 14 15:14:30 port1: 855313:FCIP21: lep not bound, close only de [2]Jan 14 15:14:31 port1: 855314:FCIP21: Received new TCP connection from peer: 10.10.10.2:64050Jan 14 15:14:31 port1: 855315:FCIP21: Create a DE 0xd802d080 for this tunnelJan 14 15:14:31 port1: 855316:FCIP21: Bind the DE 0xd802d080 [1] to tunnel LEP 0x80111570Jan 14 15:14:31 port1: 855317:FCIP21: Bind DE 1 to TCP-hdl 0xd8072000Jan 14 15:14:31 port1: 855318:FCIP21: Setup for Special Frame handling: I'm ResponderJan 14 15:14:31 port1: 855319:FCIP21: Setup timer to wait for SFJan 14 15:14:31 port1: 855320:FCIP21: processing SF frame, I'm ResponderJan 14 15:14:31 port1: 855321:FCIP21: Source FC fabric name in SF (0x20000005300059de) does not match LEP's peer fabric WWN (0x20010005300059df)Jan 14 15:14:31 port1: 855322:FCIP21: Delete the DE [1]0xd802d080Jan 14 15:14:31 port1: 855323:FCIP21: Set lep operation state to DOWNJan 14 15:14:31 port1: 855324:FCIP21: DE [-670904192] 0x00000001 terminate tcp connection 0xd8072000Jan 14 15:14:31 port1: 855325:FCIP21: Delete the DE object [1] 0xd802d080Jan 14 15:14:31 port1: 855326:FCIP21: Received new TCP connection from peer: 10.10.10.2:64048Jan 14 15:14:31 port1: 855327:FCIP21: Create a DE 0xd802d200 for this tunnelJan 14 15:14:31 port1: 855328:FCIP21: Bind the DE 0xd802d200 [1] to tunnel LEP 0x80111570Jan 14 15:14:31 port1: 855329:FCIP21: Bind DE 1 to TCP-hdl 0xd8072c00Jan 14 15:14:31 port1: 855330:FCIP21: Setup for Special Frame handling: I'm ResponderJan 14 15:14:31 port1: 855331:FCIP21: Setup timer to wait for SFJan 14 15:14:31 port1: 855332:FCIP21: processing SF frame, I'm ResponderJan 14 15:14:31 port1: 855333:FCIP21: Source FC fabric name in SF (0x20000005300059de) does not match LEP's peer fabric WWN (0x20010005300059df)Jan 14 15:14:31 port1: 855334:FCIP21: Delete the DE [1]0xd802d200Jan 14 15:14:31 port1: 855335:FCIP21: Set lep operation state to DOWNJan 14 15:14:31 port1: 855336:FCIP21: DE [-670903808] 0x00000001 terminate tcp connection 0xd8072c00Jan 14 15:14:31 port1: 855337:FCIP21: Delete the DE object [1] 0xd802d200Jan 14 15:14:37 port1: 855338:FCIP21: Received new TCP connection from peer: 10.10.10.2:64046Jan 14 15:14:37 port1: 855339:FCIP21: Create a DE 0xd802d5c0 for this tunnelJan 14 15:14:37 port1: 855340:FCIP21: Bind the DE 0xd802d5c0 [1] to tunnel LEP 0x80111570Jan 14 15:14:37 port1: 855341:FCIP21: Bind DE 1 to TCP-hdl 0xd8071000Jan 14 15:14:37 port1: 855342:FCIP21: Setup for Special Frame handling: I'm ResponderJan 14 15:14:37 port1: 855343:FCIP21: Setup timer to wait for SFJan 14 15:14:37 port1: 855344:FCIP21: processing SF frame, I'm ResponderJan 14 15:14:37 port1: 855345:FCIP21: Source FC fabric name in SF (0x20000005300059de) does not match LEP's peer fabric WWN (0x20010005300059df)Jan 14 15:14:37 port1: 855346:FCIP21: Delete the DE [1]0xd802d5c0Jan 14 15:14:37 port1: 855347:FCIP21: Set lep operation state to DOWNJan 14 15:14:37 port1: 855348:FCIP21: DE [-670902848] 0x00000001 terminate tcp connection 0xd8071000Jan 14 15:14:37 port1: 855349:FCIP21: Delete the DE object [1] 0xd802d5c0Jan 14 15:14:37 port1: 855350:FCIP21: Received new TCP connection from peer: 10.10.10.2:64044Jan 14 15:14:37 port1: 855351:FCIP21: Create a DE 0xd802cac0 for this tunnelJan 14 15:14:37 port1: 855352:FCIP21: Bind the DE 0xd802cac0 [1] to tunnel LEP 0x80111570Jan 14 15:14:37 port1: 855353:FCIP21: Bind DE 1 to TCP-hdl 0xd8071400Jan 14 15:14:37 port1: 855354:FCIP21: Setup for Special Frame handling: I'm ResponderJan 14 15:14:37 port1: 855355:FCIP21: Setup timer to wait for SFJan 14 15:14:37 port1: 855356:FCIP21: processing SF frame, I'm ResponderJan 14 15:14:37 port1: 855357:FCIP21: Source FC fabric name in SF (0x20000005300059de) does not match LEP's peer fabric WWN (0x20010005300059df)Jan 14 15:14:37 port1: 855358:FCIP21: Delete the DE [1]0xd802cac0Jan 14 15:14:37 port1: 855359:FCIP21: Set lep operation state to DOWNJan 14 15:14:37 port1: 855360:FCIP21: DE [-670905664] 0x00000001 terminate tcp connection 0xd8071400Jan 14 15:14:37 port1: 855361:FCIP21: Delete the DE object [1] 0xd802cac0Troubleshooting FCIP Link Flaps
If you have an FCIP link that flaps, adjust the TCP keepalive and max retransmission values. In Fabric Manager, choose ISLs > FCIP, select the Profiles tab and set the Keepalive field. In the CLI, use the tcp keepalive-timeout and tcp max-retransmissions commands in FCIP profile submode.
Troubleshooting FCIP ISL Link Failures
If you have an FCIP ISL link that experiences unexplained failures, the FCIP profile in use may not be configured to match the underlying physical link characteristics and the shared traffic constraints.
For example, if you have a 200 Mbps physical link and you have configured two FCIP tunnels across that link, each with 155 Mbps traffic, link failures will occur because the physical connection cannot handle the traffic.
To resolve the problem, tune the TCP parameters in the FCIP profile to match the characteristic and constraints of the physical link and any other traffic shared on that link.
See "Verifying the Configuration of the Profiles Using the CLI" section for details on the adjustable parameters in the FCIP profile.
Troubleshooting FCIP and Compression
If you have an FCIP tunnel between an IPS module and a Cisco MDS 14/2, 9221i or MDS 18/4 module, use the same compression mode on both sides of the FCIP tunnel. In this specific configuration, avoid compression mode 1, because the Cisco MDS module could send compressed traffic faster than the IPS module could process.
iSCSI Issues
This section contains information on troubleshooting iSCSI and includes the following topics:
•
•
•
•
•
•
•
Troubleshooting iSCSI Authentication
iSCSI user login authentication is required with the Cisco MDS 9000 Family switch. There are two ways to authenticate iSCSI users: either locally in the switch's configuration file or using the RADIUS server database.
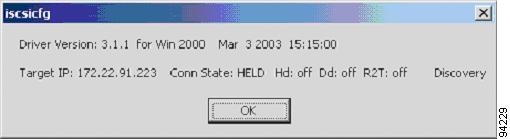
Figure 20-10 shows a successful iSCSI login for the Windows 2000 driver.
Figure 20-10 Successful iSCSI Login Status Window
On Solaris systems, a successful login is found in the /var/adm/messages directory and should look similar to the following example:
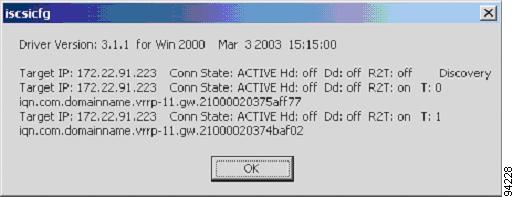
Mar 14 12:53:23 ca-sun1 iscsid[12745]: [ID 702911 daemon.notice] discovery process for
172.22.91.223 finished, exiting
Mar 14 12:58:45 ca-sun1 iscsid[12802]: [ID 448557 daemon.notice] logged into DiscoveryAddress 172.22.91.223:3260 isid 023d0040Mar 14 12:58:45 ca-sun1 iscsid[12802]: [ID 702911 daemon.notice] iSCSI target 2 = iqn.com.domainname.vrrp-11.gw.21000020375aff77 at0Mar 14 12:58:45 ca-sun1 iscsid[12809]: [ID 529321 daemon.notice] logged into target iqn.com.domainname.vrrp-11.gw.21000020375aff77 7Mar 14 12:58:45 ca-sun1 iscsid[12802]: [ID 702911 daemon.notice] iSCSI target 3 = iqn.com.domainname.vrrp-11.gw.21000020374baf02 at0Mar 14 12:58:45 ca-sun1 iscsid[12810]: [ID 529321 daemon.notice] logged into target iqn.com.domainname.vrrp-11.gw.21000020374baf02 7Figure 20-11 shows a failed iSCSI login for the Windows 2000 driver.
Figure 20-11 Failed iSCSI Login Status Window
On Solaris systems, a failed login is found in the /var/adm/messages directory and should look similar to the following example:
Mar 14 11:44:42 ca-sun1 iscsid[12561]: [ID 702911 daemon.notice] login rejected: initiator
error (01)
Mar 14 11:44:42 ca-sun1 iscsid[12561]: [ID 702911 daemon.error] Hard discovery login failure to 172.22.91.223:3260 - exitingMar 14 11:44:42 ca-sun1 iscsid[12561]: [ID 702911 daemon.notice] discovery process for 172.22.91.223 finished, exitingDisplaying iSCSI Authentication Using Fabric Manager
Whenever you experience a login failure, choose End Devices > iSCSI, select the Globals tab, and
view the AuthMethod field to see if the iSCSI authentication is correctly defined.
Displaying iSCSI Authentication Using the CLI
Whenever you experience a login failure, use the show authentication command to see if the iSCSI authentication is correctly defined. This is an example of local authentication:
switch# show authenticationauthentication method:noneconsole:not enabledtelnet/ssh:not enabledauthentication method:radiusconsole:not enabledtelnet/ssh:not enablediscsi:not enabledauthentication method:local <<<<<<<<<<<<<<<<<<<<console:enabledtelnet/ssh:enablediscsi:enabled <<<<<<<<<<<<<<<<<<<<switch#If iSCSI is configured for RADIUS authentication, it should looks like this:
switch# show authenticationauthentication method:noneconsole:not enabledtelnet/ssh:not enabledauthentication method:radius <<<<<<<<<<<<<<<<<<<console:not enabledtelnet/ssh:not enablediscsi:enabled <<<<<<<<<<<<<<<<<<<authentication method:localconsole:enabledtelnet/ssh:enablediscsi:enabledswitch#Troubleshooting User Name and Password Configuration
Check the client side user name and password with either the switch's local configuration file or the RADIUS server.
Verifying iSCSI User Account Configuration Using Fabric Manager
If iSCSI user authentication is through the switch's local user database, choose Switches > Security > Users and Roles and select the Users tab to verify that the iSCSI users are configured correctly with the user name and password
Note
Verifying iSCSI User Account Configuration Using the CLI
If iSCSI user authentication is through the switch's local user database, use the show user-account command to verify that the iSCSI users are configured correctly with the user name and password,
Note
switch# show user-account iscsiusername:iscsisecret:1234567812345678username:iscsiusersecret:1234567812345678RADIUS Configuration Troubleshooting
If iSCSI authentication is through the RADIUS server, ping the RADIUS server to and from the switch to make sure it can be reached over IP.
Verifying RADIUS Key and Port for Authentication and Accounting
Choose Switches > Security > AAA > RADIUS in Fabric Manager to verify the RADIUS key and port for authentication.
Or use the show radius-server CLI command to verify that the RADIUS key and port for authentication and accounting are an exact match with what is configured on the RADIUS server.
switch# show radius-serverretransmission count:3timeout value:5following RADIUS servers are configured:171.71.49.197:available for authentication on port:1812available for accounting on port:1813RADIUS shared secret:radiusAdjust the RADIUS timeout and retransmission accordingly, as they have a default value of 1 second and 1 time.
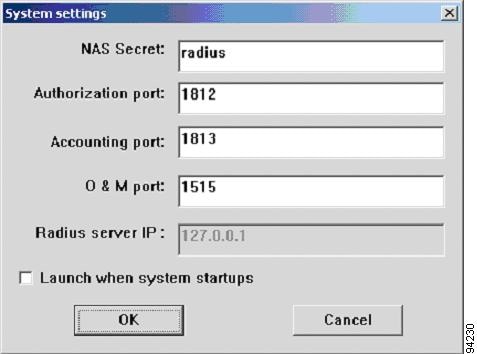
Figure 20-12 shows a Windows-based RADIUS server configuration.
Figure 20-12 Windows-Based RADIUS Server Configuration Dialog Box
If the items in Figure 20-12 match your switch's configuration, then verify that the client user name and password also match those in the RADIUS server.
The following example shows the output of the debug security radius command, if the iSCSI client logs in successfully.
switch#switch# Mar 4 23:16:20 securityd: received CHAP authentication request for user002Mar 4 23:16:20 securityd: RADIUS is enabled, hence it will be tried first for CHAP authenticationMar 4 23:16:20 securityd: reading RADIUS configurationMar 4 23:16:20 securityd: opening radius configuration for group:defaultMar 4 23:16:20 securityd: opened the configuration successfullyMar 4 23:16:20 securityd: GET request for RADIUS global configMar 4 23:16:20 securityd: got back the return value of global radius configuration operation:successMar 4 23:16:20 securityd: closing RADIUS pss configurationMar 4 23:16:20 securityd: opening radius configuration for group:defaultMar 4 23:16:20 securityd: opened the configuration successfullyMar 4 23:16:20 securityd: GETNEXT request for radius index:0 addr:Mar 4 23:16:20 securityd: got some reply from 171.71.49.197Mar 4 23:16:20 securityd: verified the response from:171.71.49.197Mar 4 23:16:20 securityd: RADIUS server sent accept for authentication request for user002Mar 4 23:16:25 securityd: received CHAP authentication request for user002Mar 4 23:16:25 securityd: RADIUS is enabled, hence it will be tried first for CHAP authenticationMar 4 23:16:25 securityd: reading RADIUS configurationMar 4 23:16:25 securityd: opening radius configuration for group:defaultMar 4 23:16:25 securityd: opened the configuration successfullyMar 4 23:16:25 securityd: GET request for RADIUS global configMar 4 23:16:25 securityd: got back the return value of global radius configuration operation:successMar 4 23:16:25 securityd: closing RADIUS pss configurationMar 4 23:16:25 securityd: opening radius configuration for group:defaultMar 4 23:16:25 securityd: opened the configuration successfullyMar 4 23:16:25 securityd: GETNEXT request for radius index:0 addr:Mar 4 23:16:25 securityd: got some reply from 171.71.49.197Mar 4 23:16:25 securityd: verified the response from:171.71.49.197Mar 4 23:16:25 securityd: RADIUS server sent accept for authentication request for user002Mar 4 23:16:25 securityd: got some reply from 171.71.49.197Mar 4 23:16:25 securityd: verified the response from:171.71.49.197Mar 4 23:16:25 securityd: RADIUS server sent accept for authentication request for user002The previous example shows that the iSCSI client has been authenticated three times, first for the switch login, and the second and third times for the iSCSI driver login. The switch sends RADIUS attributes 1, 3, 4, 5, 6, 60 and 61 to the RADIUS server. The RADIUS server only needs to respond with request accept or request reject.
The following example shows a RADIUS authentication.
639 2003y3m14d 15h12m48s ------------------------------------------------640 2003y3m14d 15h12m48s Message Type=Access_Request641 2003y3m14d 15h12m48s ID=243, Length=90642 2003y3m14d 15h12m48s User name=user002643 2003y3m14d 15h12m48s NAS IP address=2887147911644 2003y3m14d 15h12m48s CHAP password=‰j÷<¸Wøøë-K-ëÙ<]645 2003y3m14d 15h12m48s CHAP challenge=n8NÝgø§"__Ó4}Ôx646 2003y3m14d 15h12m48s NAS port=1426647 2003y3m14d 15h12m48s NAS port type=5648 2003y3m14d 15h12m48s Service type=8649 2003y3m14d 15h12m48s User (user002) authenticate OK.650 2003y3m14d 15h12m54s ------------------------------------------------651 2003y3m14d 15h12m54s Message Type=Access_Request652 2003y3m14d 15h12m54s ID=60, Length=90653 2003y3m14d 15h12m54s User name=user002654 2003y3m14d 15h12m54s NAS IP address=2887147911655 2003y3m14d 15h12m54s CHAP password=_¿Éò_à!_AëC0__` õ656 2003y3m14d 15h12m54s CHAP challenge=_/Ô½Ÿ×!âßÈ 4_´ZH657 2003y3m14d 15h12m54s NAS port=1426658 2003y3m14d 15h12m54s NAS port type=5659 2003y3m14d 15h12m54s Service type=8660 2003y3m14d 15h12m54s User (user002) authenticate OK.661 2003y3m14d 15h12m54s ------------------------------------------------662 2003y3m14d 15h12m54s Message Type=Access_Request663 2003y3m14d 15h12m54s ID=179, Length=90664 2003y3m14d 15h12m54s User name=user002665 2003y3m14d 15h12m54s NAS IP address=2887147911666 2003y3m14d 15h12m54s CHAP password= --5Àùrfàxh667 2003y3m14d 15h12m54s CHAP challenge=#ùÊÝü{_"__"´_Ux668 2003y3m14d 15h12m54s NAS port=1426669 2003y3m14d 15h12m54s NAS port type=5670 2003y3m14d 15h12m54s Service type=8671 2003y3m14d 15h12m54s User (user002) authenticate OK.Troubleshooting RADIUS Routing Configuration
The switch sends the RADIUS authentication request from the mgmt0 interface, so the correct route to the RADIUS server must be defined. If no correct route is defined, the switch may send the RADIUS request from the Gigabit Ethernet port. In that case, the RADIUS server returns the accept to the Gigabit Ethernet port and the switch does not get the response.
Displaying the Debug Output for RADIUS Authentication Request Routing Using the CLI
The following example shows the output from the debug security radius command.
switch# Mar 5 00:51:13 securityd: received CHAP authentication request for user002Mar 5 00:51:13 securityd: RADIUS is enabled, hence it will be tried first for CHAP authenticationMar 5 00:51:13 securityd: reading RADIUS configurationMar 5 00:51:13 securityd: opening radius configuration for group:defaultMar 5 00:51:13 securityd: opened the configuration successfullyMar 5 00:51:13 securityd: GET request for RADIUS global configMar 5 00:51:13 securityd: got back the return value of global radius configuration operation:successMar 5 00:51:13 securityd: closing RADIUS pss configurationMar 5 00:51:13 securityd: opening radius configuration for group:defaultMar 5 00:51:13 securityd: opened the configuration successfullyMar 5 00:51:13 securityd: GETNEXT request for radius index:0 addr:Mar 5 00:51:18 securityd: sending data to 171.71.49.197Mar 5 00:51:18 securityd: waiting for response from 171.71.49.197Mar 5 00:51:23 securityd: sending data to 171.71.49.197Mar 5 00:51:23 securityd: waiting for response from 171.71.49.197Mar 5 00:51:28 securityd: sending data to 171.71.49.197Mar 5 00:51:28 securityd: waiting for response from 171.71.49.197Mar 5 00:51:33 securityd: trying out next serverMar 5 00:51:33 securityd: no response from RADIUS server for authentication user002Mar 5 00:51:33 securityd: doing local chap authentication for user002Mar 5 00:51:33 securityd: local chap authentication result for user002:user not presentTroubleshooting Dynamic iSCSI Configuration
A physical Fibre Channel target (target pWWN) presented as an iSCSI target, makes the physical target accessible to an iSCSI initiator. The IPS module presents physical Fibre Channel targets as iSCSI targets to iSCSI initiators in one of two ways: dynamic mapping or static mapping.
By default, the IPS module does not automatically import Fibre Channel targets. Either dynamic or static mapping must be configured before the IPS module makes Fibre Channel targets available to iSCSI initiators. When both are configured, statically mapped Fibre Channel targets have the configured name. Targets that are not mapped will be advertised with the name created by the conventions explained in this section.
Checking the Configuration
Use the following guidelines to verify the configuration of the Gigabit Ethernet interface.
•
•
–
–
interface Gigabit Ethernet 3/1no shutdown...interface iscsi 3/1no shutdown•
•
Note
•
Performing Basic Dynamic iSCSI Troubleshooting
Use the following guidelines to perform basic dynamic iSCSI troubleshooting:
•
–
–
•
•
Useful Show Commands to Debug Dynamic iSCSI Configuration
The show commands in this section are used to debug dynamic iSCSI configuration. The following command output indicates correctly established iSCSI sessions. Run these commands on your switch and compare the output with these samples to help identify possible issues.
•
•
•
•
•
•
•
show iscsi session detail Command Output
switch# show iscsi session detailInitiator iqn.1987-05.com.cisco.02.F984BCA7E08C307E2D87A099B2D452F3.FULLMOON (FULLMOON)Session #1 (index 2)Target iqn.com.domainname.IPS-TEST.02-07.gw.202300a0b80b14daVSAN 1, ISID 000000000000, TSID 134, Status active, no reservationType Normal, ExpCmdSN 44, MaxCmdSN 53, Barrier 0MaxBurstSize 0, MaxConn 0, DataPDUInOrder NoDataSeqInOrder No, InitialR2T Yes, ImmediateData NoRegistered LUN 0, Mapped LUN 0Stats:PDU: Command: 42, Response: 36Bytes: TX: 4960, RX: 0Number of connection: 1Connection #1Local IP address: 0xa021ec8, Peer IP address: 0xa021ecaCID 0, State: LOGGED_INStatSN 43, ExpStatSN 0MaxRecvDSLength 524288, our_MaxRecvDSLength 1024CSG 3, NSG 3, min_pdu_size 48 (w/ data 48)AuthMethod none, HeaderDigest None (len 0), DataDigest None (len 0)Version Min: 0, Max: 0FC target: Up, Reorder PDU: No, Marker send: No (int 0)Received MaxRecvDSLen key: Yesshow iscsi remote-node initiator Command Output
switch# show iscsi remote-node initiatoriSCSI Node name is iqn.1987-05.com.cisco.02.F984BCA7E08C307E2D87A099B2D452F3.FULLMOONiSCSI alias name: FULLMOONNode WWN is 20:0c:00:0b:be:77:72:42 (dynamic)Member of vsans: 1Number of Virtual n_ports: 1Virtual Port WWN is 20:0d:00:0b:be:77:72:42 (dynamic)Interface iSCSI 2/7, Portal group tag: 0x86VSAN ID 1, FCID 0x750105show iscsi local-node Command Output
switch# show iscsi local-nodetarget: iqn.com.domainname.IPS-TEST.02-07.gw.202300a0b80b14daPort WWN 20:23:00:a0:b8:0b:14:da , VSAN 1Auto-created nodeshow fcns data vsan 1 Command Output
switch# show fcns data vsan 1VSAN 1:-----------------------------------------------------------------------FCID TYPE PWWN (VENDOR) FC4-TYPE:FEATURE-----------------------------------------------------------------------0x750000 N 20:23:00:a0:b8:0b:14:da (SymBios) scsi-fcp:target0x750102 N 10:00:00:00:c9:30:ba:06 (Emulex) scsi-fcp:init0x750105 N 20:0d:00:0b:be:77:72:42 scsi-fcp:init isc..w0x750201 N 50:08:05:f3:00:04:96:71 scsi-fcp0x750301 N 50:08:05:f3:00:04:96:79 scsi-fcp0x750400 N 20:00:00:02:3d:07:05:c0 (NuSpeed) scsi-fcp:initshow flogi database vsan 1 Command Output
switch# show flogi database vsan 1-----------------------------------------------------------INTERFACE VSAN FCID PORT NAME NODE NAME-----------------------------------------------------------fc1/1 1 0x750400 20:00:00:02:3d:07:05:c0 10:00:00:02:3d:07:05:c0fc1/6 1 0x750000 20:23:00:a0:b8:0b:14:da 20:22:00:a0:b8:0b:14:d9fc1/8 1 0x750102 10:00:00:00:c9:30:ba:06 20:00:00:00:c9:30:ba:06fc1/9 1 0x750201 50:08:05:f3:00:04:96:71 50:08:05:f3:00:04:96:70fc1/10 1 0x750301 50:08:05:f3:00:04:96:79 50:08:05:f3:00:04:96:70iscsi2/7 1 0x750105 20:0d:00:0b:be:77:72:42 20:0c:00:0b:be:77:72:42Virtual Target Access Control
Use the following guidelines when creating a virtual target:
•
•
•
•
Useful Show Commands to Debug Static iSCSI Configuration
The show commands in this section are used to debug static iSCSI configuration. The following command output indicates correctly established iSCSI sessions. Run these commands on your switch and compare the output with these samples to help identify possible issues.
•
•
•
•
•
•
show iscsi session detail Command Output
switch# show iscsi session detailInitiator iqn.1987-05.com.cisco.02.8cb3c18879bf356ce18e09679103235f.my-kayak (MY-KAYAK)Session #1 (index 84)Target iqn.com.domainname.IPS-TEST.02-08.gw.2200002037c52d6dVSAN 5, ISID 00023d000054, TSID 135, Status active, no reservationType Normal, ExpCmdSN 1356, MaxCmdSN 1366, Barrier 0MaxBurstSize 0, MaxConn 0, DataPDUInOrder NoDataSeqInOrder No, InitialR2T Yes, ImmediateData NoRegistered LUN 0, Mapped LUN 0Stats:PDU: Command: 13, Response: 13Bytes: TX: 1344, RX: 0Number of connection: 1Connection #1Local IP address: 0xa011d64, Peer IP address: 0xa011d65CID 0, State: LOGGED_INStatSN 1356, ExpStatSN 0MaxRecvDSLength 524288, our_MaxRecvDSLength 1392CSG 3, NSG 3, min_pdu_size 48 (w/ data 48)AuthMethod none, HeaderDigest None (len 0), DataDigest None (len 0)Version Min: 0, Max: 0FC target: Up, Reorder PDU: No, Marker send: No (int 0)Received MaxRecvDSLen key: YesSession #2 (index 85)Target iqn.com.domainname.IPS-TEST.02-08.gw.2200002037c52e2eVSAN 5, ISID 00023d000055, TSID 135, Status active, no reservationType Normal, ExpCmdSN 1356, MaxCmdSN 1366, Barrier 0MaxBurstSize 0, MaxConn 0, DataPDUInOrder NoDataSeqInOrder No, InitialR2T Yes, ImmediateData NoRegistered LUN 0, Mapped LUN 0Stats:PDU: Command: 13, Response: 13Bytes: TX: 1344, RX: 0Number of connection: 1Connection #1Local IP address: 0xa011d64, Peer IP address: 0xa011d65CID 0, State: LOGGED_INStatSN 1356, ExpStatSN 0MaxRecvDSLength 524288, our_MaxRecvDSLength 1392CSG 3, NSG 3, min_pdu_size 48 (w/ data 48)AuthMethod none, HeaderDigest None (len 0), DataDigest None (len 0)Version Min: 0, Max: 0FC target: Up, Reorder PDU: No, Marker send: No (int 0)Received MaxRecvDSLen key: YesSession #3 (index 86)Target iqn.com.domainname.IPS-TEST.02-08.gw.2200002037c52356VSAN 5, ISID 00023d000056, TSID 135, Status active, no reservationType Normal, ExpCmdSN 1356, MaxCmdSN 1366, Barrier 0MaxBurstSize 0, MaxConn 0, DataPDUInOrder NoDataSeqInOrder No, InitialR2T Yes, ImmediateData NoRegistered LUN 0, Mapped LUN 0Stats:PDU: Command: 13, Response: 13Bytes: TX: 1344, RX: 0Number of connection: 1Connection #1Local IP address: 0xa011d64, Peer IP address: 0xa011d65CID 0, State: LOGGED_INStatSN 1356, ExpStatSN 0MaxRecvDSLength 524288, our_MaxRecvDSLength 1392CSG 3, NSG 3, min_pdu_size 48 (w/ data 48)AuthMethod none, HeaderDigest None (len 0), DataDigest None (len 0)Version Min: 0, Max: 0FC target: Up, Reorder PDU: No, Marker send: No (int 0)Received MaxRecvDSLen key: YesSession #4 (index 87)Target iqn.com.domainname.IPS-TEST.02-08.gw.2200002037c5260aVSAN 5, ISID 00023d000057, TSID 135, Status active, no reservationType Normal, ExpCmdSN 1356, MaxCmdSN 1366, Barrier 0MaxBurstSize 0, MaxConn 0, DataPDUInOrder NoDataSeqInOrder No, InitialR2T Yes, ImmediateData NoRegistered LUN 0, Mapped LUN 0Stats:PDU: Command: 13, Response: 13Bytes: TX: 1344, RX: 0Number of connection: 1Connection #1Local IP address: 0xa011d64, Peer IP address: 0xa011d65CID 0, State: LOGGED_INStatSN 1356, ExpStatSN 0MaxRecvDSLength 524288, our_MaxRecvDSLength 1392CSG 3, NSG 3, min_pdu_size 48 (w/ data 48)AuthMethod none, HeaderDigest None (len 0), DataDigest None (len 0)Version Min: 0, Max: 0FC target: Up, Reorder PDU: No, Marker send: No (int 0)Received MaxRecvDSLen key: Yesshow iscsi stats Command Output
switch# show iscsi stats iscsi2/7iscsi2/75 minutes input rate 3336 bits/sec, 417 bytes/sec, 0 frames/sec5 minutes output rate 120 bits/sec, 15 bytes/sec, 0 frames/seciSCSI statistics4112871 packets input, 4022464380 bytes303100 Command pdus, 3740086 Data-out pdus, 3815901300 Data-out bytes, 0fragments1283306 packets output, 778111088 bytes303069 Response pdus (with sense 3163), 195108 R2T pdus715480 Data-in pdus, 715214528 Data-in bytesshow iscsi stats detail Command Output
switch# show iscsi stats detailiscsi2/75 minutes input rate 3336 bits/sec, 417 bytes/sec, 0 frames/sec5 minutes output rate 120 bits/sec, 15 bytes/sec, 0 frames/seciSCSI statistics4113028 packets input, 4022586092 bytes303140 Command pdus, 3740200 Data-out pdus, 3816015476 Data-out bytes, 0fragments1283382 packets output, 778114736 bytes303109 Response pdus (with sense 3163), 195141 R2T pdus715480 Data-in pdus, 715214528 Data-in bytesiSCSI Forward:Command: 303140 PDUs (Received: 303140)Data-Out (Write): 3740200 PDUs (Received 3740200), 0 fragments, 3816015476 bytesTMF Request: 0 (Received 28)FCP Forward:Xfer_rdy: 195141 (Received: 195141)Data-In: 715480 (Received: 715622), 715214528 bytesResponse: 303109 (Received: 303322), with sense 3163TMF Resp: 0iSCSI Stats:Login: attempt: 16726, succeed: 114, fail: 16606, authen fail: 0Rcvd: NOP-Out: 36164, Sent: NOP-In: 36160NOP-In: 0, Sent: NOP-Out: 0TMF-REQ: 28, Sent: TMF-RESP: 0Text-REQ: 39, Sent: Text-RESP: 0SNACK: 0Unrecognized Opcode: 0, Bad header digest: 0Command in window but not next: 0, exceed wait queue limit: 0Received PDU in wrong phase: 0FCP Stats:Total: Sent: 4110679Received: 1281518 (Error: 0, Unknown: 0)Sent: PLOGI: 66367, Rcvd: PLOGI_ACC: 71, PLOGI_RJT: 66296PRLI: 71, Rcvd: PRLI_ACC: 71, PRLI_RJT: 0, Error resp: 0LOGO: 0, Rcvd: LOGO_ACC: 0, LOGO_RJT: 0ABTS: 87, Rcvd: ABTS_ACC: 0TMF REQ: 0Self orig command: 213, Rcvd: data: 142, resp: 213Rcvd: PLOGI: 614, Sent: PLOGI_ACC: 490LOGO: 197, Sent: LOGO_ACC: 111PRLI: 0, Sent: PRLI_ACC: 0ABTS: 183iSCSI Drop:Command: Target down 0, Task in progress 0, LUN map fail 0CmdSeqNo not in window 0, No Exchange ID 0, Reject 0Persistent Resv 0 Data-Out: 0, TMF-Req: 0FCP Drop:Xfer_rdy: 0, Data-In: 0, Response: 0Buffer Stats:Buffer less than header size: 48475, Partial: 2524437, Split: 3550971Pullup give new buf: 48475, Out of contiguous buf: 0, Unaligned m_data: 0show fcns database Command Output
switch# show fcns data vsan 5VSAN 5:--------------------------------------------------------------------------FCID TYPE PWWN (VENDOR) FC4-TYPE:FEATURE--------------------------------------------------------------------------0x610002 N 20:0b:00:0b:be:77:72:42 scsi-fcp:init isc..w0x6101e1 NL 22:00:00:20:37:c5:2d:6d (Seagate) scsi-fcp:target0x6101e2 NL 22:00:00:20:37:c5:2e:2e (Seagate) scsi-fcp:target0x6101e4 NL 22:00:00:20:37:c5:23:56 (Seagate) scsi-fcp:target0x6101e8 NL 22:00:00:20:37:c5:26:0a (Seagate) scsi-fcp:targetTotal number of entries = 5show flogi database Command Output
switch# show flogi data vsan 5---------------------------------------------------------------------------INTERFACE VSAN FCID PORT NAME NODE NAME---------------------------------------------------------------------------fc1/12 5 0x6101e8 22:00:00:20:37:c5:26:0a 20:00:00:20:37:c5:26:0afc1/12 5 0x6101e4 22:00:00:20:37:c5:23:56 20:00:00:20:37:c5:23:56fc1/12 5 0x6101e2 22:00:00:20:37:c5:2e:2e 20:00:00:20:37:c5:2e:2efc1/12 5 0x6101e1 22:00:00:20:37:c5:2d:6d 20:00:00:20:37:c5:2d:6discsi2/8 5 0x610002 20:0b:00:0b:be:77:72:42 20:0a:00:0b:be:77:72:42Total number of flogi = 5.show iscsi remote-node iscsi-session-detail tcp-parameters Command Output
switch# show iscsi remote-node iscsi-session-detail tcp-parametersiSCSI Node name is iqn.1987-05.com.cisco.02.8cb3c18879bf356ce18e09679103235f.my-kayakiSCSI alias name: MY-KAYAKNode WWN is 20:0a:00:0b:be:77:72:42 (dynamic)Member of vsans: 5Number of Virtual n_ports: 1Virtual Port WWN is 20:0a:00:0b:be:77:72:42 (dynamic)Interface iSCSI 2/8, Portal group tag is 0x87VSAN ID 0, FCID 0x0No. of FC sessions: 1No. of iSCSI sessions: 1iSCSI session detailsTarget node:Statistics:PDU: Command: 0, Response: 0Bytes: TX: 0, RX: 0Number of connection: 1TCP parametersConnection Local 10.1.29.100:3260, Remote 10.1.29.101:1026Path MTU 1500 bytesCurrent retransmission timeout is 310 msRound trip time: Smoothed 179 ms, Variance: 33Advertized window: Current: 62 KB, Maximum: 62 KB, Scale: 0Peer receive window: Current: 63 KB, Maximum: 63 KB, Scale: 0Congestion window: Current: 63 KBVSAN ID 5, FCID 0x610002No. of FC sessions: 4No. of iSCSI sessions: 4iSCSI session detailsTarget node: iqn.com.domainname.IPS-TEST.02-08.gw.2200002037c5260aStatistics:PDU: Command: 13, Response: 13Bytes: TX: 1344, RX: 0Number of connection: 1TCP parametersConnection Local 10.1.29.100:3260, Remote 10.1.29.101:1048Path MTU 1500 bytesCurrent retransmission timeout is 300 msRound trip time: Smoothed 165 ms, Variance: 35Advertized window: Current: 61 KB, Maximum: 62 KB, Scale: 0Peer receive window: Current: 63 KB, Maximum: 63 KB, Scale: 0Congestion window: Current: 63 KBTarget node: iqn.com.domainname.IPS-TEST.02-08.gw.2200002037c5260aStatistics:PDU: Command: 13, Response: 13Bytes: TX: 1344, RX: 0Number of connection: 1TCP parametersConnection Local 10.1.29.100:3260, Remote 10.1.29.101:1048Path MTU 1500 bytesCurrent retransmission timeout is 300 msRound trip time: Smoothed 165 ms, Variance: 35Advertized window: Current: 61 KB, Maximum: 62 KB, Scale: 0Peer receive window: Current: 63 KB, Maximum: 63 KB, Scale: 0Congestion window: Current: 63 KBTarget node: iqn.com.domainname.IPS-TEST.02-08.gw.2200002037c5260aStatistics:PDU: Command: 13, Response: 13Bytes: TX: 1344, RX: 0Number of connection: 1TCP parametersConnection Local 10.1.29.100:3260, Remote 10.1.29.101:1048Path MTU 1500 bytesCurrent retransmission timeout is 300 msRound trip time: Smoothed 165 ms, Variance: 35Advertized window: Current: 61 KB, Maximum: 62 KB, Scale: 0Peer receive window: Current: 63 KB, Maximum: 63 KB, Scale: 0Congestion window: Current: 63 KBTarget node: iqn.com.domainname.IPS-TEST.02-08.gw.2200002037c5260aStatistics:PDU: Command: 13, Response: 13Bytes: TX: 1344, RX: 0Number of connection: 1TCP parametersConnection Local 10.1.29.100:3260, Remote 10.1.29.101:1048Path MTU 1500 bytesCurrent retransmission timeout is 300 msRound trip time: Smoothed 165 ms, Variance: 35Advertized window: Current: 61 KB, Maximum: 62 KB, Scale: 0Peer receive window: Current: 63 KB, Maximum: 63 KB, Scale: 0Congestion window: Current: 63 KBiSCSI TCP Performance Issues
Generally there are two segments that effect the iSCSI performance. First is the Fibre Channel side flow control mechanism, buffer to buffer credits (BB_credits), Fibre Channel maximum frame size. Second is the TCP/IP side segment.
As in all TCP/IP-related throughput issues, the most important criteria are the Receive/Send Window Sizes on both TCP endpoints, RTT (round trip time), actual available bandwidth between the TCP peers, the MSS (maximum segment size), and the support for higher MTUs between the peers.
CLI Commands Used to Access Performance Data
Use the following CLI commands to access performance data.
•
•
•
•
•
•
Understanding TCP Parameters for iSCSI
The default MTU size of an Ethernet network is 1500, while the Fibre Channel networks generally support maximum frame sizes of 2148 bytes. This means that an iSCSI gateway must divide the Fibre Channel frames into two TCP segments or IP fragments while transferring from the Fibre Channel side to the IP side depending on how this division is implemented within the device.
This section refers to the scenario in Figure 20-13.
Figure 20-13 IPS Window Scaling
The IPS module adjusts the Receive Data Field Size that it advertises to its Fibre Channel partner, according to the MTU that is configured on the corresponding Gigabit Ethernet port of an iSCSI client.
If left to the default MTU size, the Fibre Channel frame size from the target device is decreased to match the maximum Ethernet frame size, so the switching of the packet through the switch is faster. One point of performance tuning is to increase the MTU of the IP network between the peers.
Jumbo support was enabled for the IPS ports, and the MTU for the VLAN corresponding to these ports was increased.
The second point of performance tuning is to increase the TCP window size of the iSCSI endpoints. Depending on the latency between the iSCSI client and the IPS, this will need fine tuning. The switch's iSCSI configuration defines the TCP window size in kilobytes.
Any value starting with 64K (> 65535 = 0xFFFF bytes) will automatically trigger TCP window scaling according to RFC 1323. The IPS TCP window scaling begins only when the remote peer (iSCSI client in this case) requests it. This means that you need to configure the TCP stack of your client to trigger this functionality (see Figure 20-13).
For the Fibre Channel side, depending on the direction of the traffic, the BB_credit of the ports corresponding to the input interfaces (sending/receiving traffic to/from the iSCSI side) could be increased, especially in the case of local Gigabit Ethernet attached iSCSI clients.
Lab Setup
This is the lab setup that was used in collecting the performance-related information.
•
•
•
•
•
–
–
Configuring from the Bottom Switch Using the CLI
The following example is the configuration for the 9216 switch shown in Figure 20-13.
iscsi initiator name iqn.1987-05.com.cisco:02.75af2f95624c.shark-naspWWN 20:05:00:0c:30:6c:24:42vsan 777vsan 778iscsi virtual-target name shark_naspWWN 50:05:07:63:00:c8:94:4c fc-lun 0000 iscsi-lun 0000 secondary-pwwn 50:05:07:63:00:c4:94:4cpWWN 50:05:07:63:00:c8:94:4c fc-lun 0001 iscsi-lun 0001 secondary-pwwn 50:05:07:63:00:c4:94:4cinitiator iqn.1987-05.com.cisco:02.75af2f95624c.shark-nas permitinterface GigabitEthernet2/1ip address 10.48.69.251 255.255.255.192iscsi authentication noneno shutdownvrrp 1priority 110address 10.48.69.250(This is the iSCSI target IP address for the Windows iSCSI client.)
no shutdowninterface iscsi2/1tcp pmtu-enabletcp window-size 1024(To increase the receive window size of the IPS module (in kilobytes).)
tcp sack-enableno shutdownVerifying Connectivity Between Client and IPS iSCSI Service
The following example verifies the connectivity between the client and the IPS iSCSI service:
MDS_BOTTOM# show ips stats tcp interface gigabitethernet 2/1TCP Statistics for port GigabitEthernet2/1Connection Stats0 active openings, 24 accepts0 failed attempts, 0 reset received, 24 establishedSegment stats7047380 received, 56080130 sent, 0 retransmitted0 bad segments received, 0 reset sentTCP Active ConnectionsLocal Address Remote Address State Send-Q Recv-Q10.48.69.250:3260 10.48.69.233:1026 ESTABLISH 0 010.48.69.250:3260 10.48.69.233:1057 ESTABLISH 34560 00.0.0.0:3260 0.0.0.0:0 LISTEN 0 0MDS_BOTTOM# show flogi database vsan 777---------------------------------------------------------------------------INTERFACE VSAN FCID PORT NAME NODE NAME---------------------------------------------------------------------------fc1/3 777 0x610000 50:05:07:63:00:c8:94:4c 50:05:07:63:00:c0:94:4ciscsi2/1 777 0x610001 20:05:00:0c:30:6c:24:42 20:00:00:0c:30:57:5e:c2Total number of flogi = 2.MDS_BOTTOM# show fcns dabase vsan 777VSAN 777:--------------------------------------------------------------------------FCID TYPE PWWN (VENDOR) FC4-TYPE:FEATURE--------------------------------------------------------------------------0x610000 N 50:05:07:63:00:c8:94:4c (IBM) scsi-fcp:target fc..0x610001 N 20:05:00:0c:30:6c:24:42 scsi-fcp:init isc..wTotal number of entries = 2MDS_BOTTOM#MDS_BOTTOM# show moduleMod Ports Module-Type Model Status--- ----- ------------------------------- ------------------ ------------1 16 1/2 Gbps FC/Supervisor DS-X9216-K9-SUP active *2 8 IP Storage Module DS-X9308-SMIP okMod Sw Hw World-Wide-Name(s) (WWN)--- ----------- ------ --------------------------------------------------1 1.1(0.133c) 1.0 20:01:00:0c:30:57:5e:c0 to 20:10:00:0c:30:57:5e:c02 1.1(0.133c) 0.2 20:41:00:0c:30:57:5e:c0 to 20:48:00:0c:30:57:5e:c0Mod MAC-Address(es) Serial-Num--- -------------------------------------- ----------1 00-0b-be-f8-7f-00 to 00-0b-be-f8-7f-04 JAB070804Q32 00-05-30-00-a8-56 to 00-05-30-00-a8-62 JAB070205am* this terminal sessionMDS_BOTTOM# show iscsi remoteiSCSI Node name is iqn.1987-05.com.cisco:02.75af2f95624c.shark-nasiSCSI alias name: SHARK-NASNode WWN is 20:00:00:0c:30:57:5e:c2 (dynamic)Member of vsans: 777, 778Number of Virtual n_ports: 1Virtual Port WWN is 20:05:00:0c:30:6c:24:42 (configured)Interface iSCSI 2/1, Portal group tag: 0x1001VSAN ID 778, FCID 0x7c0000VSAN ID 777, FCID 0x610001MDS_BOTTOM# show iscsi localtarget: shark_nasPort WWN 50:05:07:63:00:c8:94:4c(This is the port of the Shark connected to MDS 9216_Bottom.)
Secondary PWWN 50:05:07:63:00:c4:94:4c(This is the port of the Shark connected to MDS 9216_Top.)
Configured nodeNo. of LU mapping: 2iSCSI LUN: 0000, FC LUN: 0000iSCSI LUN: 0001, FC LUN: 0001No. of initiators permitted: 1initiator iqn.1987-05.com.cisco:02.75af2f95624c.shark-nas is permittedall initiator permit is disabledMDS_BOTTOM#MDS_BOTTOM# show interface iscsi 2/1iscsi2/1 is upHardware is GigabitEthernetPort WWN is 20:41:00:0c:30:57:5e:c0Admin port mode is ISCSIPort mode is ISCSISpeed is 1 GbpsNumber of iSCSI session: 2, Number of TCP connection: 2Configured TCP parametersLocal Port is 3260PMTU discover is enabled (default)(This is especially required if there are devices without jumbo support in the path. The initial TCP 3-way handshake will establish a session with a high MSS value (provided both the IPS module and the iSCSI client are configured or capable) even if there are devices without jumbo frame support in the path. Without PMTU discovery, there will be problems.)
Keepalive-timeout 60Initial-retransmit-time 300(If there is high delay between the peers, this parameter that can be adjusted. There's no real formula; instead use trial and error to find the optimum value for your network. Try lower values as well as higher ones, and get hints from the show ips stats tcp output.)
Max-retransmissions 8Window-size 1024000Sack is enabledForwarding mode: pass-thru5 minutes input rate 410824 bits/sec, 51353 bytes/sec, 1069 frames/sec5 minutes output rate 581291520 bits/sec, 72661440 bytes/sec, 53302 frames/seciSCSI statistics1072393 packets input, 51482588 bytes1072305 Command pdus, 0 Data-out pdus, 0 Data-out bytes, 0 fragments53430805 packets output, 72837086312 bytes1072273 Response pdus (with sense 9), 0 R2T pdus52358444 Data-in pdus, 70272402880 Data-in bytesMDS_BOTTOM# show iscsi remote initiator iqn.1987-05.com.cisco:02.75af2f95624c.shark-nas iscsi tcpiSCSI Node name is iqn.1987-05.com.cisco:02.75af2f95624c.shark-nasiSCSI alias name: SHARK-NASNode WWN is 20:00:00:0c:30:57:5e:c2 (dynamic)Member of vsans: 777, 778Number of Virtual n_ports: 1Virtual Port WWN is 20:00:00:0c:30:57:5e:c2 (configured)Interface iSCSI 2/1, Portal group tag is 0x1001VSAN ID 0, FCID 0x 0No. of FC sessions: 1No. of iSCSI sessions: 1iSCSI session detailsTarget node:Statistics:PDU: Command: 0, Response: 0Bytes: TX: 0, RX: 0Number of connection: 1TCP parametersLocal 10.48.69.250:3260, Remote 10.48.69.233:1026Path MTU: 1500 bytesRetransmission timeout: 300 msRound trip time: Smoothed 150 ms, Variance: 31Advertized window: Current: 998 KB, Maximum: 1000 KB, Scale: 4Peer receive window: Current: 1000 KB, Maximum: 1000 KB, Scale: 4Congestion window: Current: 12 KBVSAN ID 777, FCID 0x610001No. of FC sessions: 1No. of iSCSI sessions: 1iSCSI session detailsTarget node: shark_nasStatistics:PDU: Command: 392051, Response: 392042Bytes: TX: 25692593152, RX: 0Number of connection: 1TCP parametersLocal 10.48.69.250:3260, Remote 10.48.69.233:1057Path MTU: 1500 bytesRetransmission timeout: 300 msRound trip time: Smoothed 2 ms, Variance: 1(Watch out for these numbers. The output is for a TCP session that goes only through one Gigabit Ethernet switch. When there are multiple router hops, as well as WAN links in the middle, the RTT will grow, and the variance will fluctuate with higher values. You may need to adjust the retransmission timeout.)
Advertized window: Current: 1000 KB, Maximum: 1000 KB, Scale: 4(This is the window size set on the Windows client. See Figure 20-14.)
Peer receive window: Current: 1000 KB, Maximum: 1000 KB, Scale: 4(This is the window size set on the IPS iSCSI interface. See Figure 20-14.)
Figure 20-14 Congestion Window: Current: 24 kB
TCP Parameter Changes
To change TCP parameters in the Windows registry, use the registry parameters shown in Figure 20-14 as an example.
Setting the Tcp1323Opts (circled in green) to 3, sets two bits on, one for window scaling and the other for the time-stamp option. We are only interested in the window scaling here.
Caution
Displaying the Gigabit Ethernet Interface
Choose Switches > Interfaces > Gigabit Ethernet using Fabric Manager to view the Gigabit Ethernet status.
Or use the show interface CLI command to view the Gigabit Ethernet status (see Example 20-2).
Example 20-2 Annotated Output of show interface gigabitethernet CLI Command
MDS_BOTTOM# show interface gigabitethernet 2/1GigabitEthernet2/1 is upHardware is GigabitEthernet, address is 0005.3000.a85aInternet address is 10.48.69.251/26MTU 1500 bytes, BW 1000000 KbitPort mode is IPSSpeed is 1 GbpsBeacon is turned off5 minutes input rate 3957384 bits/sec, 494673 bytes/sec, 6716 frames/sec5 minutes output rate 609420144 bits/sec, 76177518 bytes/sec, 53267 frames/sec6979248 packets input, 514206826 bytes0 multicast frames, 0 compressed0 input errors, 0 frame, 0 overrun 0 fifo55551272 packets output, 79456286344 bytes, 0 underruns0 output errors, 0 collisions, 0 fifo0 carrier errorsBetter throughput can be achieved if the MTU of both the client NIC and the IPS Gigabit Ethernet interface is changed to a higher MTU, provided the network in the middle supports jumbo frames.
Use the show ips stats tcp CLI command to view TCP statistics (see Example 20-3). If the retransmitted value in the segment continues to increase, it shows that either the IP network in the middle has issues or the TCP peer has problems acknowledging the data that the IPS sends to it. If the MTU of this interface is higher than the MSS of the iSCSI client, then the split packets value increases. For example, the client MTU default is 1500, which equates to an MSS value of 1460, but the IPS Gigabit Ethernet MTU changed to 2500.
Example 20-3 show ips stats tcp Command Output
MDS_BOTTOM# show ips stats tcp interface gigabit 2/1 detailTCP Statistics for port GigabitEthernet2/1TCP send stats56252632 segments, 76746280484 bytes56100434 data, 152173 ack only packets1 control (SYN/FIN/RST), 0 probes, 24 window updates0 segments retransmitted, 0 bytes0 retransmitted while on ethernet send queue, 0 packets split3 delayed acks sentTCP receive stats7068115 segments, 1061853 data packets in sequence, 54245464 bytes in sequence0 predicted ack, 187 predicted data0 bad checksum, 0 multi/broadcast, 0 bad offset0 no memory drops, 0 short segments0 duplicate bytes, 0 duplicate packets0 partial duplicate bytes, 0 partial duplicate packets0 out-of-order bytes, 0 out-of-order packets0 packet after window, 0 bytes after window0 packets after close7067879 acks, 76746255713 ack bytes, 0 ack toomuch, 21 duplicate acks0 ack packets left of snd_una, 0 non-4 byte aligned packets5980106 window updates, 0 window probe50 pcb hash miss, 0 no port, 0 bad SYN, 0 paws dropsTCP Connection Stats0 attempts, 24 accepts, 24 established22 closed, 2 drops, 0 conn drops0 drop in retransmit timeout, 0 drop in keepalive timeout0 drop in persist drops, 0 connections drainedTCP Miscellaneous Stats7054414 segments timed, 7067879 rtt updated0 retransmit timeout, 0 persist timeout19 keepalive timeout, 19 keepalive probesTCP SACK Stats0 recovery episodes, 54218621 data packets, 77791012992 data bytes0 data packets retransmitted, 0 data bytes retransmitted1 connections closed, 0 retransmit timeoutsTCP SYN Cache Stats24 entries, 24 connections completed, 0 entries timed out0 dropped due to overflow, 0 dropped due to RST0 dropped due to ICMP unreach, 0 dropped due to bucket overflow0 abort due to no memory, 0 duplicate SYN, 2 no-route SYN drop0 hash collisions, 0 retransmittedTCP Active ConnectionsLocal Address Remote Address State Send-Q Recv-Q10.48.69.250:3260 10.48.69.233:1026 ESTABLISH 0 010.48.69.250:3260 10.48.69.233:1057 ESTABLISH 29296 00.0.0.0:3260 0.0.0.0:0 LISTEN 0 0Use the show iscsi remote-node fcp-session-detail CLI command to view details of the session status. (See Example 20-4.) The RcvDataFieldSize will be set to the maximum 2048 if the MTU is increased on the Gigabit Ethernet interface that corresponds to this iSCSI remote node. Use the Target FCID field to verify that the local port, rather than a remote port that is reached through an ISL link, is used for the storage target to avoid suboptimal access to storage.
Example 20-4 show iscsi remote-node fcp-session-detail Command Output
MDS_BOTTOM# show iscsi remote-node fcp-session-detailiSCSI Node name is iqn.1987-05.com.cisco:02.75af2f95624c.shark-nasiSCSI alias name: SHARK-NASNode WWN is 20:00:00:0c:30:6c:24:42 (dynamic)Member of vsans: 777, 778Number of Virtual n_ports: 1Virtual Port WWN is 20:00:00:0c:30:6c:24:42 (configured)Interface iSCSI 2/1, Portal group tag is 0x1001VSAN ID 0, FCID 0x610001No. of FC sessions: 1No. of iSCSI sessions: 1FCP Session detailsTarget FCID: 0x000000 (S_ID of this session: 0x000000)pWWN: 00:00:00:00:00:00:00:00nWWN: 00:00:00:00:00:00:00:00Session state: INIT1 iSCSI sessions share this FC sessionTarget:Negotiated parametersRcvDataFieldSize 2048 our_RcvDataFieldSize 1392MaxBurstSize 0, EMPD: FALSERandom Relative Offset: FALSE, Sequence-in-order: YesStatistics:PDU: Command: 0, Response: 0VSAN ID 777, FCID 0x610001No. of FC sessions: 1No. of iSCSI sessions: 1FCP Session detailsTarget FCID: 0x610000 (S_ID of this session: 0x610001)pWWN: 50:05:07:63:00:c8:94:4cnWWN: 50:05:07:63:00:c8:94:4cSession state: LOGGED_IN1 iSCSI sessions share this FC sessionTarget: shark_nasNegotiated parametersRcvDataFieldSize 2048 our_RcvDataFieldSize 1392MaxBurstSize 0, EMPD: FALSERandom Relative Offset: FALSE, Sequence-in-order: YesStatistics:PDU: Command: 0, Response: 1612007Verifying that the Host Is Configured for High MTU or MSS with the CLI
To get the real benefit of an increased MTU and higher Fibre Channel frame size, the path between the iSCSI client and the IPS iSCSI interface (as well as the host NIC) has to be capable of supporting this high MTU.
If you do not have access to the host, one way to see if the host is also configured for high MTU/MSS (as well as the path in the middle) is to check the split packets field in the show ips stats tcp display.
However this is a generic display for all TCP sessions. That is, if you have some hosts with high MTU-capable NICs, and some others without, it may be difficult to assess which is which. (See Example 20-5.)
Example 20-5 Sample Output for Low Packet Split Count
MDS_Top# show ips stats tcp interface gigabitethernet 2/1 detail (truncated output)TCP Statistics for port GigabitEthernet2/1TCP send stats10 segments, 240 bytes5 data, 5 ack only packets0 control (SYN/FIN/RST), 0 probes, 0 window updates0 segments retransmitted, 0 bytes0 retransmitted while on ethernet send queue, 0 packets split...TCP Active ConnectionsLocal Address Remote Address State Send-Q Recv-Q10.48.69.250:3260 10.48.69.233:1026 ESTABLISH 0 010.48.69.250:3260 10.48.69.233:1040 ESTABLISH 0 00.0.0.0:3260 0.0.0.0:0 LISTEN 0 0Afterward, traffic starts flowing from the FC storage towards the server that is connected via iSCSI to the IPS.
Example 20-6 Sample Output for Large Packet Split Count
MDS_Top# show ips stats tcp interface gigabitethernet 2/1 detailTCP Statistics for port GigabitEthernet2/1TCP send stats715535 segments, 943511612 bytes712704 data, 2831 ack only packets0 control (SYN/FIN/RST), 0 probes, 0 window updates0 segments retransmitted, 0 bytes0 retransmitted while on ethernet send queue, 345477 packets split...iSLB Issues
This section describes common troubleshooting issues for iSLB and includes the following topics:
•
•
•
•
•
•
•
•
•
•
•
•
•
•
iSLB Configuration Not Distributed to All Switches in the Fabric
Symptom iSLB configuration is not distributed to all switches in the fabric.
iSCSI Initiator and Virtual Target Configuration Not Distributed
Symptom iSCSI initiator and virtual target configuration is not distributed to the fabric.
iSLB Configuration, Commit, or Merge Failed—"VSAN ID is Not Yet Configured"
Symptom iSLB configuration, commit, or merge failed with error VSAN ID is not yet configured.
iSLB Configuration, Commit, or Merge Failed—"Failed to Allocate WWN"
Symptom iSLB configuration, commit, or merge failed with error Failed to allocate WWN.
iSLB Configuration, Commit, or Merge Failed—"Duplicate WWN Found as..."
Symptom iSLB configuration, commit, or merge failed with error Duplicate WWN found as ..
iSLB Configuration, Commit, or Merge Failed—"Duplicate Node Name"
Symptom iSLB configuration, commit, or merge failed with error Duplicate node name.
iSLB Configuration Failed—"Pending iSLB CFS Config Has Reached Its Limit..."
Symptom iSLB configuration failed with error Pending iSLB CFS config has reached its limit..
iSCSI Disable Failed—"Cannot Disable Iscsi - Large Iscsi Config Present..."
Symptom iSCSI disable failed with error Cannot disable iSCSI - large iSCSI config present.
iSLB Commit Timeout
Symptom iSLB commit timeout.
Session Down—"pWWN in Use At Remote Switch"
Symptom Session down with error pWWN in use at remote switch.
Redirected Session Does Not Come Up
Symptom Redirected session does not come up.
iSLB Zones Not Present in Active Zone Set
Symptom iSLB zones not present in active zone set.
Table 20-12 iSLB Zones Not Present in Active Zone Set
iSLB zones not present in active zone set.
Active zone set not configured.
Check if an active zone set is configured. If this is not the case then create and activate a new zone set for the VSAN in question. Then use the islb zoneset activate CLI command to trigger iSLB zoning.
Zone set activation failed.
If an active zone set is configured, then check for activation failures. See the "Traffic Description After iSLB Commit or Activation of Zone Set" section.
Traffic Description After iSLB Commit or Activation of Zone Set
Symptom Traffic description after iSLB commit or activation of zone set (normal, IVR, or iSLB).
VRRP Master Overutilized
Symptom VRRP master is overutilized.
iSLB Zone Set Activation Failed
Symptom iSLB zone set activation failed.
iSLB CFS Commit Fails
Symptom iSLB CFS commit fails.
Resolving an iSLB Merge Failure
To resolve an iSLB merge failure using the CLI, follow these steps:
Step 1
Step 2
Step 3
Note