|
Step 1
|
Select . The Path Query dashboard appears.
|
|
Step 2
|
Click + New Query. The New Path Query window appears, with query parameters displayed on the right and the topology map, with the mapped Device Groups, on the
left.
|
|
Step 3
|
Enter the device information in the required fields to find available native SR IGP service paths:
-
Select the Headend device from the list. For this example, select P-Edge-A1
-
Select the Endpoint device from the list. For this example, select P-Edge-B2
|
|
Step 4
|
Click Get Paths. The Running Query ID pop-up appears, indicating that Crosswork is processing your query.
Path queries can take time to complete. While your query is running: f you want to review past queries select View Past Queries. Crosswork redisplays the Path Query dashboard. If you already had path queries in the list, you can view them while your new query continues to run in the background
(indicated by the blue Running icon in the Query State column). When the new query's state turns green, click on the entry for it in the dashboard to view your results
|
|
Step 5
|
When the pop-up changes to show that your query was successful, click View Results. The Path Details panel appears, with corresponding Available Paths details displayed below your Headend and Endpoint selections. Each found path will appear in its own section in the Available Paths portion of the panel. Meanwhile, the topology map on the left is filtered to display only the nodes and paths participating
in the Available Paths.
|
|
Step 6
|
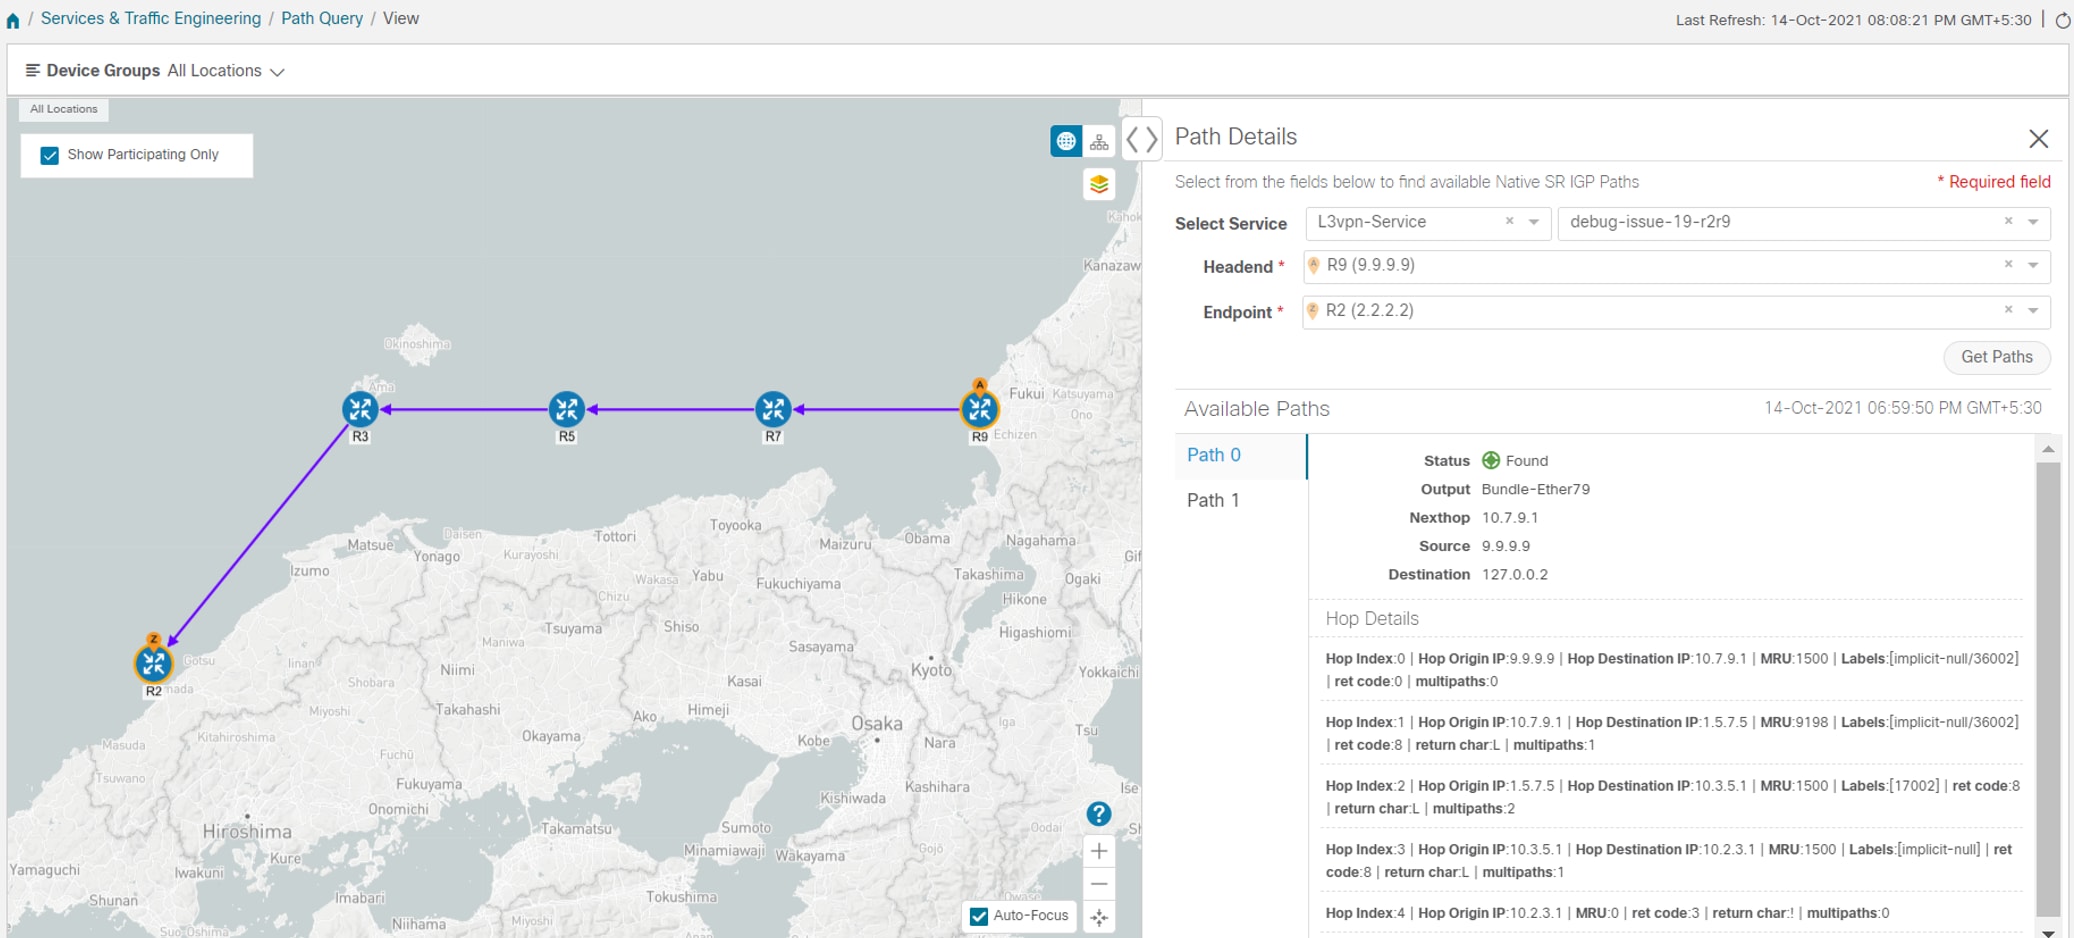
Click on the Available Paths option whose details you want to review (for example, click Path 0 or Path 1). Crosswork Status details for Output, Nexthop, Source, Destination, and Hop Index information. When you select one of the
available paths, the map will update with the corresponding Device Groups topology mapping of Path 0 and Path 1.
|
Note
|
Ensure that the Show Participating Only check box is selected in the top-right corner of the map.
|
|
Note
|
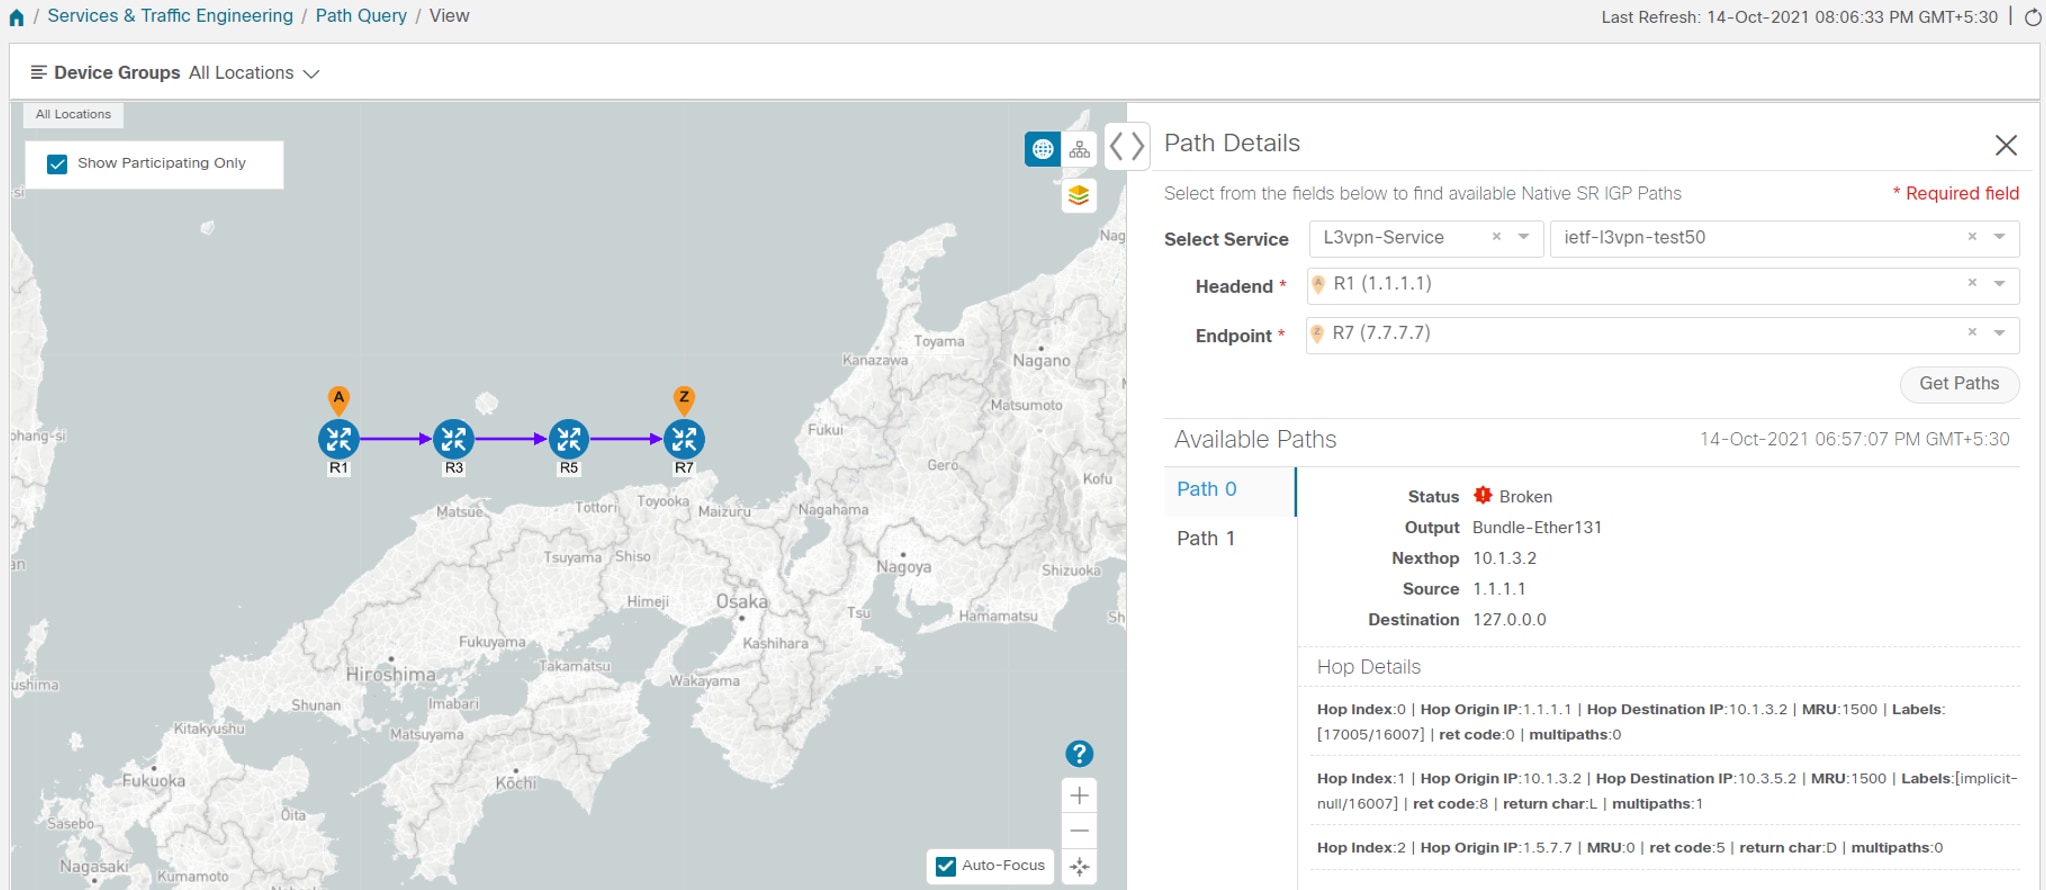
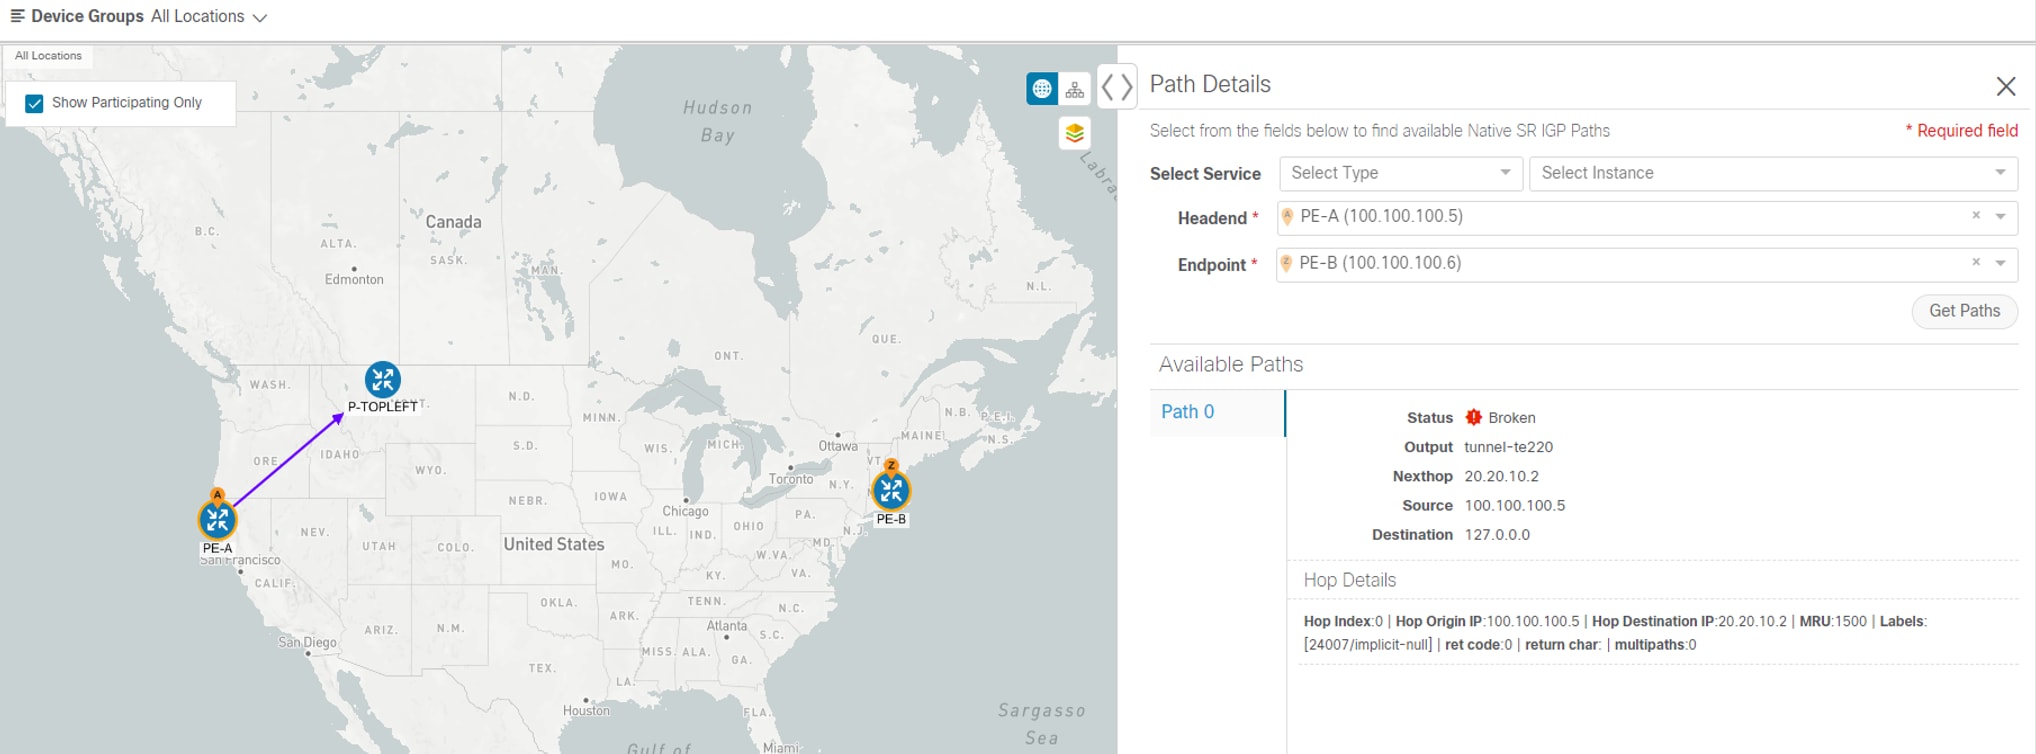
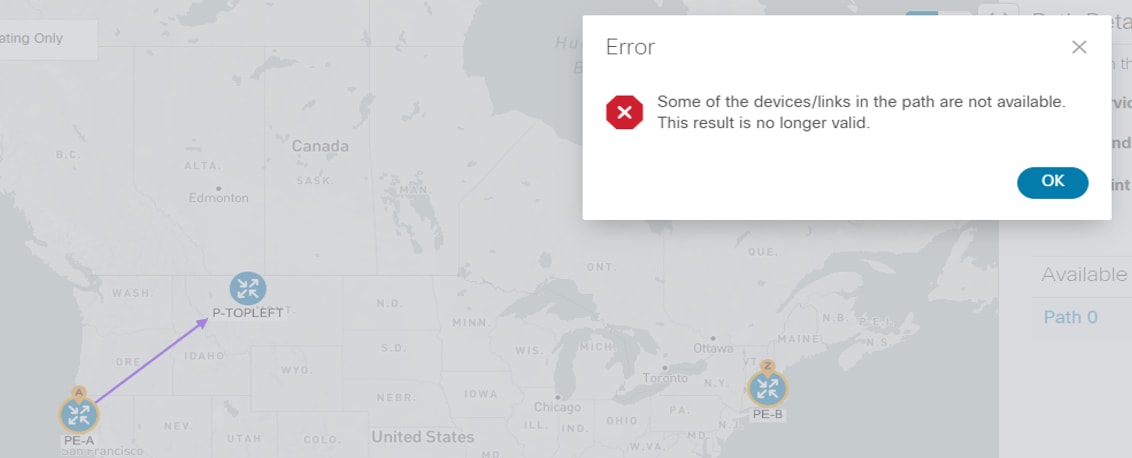
There are three likely status outcomes to a path query. The screen captures below are independent examples not directly associated
with the scenario’s workflow:
|
-
Non-Broken Path (path is complete): Path Status shows as Found with path hop details and overlay shown.
-
Broken Path (Path is complete): Path Status shows as Broken with path hop details and overlay shown.
-
Broken Path (Path is not complete): Path Status shows as Broken with path hop details partially shown (depending on gNMI output for traceroute – see Step 17
for troubleshooting details) and overlay details partially shown. An Error message will appear indicating that the devices
and links are not available.
|
|
Step 7
|
Select Services & Traffic Engineering > Path Query to return to the Path Query dashboard.
|
|
Step 8
|
Ensure that the new path Query State column shows as completed with a green icon. The new path in the table will also show
a Query ID link, both the corresponding Headend and destination Endpoint, and the Available Paths column will show 2 for both
paths.
If a query state is broken, see the last step in the workflow for troubleshooting details.
|
|
Step 9
|
As needed, click on the Query ID link or click  and select View Details to again review the Path Details panel and map. and select View Details to again review the Path Details panel and map.
|
|
Step 10
|
Create additional path queries by selecting Services & Traffic Engineering > Path Query. The Path Query Dashboard appears where the previous path queries are listed by Query ID.
|
Note
|
Make sure to set the Automatically delete query older than every < X > option within the number of hours needed from the Path Query Dashboard. The maximum number of hours provided is 24.
|
|
|
Step 11
|
Click New Query. The New Path Query panel appears on the right with the mapped Device Groups panel on the left.
|
|
Step 12
|
For Select Service, select the Type from the list. In this example, select L2VPN-SERVICE.
By utilizing Select Service, when you later select the Headend and Endpoint, the options are conveniently identified according
to the relevant VPN service type.
|
|
Step 13
|
For Select Service, select the Instance from the list. In this example, select L2VPN_NM_P2P-NATIVE-210.
The topology map will update to show the path between both servers. In this example, P-Edge-B2 and P-Edge-C3 are isolated on the map showing the logical path.
|
|
Step 14
|
Select the following from the list:
-
Headend: P-Edge-B2.
-
Endpoint: P-Edge-C3.
|
|
Step 15
|
Click Get Paths.
The Running Query ID pop-up appears.
|
|
Step 16
|
Click View Results when it becomes available. The Path Details panel appears with the corresponding Available Paths details, while the defined
topology map appears with the available Native SR IG Paths on the left. This view shows the actual, physical hops between
B2 and C3 that is carrying the traffic.
|
|
Step 17
|
To troubleshoot any Failed path queries appearing in the Path Query Dashboard’s Query State column, select the “I” icon for
error details.
In this example, the gNMI protocol is missing from the Connectivity Details for a previous path query with the Headend P-BOTTOMLEFT
device and the Endpoint P-BOTTOMRIGHT devices. To troubleshoot the failed path query, do the following:
-
Select Device Management > Network Devices.
-
Find the device by Host Name and select the check box.
-
Click the Edit icon at the top of the table. The Edit Device window appears.
-
In this example, the Connectivity Details for Protocol is missing gNMI. Click + Add Another and type GNMI until it appears in the list. Select it.
-
Enter the IP Address / Subnet Mask information and Port field information.
-
Enter the Timeout field as 30.
-
In the Endcoding Type list, type JSON until it appears in the list. Select it and click Save.
-
Select Services & Traffic Engineering > Path Query. The Path Query Dashboard appears.
-
Click New Query. The New Path Query panel appears.
-
Select the following from the list:
-
Headend device: P-BOTTOMLEFT.
-
Endpoint device: P-BOTTOMRIGHT.
-
Click Get Paths.The Running Query ID pop-up appears.
-
Click View Results when it becomes available. The Path Details panel appears with corresponding Available Paths details, while the defined topology
map appears with the available Native SR IG Paths on the left and is now in a Completed state.
|
 Feedback