Debugging Cisco NIA Application
Cisco NIA Application Start
To debug Cisco NIA app start in bootstrap, check the following file in compute nodes for any issues in Cisco NIA app specific install hooks.
/var/afw/applogs/NIA/NIAshook_Cisco_afw_log.oldExample:
2019-06-05 22:04:32,345 INFO       config.py:016 Running in APIC

.....
2019-06-05 22:04:32,782 INFO    kafka_configure.py:064 Kafka Correct config=True
2019-06-05 22:04:32,782 INFO apic_configure_nia.py:033 Start hook passed kf_done=True

Clean hooks are in /var/afw/applogs/NIA/NIAchook_Cisco_afw_log.old
The first login for Cisco NIA app takes some time for UI transition. The following message is displayed until application loads completely.
Please wait while Application data is being loaded.Cisco NIA Application User Interface
-
Most common user interface issues are due to receiving unexpected data from the APIs. Open the developer tools network tab and repeat the last action. It displays the API data received.
-
For issues with APIs, troubleshoot the backend logs.
-
For successful API requests and responses, check the developer tools console tab for errors, empty or unexpected data in the UI.
-
-
After initial installation, the application needs time for UI transition and load completely. For any errors take screenshots before and after reproducing an issue.
-
Take a screenshot of full network capture saved as a HAR from you browser. Open a service request and attach a HAR recording, backend logs, and screenshots for root cause analysis.
Statistics Telemetry
Statistics telemetry enables Cisco to collect statistics, inventory, and other telemetry information from customer networks. To debug statistics telemetry:
-
Make sure that Device Connector is connected to Intersight cloud and claimed using the Device Connector user interface.
-
Make sure that telemetry streaming is enabled. Check the check box for Help Cisco improve its products.
-
Log into the compute node where the Device Connector is running.
# docker ps | grep “device \| intersight” # docker exec it <dc container> bash -
In the logs directory, check the Device Connector logs for any failures related to inventory or etl update. Record the errors, collect Device Connector details, and collect Cisco NIA tech-support.
Advisory Report
Advisory report allows the user to export all advisory information from a link on the Advisories list view. To debug perform the following steps:
-
From your browser tools page, right click Inspect, and click the network tab in your browser. Check if
/getAdvisoryReportendpoint HTTP call status is success. -
For a failed API call, view Active Data micro-service logs to check for any errors thrown in the micro-service. Collect Active Data micro-service logs for furthur analysis.
If the API call is successful, but the file is not downloaded, check any popup blockers are enabled in the browser.
Debugging Software Upgrade Path and Upgrade Impact
-
From your browser tools page, check if POST to upgradepath endpoint is successful and input or output data is as expected.
-
To check the upgrade impact logs:
-
Log into the compute node where the upgrade impact container is running.
# docker ps | grep "upgradeimp" # docker exec -it <container_id> bash -
check for any errors in the upgrade impact logs from the logs directory.
-
Make a note of the POST data, errors, screenshots of UI and collect Cisco NIA tech support.
-
The following are the examples for upgradepath.
Cisco NXOS
time="2020-01-22 07:43:59.485" level=info msg="new AdvMap=74522df14dfcas-UPG-admin" file="upgradepath:204"
time="2020-01-22 07:43:59.485" level=info msg="Starting issumatrix call nxos 7.0(3)I7(1) 9.3(1)" file="upgradepath:277"
time="2020-01-22 07:43:59.485" level=info msg="Res output:[7.0(3)I7(1) 7.0(3)I7(5a) 9.3(1)]" file="upgradepath:297"
time="2020-01-22 07:43:59.486" level=info msg="Sending POST response" file="upgradepath:258"
Notices
To debug notices:
-
Connect to the Intersight cloud and claim the Device Connector atleast once.
-
Make sure that all the devices are available in the network.
-
Make sure that all data is downloaded successfully.
-
In case no notices appear, collect device connector details and collect Cisco NIA tech-support.
Bugs and PSIRTs
To debug for bug scan and PSIRTs:
-
Connect to the Intersight cloud and claim the Device Connector atleast once.
-
Make sure that all the devices are available in the network.
-
Make sure that all metadata is downloaded successfully.
-
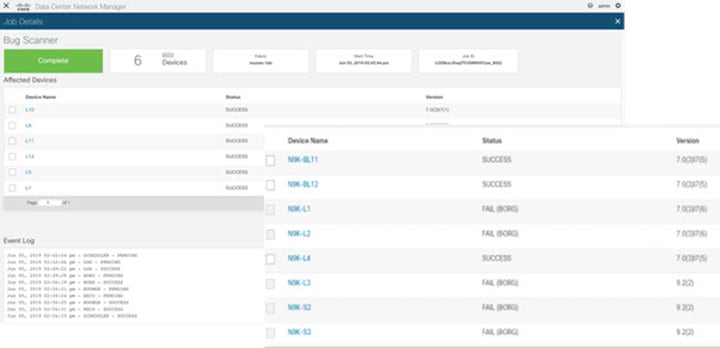
Configure the on-demand bug scan.
-
Check for the bug scan on-demand job progress.

-
In the log archiver, check the tech-support logs collected from switch.
-
In case the logs are not collected, then collect infra tech-support.
-
In case the collected logs do not show the bugs, then collect Cisco NIA tech-support.
-
TAC Assist On-demand
To debug TAC assist on-demand job:
-
Check the status of the job in the Job List page.
-
In the log archiver, check that the logs are successfully collected from the switches.
-
Check the logs are available in Cisco DCNM.
-
Collect the Cisco NIA tech-support in case of a failure.
Running Jobs
To debug abort or partial failures:
-
Check that the infra services are up and running (Kafka, AFW). Collect infra tech-support if the services are not running.
-
Collect Cisco NIA tech-support if the infra services are up and running.
Enhanced TAC Assist - User Initiated Upload to Cisco Cloud
In the user initiated TAC assist, the user collects the logs for specified devices and then uploads the collected logs to Cisco cloud. To debug perform the following steps:
-
Make sure that Device Connector is connected to Intersight cloud and claimed using the Device Connector user interface.
-
Log into the compute node where the Device Connector is running.
# docker ps | grep “device \| intersight” # docker exec it <dc container> bash -
In the logs directory, check the Device Connector logs for any failures related to inventory or etl update. Record the errors, collect device connector details and collect Cisco NIA tech-support.
Example for uploading logs to Cisco cloud.
T22:05:35.087-0800 info stdplugins/techsupport.go:107
   Received request to collect techsupport for device: FDO22242J62, type: switch
{"traceId": "AS0cb8885d3e0ad999ec14d74a5074cbd6", "traceId": "PE98f043ee82967a1831f5a8c9eedfe25b"}
T22:05:35.087-0800 info  stdplugins/techsupport.go:166
   Invoking techsupport function.  {"traceId": "AS0cb8885d3e0ad999ec14d74a5074cbd6", "traceId": "PE98f043ee82967a1831f5a8c9eedfe25b"}
T22:05:35.087-0800  info  niatech/techsupport.go:370
{"traceId": "AS0cb8885d3e0ad999ec14d74a5074cbd6", "traceId": "PE98f043ee82967a1831f5a8c9eedfe25b"}
T22:05:35.087-0800  info  niatech/techsupport.go:371     FDO22242J62
{"traceId": "AS0cb8885d3e0ad999ec14d74a5074cbd6", "traceId": "PE98f043ee82967a1831f5a8c9eedfe25b"}
T22:05:35.122-0800  info  niatech/techsupport.go:339
         Got device model from dp
{"traceId": "AS0cb8885d3e0ad999ec14d74a5074cbd6", "traceId": "PE98f043ee82967a1831f5a8c9eedfe25b"}
File start being uploaded:
T12:34:17.630-0800  info  niatech/techsupport.go:425
        Nashville: Finished techsupport collection with deviceType: switch, deviceId: FDO22232LMZ
{"traceId": "ASc1a31b74ce56d39c3080fc97a4eba779", "traceId": "PE0194accfee60ba13eee45ff21fa32b81"}
T12:34:17.630-0800  info  niatech/techsupport.go:426
             Nashville: Initiating techsupport upload with deviceType: switch, deviceId: FDO22232LMZ
{"traceId": "ASc1a31b74ce56d39c3080fc97a4eba779", "traceId": "PE0194accfee60ba13eee45ff21fa32b81"}
Flow State Validator First Hop Router Discovery
In the following scenarios collect Cisco NIA app and agent tech-support from affected switches for further debugging.
-
Make sure that source IP or source MAC is available in the devices installed with compatible Cisco NIA agent RPM.
-
In case FHR discovery fails and source IP or source MAC is available in Address Resolution Protocol (ARP) or MAC table for a device, then check if the device is not excluded from list of supported devices for FHR discovery.
The following is an example for flow state validator event log.
02:23:56pm - FSV - PENDING - WARNING: Removed devices ext-core1 Ex_Leaf site2-spine2 from list of supported devices for FHR discovery as compatible FSV RPM is not installed; -
If the following error occurs in error log, then check for SIM output in flow state validator log. It occurs when SIM is unable to connect to the device to execute CLI hosted by Cisco NIA agent. Ping the compute node where SIM is running on the device to check if it works.
02:23:57 pm - FSV - PENDING – WARNING: FHR discovery skipped for devices tor1 due to connectivity failure. -
If the following error occurs in error log, then check for SIM output in flow state validator log. It occurs when SIM receives no or malformed data from Cisco NIA agent. In this case check if compatible Cisco NIA agent RPM is installed in the switch.
02:23:57 pm - FSV - PENDING – WARNING: FHR discovery failure, received invalid response from agent. -
The following error occurs when source IP or source MAC is not available in Address Resolution Protocol (ARP) or MAC table of devices included for flow state validator job.
12:19:09 pm - FSV - ABORT - WARNING: FHR not found for
Source IP 60.0.0.11 and Destination IP 60.101.0.72
Flow State Validator Quick and Full Run
The following are debugging details for quick run and full run in a flow state validator job. In all these scenarios collect Cisco NIA app and agent tech-support from affected switches for further debugging.
-
The flow tracing stops and fails immediately when agent returns failure while running in quick mode.
-
In full mode the consistency checker runs in parallel in all the devices belonging to flow path. Consistency check errors are reported from multiple devices in flow summary table. See the flow summary table for errors and collect details for further debugging.
-
If the following error appears in the error log, then check if the device is listed in the list of active devices for this flow state validator job. If not listed, then click Device Count to check the reason for exclusion in the flow detail page.
04:12:44 pm - FSV - PENDING – WARNING: Device ID SAL123456 Device Name spine1 not found in FSV supported device list, Skipping... -
If the following error appears in the error log, then check for the SIM output in flow state validator log. It occurs when SIM receives no or malformed data from Cisco NIA agent. In this case check if compatible Cisco NIA agent RPM is installed in switch. Collect Cisco NIA agent tech-support from affected device.
02:23:57 pm - FSV - PENDING – WARNING: Flow state validation failed for device ID FDO453245 device Name Spine, received invalid response from agent, Skipping… -
If the following error appears in the error log, then check for the SIM output in flow state validator log. It occurs when SIM is unable to connect device to execute CLI hosted by Cisco NIA agent. Ping the compute node where SIM is running on the device to check if it works.
02:23:57 pm - FSV - PENDING – WARNING: Flow state validation failed for device ID FDO453245 device Name eor1 due to error device connectivity failure, Skipping... -
The flow state validator job is declared failure, if either quick run fails or consistency checker fails in full mode, or no path can not be traced to reach destination node.
Cisco NIA Log Paths
Collect the following logs to debug:
-
Cisco DCNM:
-
Within the container.
/opt/nia/<microservice>/log/<rotated log
                                          file>
bash-4.2# env|grep NIA NIA_MS_LOGFILE=core.log NIA_MS_HOME=/opt/nia/core/ NIA_MS_LOGDIR=/opt/nia/core/log -
On each compute.
/var/afw/applogs/NIA/appid_Cisco_afw_log/<logfile> -
Docker logs.
-f <container_id>
-
-
Cisco DCNM master.
[root@dncm-mr2-node115 ~]# appmgr afw fetch-logs
                                    Cisco:NIA
Cisco DCNM Infra Log Paths
To debug logs:
-
SIM on each compute logs.
[root@compute2 sim]# pwd /var/afw/applogs/simagent_Cisco_afw_log/sim [root@compute2 sim]# ls -lrth total 3.7M lrwxrwxrwx 1 root root 29 Jun 2 21:12 sim.log -> /var/log/toHost/sim/sim.log.1 -rw-r--r-- 1 root root 3.7M Jun 5 15:29 sim.log.1 -
CETI on each compute logs.
[root@compute2 ceti_Cisco_afw_log]# pwd /var/afw/applogs/ceti_Cisco_afw_log [root@compute2 ceti_Cisco_afw_log]# ls -lrth total 11M lrwxrwxrwx 1 root root 26 Jun 5 14:15 ceti.log -> /var/log/toHost/ceti.log.1 -rw-r--r-- 1 root root 11M Jun 4 11:28 ceti.log.1 -
Kafka, Zookeeper, ElasticSearch logs.
[root@compute2 applogs]# pwd /var/afw/applogs drwxr-xr-x 3 root root 4096 Jun 2 20:53 elasticsix_Cisco_afw_log drwxr-xr-x 3 root root 4096 Jun 2 20:53 zookeeper_Cisco_afw_log drwxr-xr-x 3 root root 4096 Jun 2 20:53 kafka_Cisco_afw_log -
Kafka, Zookeeper, ElasticSearch Docker logs.
docker ps --format
                                    'table {{.ID}} {{.Image}}' | egrep
                                    "elastic:6|kafka|zookeeper"
CONTAINER ID IMAGE 8335f5140d42 172.31.205.60:5000/dcnmkafka:2.11_2.1.1 8c98df915797 172.31.205.60:5000/dcnmzookeeper:3.4.12 2e7e79eb22f0 172.31.205.60:5000/dcnmelastic:6.1.4docker logs 8335f5140d42 Infra: [root@dcnm-master ~]# appmgr afw fetch-logs Cisco:stalker [root@dcnm-master ~]# appmgr afw fetch-logs Cisco:ceti [root@dcnm-master ~]# appmgr afw fetch-logs Cisco:kafka [root@dcnm-master ~]# appmgr afw fetch-logs Cisco:elasticsix


 Feedback