Viewing the Statistics for Processes Using the GUI
To view the statistics for a process, on the menu bar, choose . In the Navigation pane, perform one of the following actions:
-
For all processes, choose .
-
For a specific process, choose .
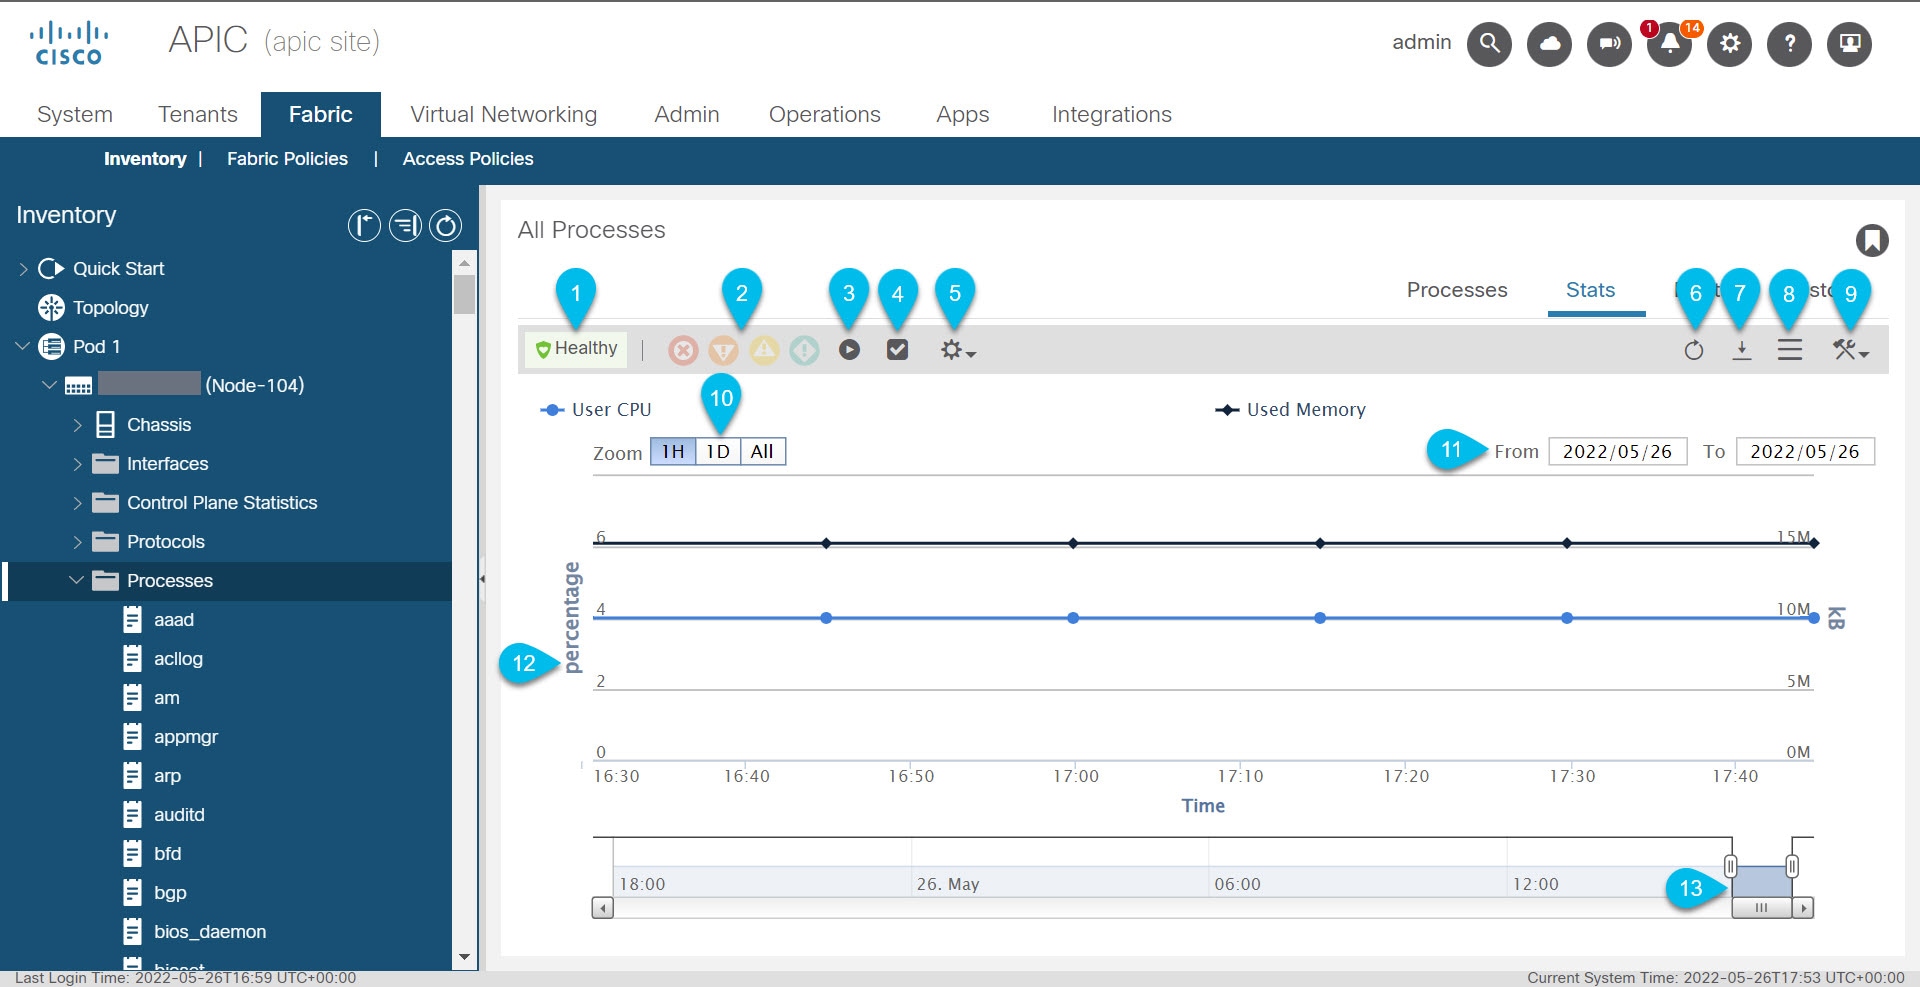
In the Work pane, choose the Stats tab. The following screenshot shows an example of all processes, but the view for a specific process is nearly identical:

|
Callout |
Description |
|---|---|
|
1 |
The overall health of the process. Hover over this to see the health score. |
|
2 |
The faults. Hover of this to see the number of faults for each severity. Click one of the severities to go to the Faults tab to see the faults of that severity. |
|
3 |
Stops the GUI from displaying updated statistics, which enables you to examine the statistics as they were at the time that you clicked this button. Click the button again for the GUI to resume displaying updated statistics. Even when you stop the GUI from displaying updated statistics, the Cisco Application Policy Infrastructure Controller (APIC) continues to collect the latest statistics. |
|
4 |
Opens the Select Stats dialog, which enables you to choose the sampling interval and select the statistics to view. |
|
5 |
Enables you to choose the statistics type to view.
|
|
6 |
Refreshes the statistics data. |
|
7 |
Downloads the statistics data to your local system as an XML file. The file gets downloaded to your browser's default download location. |
|
8 |
Toggles between the table and topology (graph) views. |
|
9 |
Click this, then choose Configure Statistics Policy to open the Create Stats Target dialog. In the dialog, you can choose one or more statistics targets and configure the collections. The collections enable you to specify the retention period for each collection granularity, and enable or disable each granularity. For more information, see Configuring the Statistics Policy for All Processes After Configuring the Policy the First Time Using the GUI. |
|
10 |
Only visible in the topology view, and only for the 15 Minute and 1 Hour sampling intervals. This sets the zoom to a preset value. The zoom specifies what time range to display in the topology.
|
|
11 |
Only visible in the topology view, and only for the 15 Minute and 1 Hour sampling intervals. The date range of the topology. You can click the dates and change the values. You cannot enter a date that is not visible in the timeline at the bottom of the topology. The From date cannot be later than the To date. |
|
12 |
In the topology view, this area shows a graph of the selected statistics. Hover over any of the epochs to see the exact data for all selected statistics at that time. In the table view, this area shows a table of the same statistics. You can sort the table by clicking any of the headers. You can filter the table by clicking the drop-down list arrow at the right side of a header, choosing Columns, then putting a check in or removing a check from any of the boxes. |
|
13 |
Only visible in the topology view. This is the zoom, which specifies what time range to display in the topology. This enables you to set the zoom to an arbitrary amount. Drag the left side to specify the start of the zoom and the right sides specify the end of the zoom, which determines the length of time to display. After you set the start and end, you can use the horizontal scroll bar to change the portion of the time line that you are viewing while retaining the same length of time. |
 Feedback