Monitor Alarms and Events

What Are Alarms and Events?

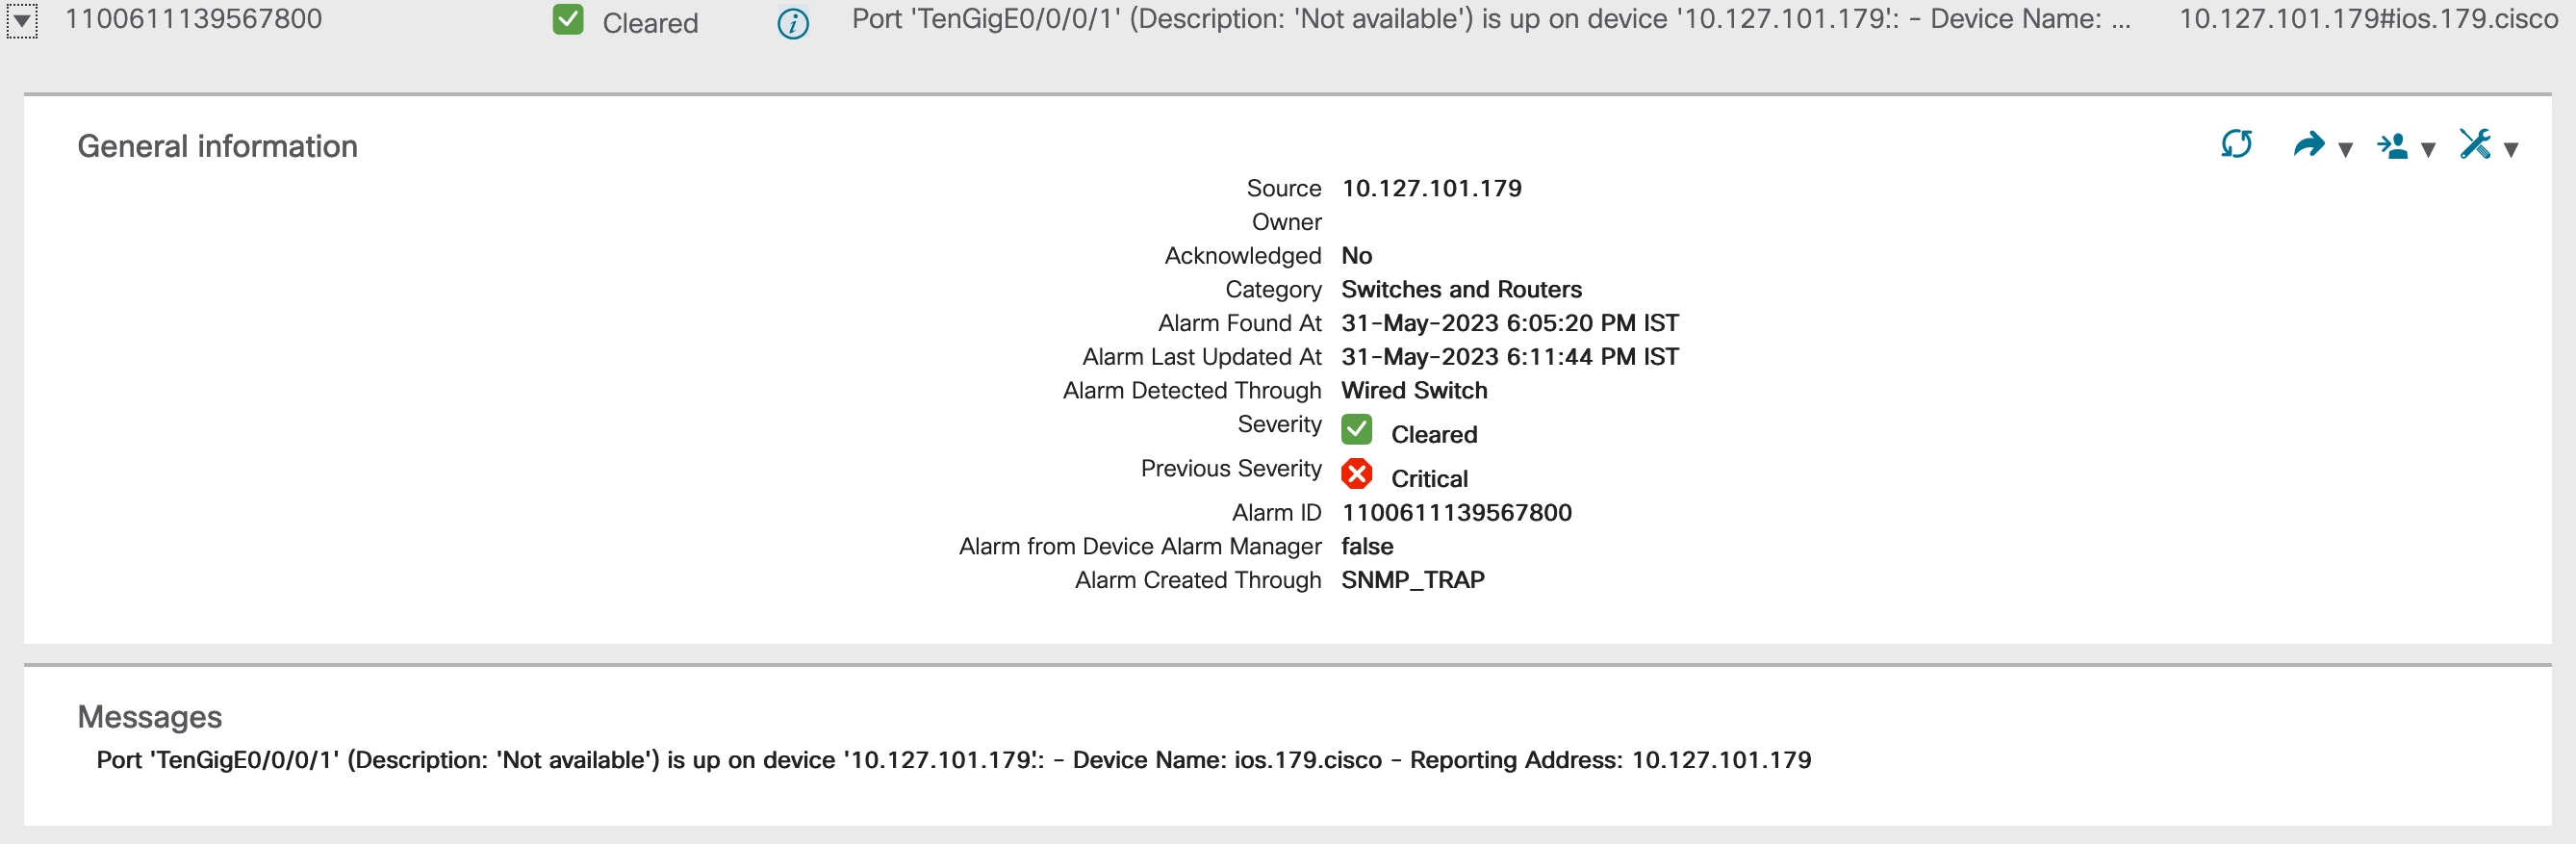
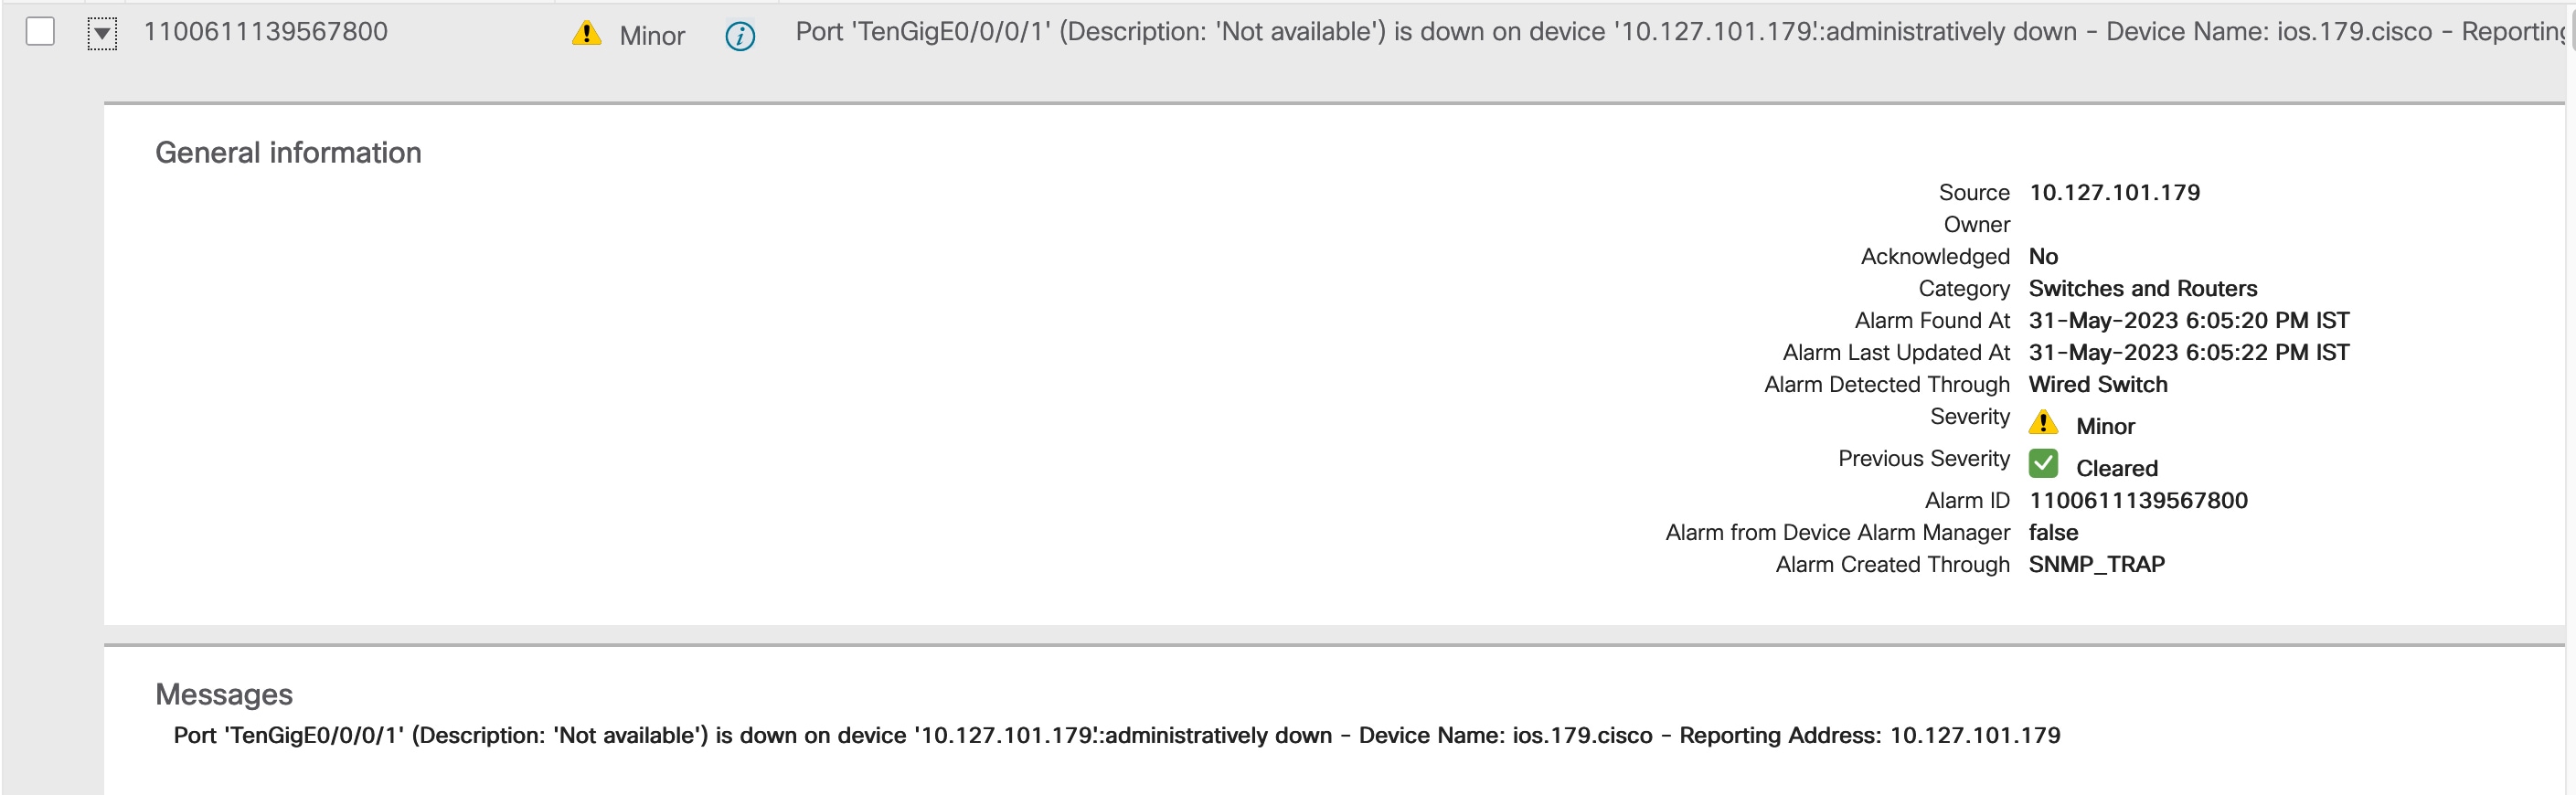
An event is a distinct incident that occurs at a specific point in time, such as a port status change, or a device becoming unreachable. Events can indicate an error, failure, or exceptional condition in the network. Events can also indicate the clearing of those errors, failures, or conditions. Events have associated severities which you can be adjusted.

An alarm is a Cisco Evolved Programmable Network Manager response to one or more related events. Only certain events generate alarms. Alarms have a state (cleared or not cleared) and a severity (Critical, Major, Minor, and so forth). An alarm inherits the severity of its most recent event. Alarms remain open until a clearing event is generated (or if the alarm is manually cleared).

How are Alarms and Events Created and Updated?

The Cisco EPN Manager processes SNMP traps, syslogs, and TL1 messages from IPv4 and IPv6 devices. It maintains an event catalog that determines how it should respond to these events. The flowchart below represents the manner in which these alarms and events are processed:

Figure 1. Alarm processing flowchart

Cisco EPN Manager performs the following general steps when it processes an event:

  1. Checks the event catalog to see if higher-level processing is necessary (as opposed to generic processing) for the incoming SNMP trap, syslog, or TL1 message (by examining the raw event for predefined patterns).

    • If it cannot match the raw event to the catalog, the event is considered a generic event, and it undergoes generic processing. Generic events are displayed events in the GUI and can be forwarded in notifications. Generic event handling can be disabled too. See Disable and Enable Generic Trap and Syslog Handling. This is done so that none of the traps and syslogs that are received by Cisco EPN Manager is discarded i.e., they either go through generic processing to create generic events or higher-level processing to create alarms/processed events.

    • If it can match the raw event to the catalog, the raw event is considered for higher level processing, and Cisco EPN Manager creates a processed event with a severity and potentially an alarm.

  2. Identifies the device and device component that is causing the event (localizes the event).

  3. Checks whether the supported event triggers inventory collection.

    Some events have specific rules that instruct Cisco EPN Manager what information it should collect. For more information, see How Is Inventory Collected?

  4. Checks whether the event severity is INFO or CLEARED.

    • If it is INFO or CLEARED, Cisco EPN Manager saves the event and displays it in the GUI.

    • If it is any other severity, Cisco EPN Manager evaluates whether a new alarm should be opened (next step).

  5. Checks whether an alarm exists or a new alarm should be created.

    • If an alarm does exist, Cisco EPN Manager associates the event to the existing alarm. The alarm severity is changed to match the severity of the new event, and the alarm time stamp is updated. If it is a clearing event (for example, a link up event), the alarm will be cleared.


      Note


      Sometimes, a device may not generate a clearing alarm. The administrator should set the alarm auto-clearing interval as described in Change Alarm Auto-Clear Intervals.
    • If an alarm does not exist, Cisco EPN Manager creates a new alarm and assigns it the same severity as the event.

  6. Checks whether the new or existing alarm can be correlated to any other alarms. (Note: Alarms are being correlated with other alarms, not with events.) If they can be correlated, Cisco EPN Manager does the following:

    • Identifies the causing alarm as the root cause alarm.

    • Identifies the resulting alarm as a symptom alarm.

    You can identify uncleared correlated alarms by checking the Correlated Alarms tab in the Alarms and Events table. For more information on these kinds of alarms, see View Root Cause and Correlated Alarms.

Example: Link Down Alarm

In this example, Cisco EPN Manager receives a Link Down trap that it receives from a device. Cisco EPN Manager generates a Link Down event and, because the port is operationally down, it also generates a Link Down alarm.

When Cisco EPN Manager receives a Link Up trap from the device, it generates a Link Up event and clears the alarm.

When a port is down for maintenance or has been disabled by a network administrator, Cisco EPN Manager raises a Link Down alarm with severity MINOR.


Note


Severity of the Link Down alarms cannot be modified.


Flapping Events and Flow Controllers

Flapping is a flood of consecutive event notifications related to the same alarm. It can occur when a fault causes repeated event notifications (for example, a cable with a loosely fitting connector.) An event is identified as a flapping event if multiple events are of the same type, are associated with the same source, and recur in a short period of time. Cisco Evolved Programmable Network Manager will generate an alarm for flapping events. This alarm is generated when there are five occurrences of the same event within 300 seconds. The five occurrences could be of a sequence such as, Interface Down, Interface Up, Interface Down, Interface Up, Interface Down, and so on.

When an alarm is generated for a flapping event, the devices often go into a continuous synchronization state. This can prevent deployment of device configuration such as service provisioning, OAM, etc, on the device. However, in Cisco EPN Manager, when a monitored device raises a Flapping alarm, Cisco EPN Manager detects this alarm and stops further updates of the alarm until the flapping condition on the device is cleared.

The alarm detected as a Flapping Event is cleared based on an exit condition, which is that when there is no occurrence of the same event within the next 300 seconds, the alarm is cleared. This helps control the flow of events to avoid unnecessary triggering of device synchronization.

Set Alarm and Event Management Preferences


Note


Advanced users can also use the Cisco Evolved Programmable Network Manager Representational State Transfer (REST) API to access device fault information. For information on the API, click at the top right of the Cisco Evolved Programmable Network Manager window and choose Help > API Help.

Set Up Your Alarm and Event Display Preferences

In the Alarms and Events tables, Cisco Evolved Programmable Network Manager displays the last 4000 alarms or events, by default. Cisco Evolved Programmable Network Manager can only display what is available in the cache (which may be less than 4000). If you want to see more than 4000 alarms or events, click Show Alarm History above the table.


Note


The list of 4000 alarms and events also includes cleared alarms which are not displayed. Click Show Alarm History to see all the open alarms.


You can customize the following alarm and event display by clicking at the top right of the Cisco Evolved Programmable Network Manager window and choosing My Preferences. After you make your changes, click Save to apply your new settings. Other settings, such as whether acknowledged, cleared, and assigned alarms are displayed, are controlled globally by the administrator.

(see Configure Global Display and Search Settings for Acknowledged, Cleared, and Assigned Alarms).

User Preference Setting

Description

Automatically refresh Alarms & Events page

Enables or disables automatically refreshing of the Alarms and Events page. If enabled, the page is refreshed according to the setting in Refresh Alarm count in the Alarm Summary.

Refresh Alarm count in the Alarm Summary every ___ minutes/seconds

Sets the refresh interval for the alarm count in the Alarm Summary (1 minute by default) (see Customize the Alarm Summary).

Enable Alarm Badging on Alarms & Events page

When user enables Alarm Badging, alarm severity icons are displayed next to the device groups on the Monitor > Monitoring Tools > Alarms & Events page.

Disable Alarm Acknowledge Warning Message

Note

 
This setting is only configurable if Hide Acknowledged Alarms is also enabled; that setting is disabled by default (see the previous table).

Disables the following message from displaying when user selects an alarm and chooses Change Status > Acknowledge:

Warning: This alarm will not be generated, if the original event recurs again, within next 7 days, as it is acknowledged now. Clearing the alarm instead of acknowledging will cause the alarm to be generated if the event recurs again. Proceed with alarm acknowledgment?

Disable confirmation prompt for “Clear all of this condition”

Disables the following message from displaying when user selects an alarm and chooses Change Status > Clear all of this condition:

Are you sure you want to clear all alarms of this condition?

(Disabled by default)

Disable “Set severity to information” prompt for “Clear all of this condition”

Disables the following message which is displayed when user selects an alarm and chooses Change Status > Clear all of this condition:

Do you want to set the severity for the selected alarm's condition to Information?

WARNING: This is a system-wide change that will prevent creation of future alarms of this condition. You can undo this change on the Severity Configuration page under System Settings.

(Disabled by default)

Note

 
Users with sufficient privileges can reset the severity to its original value using the procedure in Configure Global Display and Search Settings for Acknowledged, Cleared, and Assigned Alarms .

Select alarm categories for Alarm Summary Toolbar

Controls what is displayed in the Alarm Summary (see Customize the Alarm Summary).

When clearing all alarms of a condition, always set the condition's severity to Information

When user selects and alarm and chooses Change Status > Clear all of this condition. (Disabled by default)

Enable New Critical Alarm Count Notifications

Enables the notification pop-up that displays the count of critical alarms.The count gets updated once the alarm interval is refreshed depending on the interval set in Refresh Alarm count in the Alarm Summary (see Customize the Alarm Summary). Only the outstanding critical alarms are displayed.

View Critical Alarm Notifications

The count of the critical alarms in the network is displayed as a notification pop-up in every page. The count gets refreshed every 1 minute or some interval depending on the interval set in the My Preferences page.

Click the Show Details hyperlink to view the list of critical alarms in the Monitor > Monitoring Tools > Alarms and Events > Alarms page.


Note


Only the outstanding critical alarms are taken count and displayed.

The notification is not enabled by default and needs to be enabled from the My Preferences page. For details on how to enable the critical alarm count notification, see Set Up Your Alarm and Event Display Preferences.

Customize the Alarm Summary

You can specify what alarm categories are displayed:

  • In the Cisco Evolved Programmable Network Manager title bar alarm count (bell). This gives you a quick visual count of alarms you are interested in.

  • In the Alarm Summary pop-up window that is launched when you click the alarm count. The pop-up window gives you a quick look at alarm counts with their severity, as shown in the following figure.


    Note


    Make sure that the pop-up blocker is disabled in the web browser where you are using EPNM.


To customize this information:

Procedure


Step 1

Click Edit at the top left of the Alarm Summary pop-up window. This opens your My Preferences page. You can also open this page by clicking at the top right of web GUI window and choosing My Preferences.

Step 2

Click the Alarms & Events tab.

Step 3

To change the Alarm Summary refresh interval, select a number from the Automatically Refresh Alarms & Events page drop-down list.

Step 4

To specify what is included in the Alarm Summary, Go to the Alarm Categories area. Select Alarm Summary from the Default category to display drop-down list. Enable or disable the required Alarm Category by selecting or deselecting the corresponding checkbox.

Step 5

Click Save to confirm the changes made in the My Preferences window.


Interpret Event and Alarm Badges and Colors

When there is a problem in the network, Cisco Evolved Programmable Network Manager flags the problem by displaying an alarm or event icon with the element that is experiencing the problem. Alarm Severity Icons lists the icons and their colors.

Alarm Severity Icons

The table below lists the alarm colors and their respective severity levels for the icons displayed in various parts of the web GUI.

Severity Icon

Description

Color


Critical alarm

Red


Major alarm

Orange


Minor alarm

Yellow


Warning alarm

Light Blue


Alarm cleared; normal, OK

Green


Informational alarm

Medium Blue


Indeterminate alarm

Dark Blue

Find and View Alarms

To view alarms, go to Monitor > Monitoring Tools > Alarms and Events. In the Alarms tab, alarms are listed in a table under the respective sub-tabs. Each of these tables displays a default set of columns. To enable a column that is not displayed by default, click at the top-right corner of the table and select the column.

From the displayed alarms table, you can search for specific alarms, as described in the table below. To get more information about an alarm, see View an Alarm's Details.


Note


By default, acknowledged and cleared alarms are not included in any search criteria. This behavior is controlled by the system administrator. See Configure Global Display and Search Settings for Acknowledged, Cleared, and Assigned Alarms.

To find these alarms:

Choose Monitor > Monitoring Tools > Alarms and Events and:

Alarms generated by a specific device

For active alarms, click the i icon next to the device name to open the Device 360 view, then click the Alarms tab. For cleared alarms, refer to the Alarms and Events table.

Note

 
  • For Cisco NCS 2000 series devices, transient conditions are processed as alarms and displayed in the Alarms table. Click i to navigate to the related port through the Interface 360 view. This feature is enabled only when you select the Enable Transient Condition Alarms check box in Alarm Other Settings page.

    Enabling the Transient Condition Alarms feature requires selecting the corresponding check box on the Alarm Other Settings page. If you disable this feature after an alarm has been triggered, the alarm will continue to be displayed on the Alarms tab.

    See Specify Alarm Clean Up, Display, and Email Options) for more information.

  • For SVO devices, clicking the device name hyperlink cross launches the SVO UI. The SVO device hyperlink is enabled only if you have selected the Enable Alarms Cross Launch to SVO check box in the Alarm Other Settings page.

    See Specify Alarm Clean Up, Display, and Email Options for more information.

For cleared alarms or correlated alarms, click the appropriate tab and enter the device name or component in the Location column. You can use wild cards.

For certain devices, you can also use the Chassis View to check device alarms. See View Alarms in the Chassis View.

Alarms generated by a specific circuit/VC

  1. Click the i icon next to the device name to open the Device 360 view, then click the Circuit/VC tab.

  2. Click the i icon next to the Circuit/VC name to open the Circuit/VC 360 view, then click the Alarms tab.

See Check Circuits/VCs for Faults for more circuit/VC alarm information.

All alarms in the network

Click the Show Alarm History link.

Alarms assigned to you

Click the Show drop-down filter list and choose Assigned to me. You can also use this filter in the Cleared/Correlated alarms tabs.

Unassigned alarms

Click the Show drop-down filter list and choose Unassigned Alarms. You can also use this filter in the Cleared/Correlated alarms tabs.

Cleared Alarms

Click the Show drop-down filter list and choose Cleared Alarms Alarms. You can also use this filter in the Cleared/Correlated alarms tabs.

Network Alarms

Under the Alarms tab, click Network Alarms tab to view all network impacting alarms.

This tab is enabled only if you have selected the Enable Network Alarms View check box in Alarm Other Settings page.

See Specify Alarm Clean Up, Display, and Email Options for more information.

Latest alarms according to the Cisco EPN Manager timestamp

For active alarms:

  • Alarms in the last 30 minutes—Click the Show drop-down filter and choose the last 5, 15, or 30 minutes (CEPNM timestamp).

  • Alarms in the last 24 hours—Click the Show drop-down filter and choose the last 1, 8, or 24 hours (CEPNM timestamp).

  • Alarms in the last 7 days—Click the Show drop-down filter and choose the last 7 days (CEPNM timestamp).

You can use these same filters for cleared and correlated alarms. The filters do not have the (CEPNM timestamp) suffix because filtering by device timestamps is not supported for cleared and correlated alarms. For more information on (CEPNM timestamp) and (Device timestamp), see Device Timestamp and CEPNM Timestamp.

Latest alarms according to the device timestamp

Follow the same instructions given in the previous row, but choose the filters with the suffix (Device timestamp) This filter is not supported when searching for cleared or correlated alarms.

All alarms generated by a device group, series, or type

Choose a group from the navigation pane on the left. You can also use this filter for cleared and correlated alarms.

You can also filter the data to find specific alarms using a quick filter or an advanced filter from the Show drop-down list.


Note


Any optical alarm that is not supported for a device appears as Optical Alarm under the Alarm Conditions column.


Filter Data in the Alarms Table

You can filter the data to find specific alarms using a quick filter or an advanced filter from the Show drop-down list. The quick filter narrows the content that is displayed in a column according to the text you enter above the column. The advanced filter allows you to narrow down the data in a table by applying a filter using multiple operators such as Does not contain, Does not equal, Ends with, Is empty, and so on. You can also create a user-defined filter which, if saved, will be added to the Show drop-down menu.

Locally created root and admin users in EPNM have the option to create a public filter that can be shared with other users. They can also edit and delete public filters (created by either of them). The option to create a public filter is available only to root and admin users. Other users do not have this option and can only create private user-defined filters by default.

To create a user-defined filter:

Procedure


Step 1

Click Show above the extended tables of alarms and choose Advanced Filter.

Step 2

In the Advanced Filter data popup window, enter the advanced filter criteria, and click Save As.

Step 3

In the Save Filter dialog box, enter a name for the filter and click Save.

  1. Root users only: In the dialog box that appears, choose one of the following options :

  • Choose Public if you wish to share the filter with other users. The newly created filter is added to the Show drop-down list under Advanced Filters and available to other users.
  • Choose Private if you do not wish to share the filter with other users. The newly created filter is added to the Show drop-down list under Advanced Filters but not visible to other users.

(Root and admin users only): To edit or remove a user-defined filter, click Show > Manage User Defined Filters, select the user-defined filter and click Edit orRemove.

Create User-Defined Fields (UDF) for Custom Values in the Alarms table

You can create your own fields and define custom values in these fields to be displayed in the Alarms table. For example, to label certain alarms with a customer name. After you have created user-defined fields and assigned values, you can search for an alarm with these values in the Alarms table.


Note


By design, Advanced Filters are not supported for user-defined fields (UDF).

To create a user-defined field for alarms:

Before you begin

To enable the user-defined fields, navigate to Administration > Settings > System Settings > Alarms and Events > Miscellaneous and select the check box for Enable User Defined Field feature for alarms.

To enable notifications for device UDFs, navigate to Administration > Settings > System Settings > Alarms and Events > Miscellaneous and select the check box for Enable Device UDF to be sent in notifications.

Procedure


Step 1

Navigate to Administration > Settings > System Settings > General > User Defined Fields

Step 2

Click the + icon. Select Alarms from the drop-down list and enter a label and description.


To edit values in user-defined fields for alarms:

  1. Navigate Monitor > Monitoring Tools > Alarms and Events > Alarms.

  2. Click the settings icon at the top right of the table, choose Columns, then select your user-defined field from the list to display it as a column.

  3. Select the check box of the corresponding alarm and click Edit UDF.

  4. Enter the required value in user-defined field, and click Save.

Device Timestamp and CEPNM Timestamp

While Device timestamp is the information embedded inside the syslogs message, CEPNM timestamp is the time at which the message (from the device) is received at the Cisco EPN Manager end.

The following configuration is recommended on the device:

service timestamps log datetime show-timezone msec year

The default formats supported for device timestamps are:

  • yyyy-MMM-dd HH:mm:ss.SSS z

  • yyyy-MMM-dd HH:mm:ss z

  • MMM-dd-HH:mm:ss z

  • yyyy-MMM-dd HH:mm:ss.SSS

  • yyyy-MMM-dd HH:mm:ss

  • MMM-dd HH:mm:ss

Where z in the format implies a time zone.


Note


Only three letter time zones are supported and time zones with hour/minute offsets are not supported.


Note


The Cisco EPN Manager displays the time in the following standard format: DD-MMM-YYYY hh:mm:ss AM/PM Z, where Z is the time zone, irrespective of the device timestamp format. The same time format is followed throughout the Cisco EPN Manager GUI.

Standard time format example: 12-Dec-2022 12:10:11 AM IST


Track and Monitor Alarms

You can track and monitor alarms by setting the alarm auto-refresh interval to 10 seconds from the Refresh drop-down list. The list of alarms is refreshed and the latest 4000 alarms are displayed, along with the corresponding Alarm ID

View a Specific Alarm in the Topology Map

From the Alarms table, you can select a specific alarm and launch the topology map to see the alarm on the map.

Procedure


Step 1

To display the Alarms table, choose Monitor > Monitoring Tools > Alarms and Events.

Step 2

In the Alarms tab, locate and select the required alarm.

Step 3

Choose Troubleshoot > Network Topology.

The view switches to the topology map and the device with the alarm is highlighted in the map.


View Root Cause and Correlated Alarms

The Cisco Evolved Programmable Network Manager correlation process determines the causality for alarms and alarm sequences. Alarms that support the correlation process are:

  • A root cause alarm—An alarm that causes other alarms (the "correlating" alarm).

  • A symptom alarm—An alarm that is the result of another alarm (the "correlated to" alarm).

Root cause and symptom alarms are displayed in a hierarchical manner to help you easily identify impacted network elements. The following figure is an example of an uncleared link down alarm that is the root cause for two other link down symptom alarms. To display an alarm tooltip in the hierarchy, hover your mouse over an alarm.

This view is especially helpful when alarm sequence has multiple hierarchies. All alarm sequences, regardless of the number of hierarchies, have only one root cause alarm.

To view uncleared correlated alarms,

Procedure


Step 1

Choose Monitor > Monitoring Tools > Alarms and Events.

Step 2

Click the Correlated Alarms tab.

Step 3

Click in the Correlation Type column to display more information about the alarm in a new view.

You can also view uncleared correlated alarms in the main Alarms and Events table. Click in the Correlation Type column to view more information about the alarm in a new view.

In this view, you can:

  1. Perform actions such as Acknowledge and Clear the alarms. For more information, see Acknowledge and Clear Alarms

  2. Filter the list based on the severity, status and time stamp.

  3. Choose the list of columns to be displayed by clicking at the top right corner of the table.

Cleared correlated alarms are displayed in the Cleared Alarms tab. Like uncleared alarms, the Correlation Type column will identify it as a cleared root cause alarm or symptom alarm.


Get Troubleshooting and Detailed Alarm Information

View an Alarm's Details

To get more details about an alarm, expand it. You can do this from the Alarms list (by choosing Monitor > Monitoring Tools > Alarms and Events, or by clicking View Details in the Alarm Summary pop-up). When you expand an alarm , the auto refresh of the table is paused. The circled areas are explained in the table that follows this figure.

Figure 2. View an Alarm's details

General Information —When alarm was found and last updated, current and last severity, alarm ID and how it was detected

Device Details —Managed device name, address, uptime, reachability status, collection status, and so forth

Messages —Trap, syslog, or TL1 message

Device Events —Recent device events from past hour (of any type, in chronological order)

Impacted Circuits/VCs —Carrier Ethernet or Optical circuits/VCs affected by alarm

Find Troubleshooting Information for an Active Alarm

Use this procedure to get an explanation for why an active alarm occurred, and the recommended response to the alarm.


Note


Not all alarms have this information. Users with sufficient privileges can add or change the information that is displayed in the popup window. See Customize the Troubleshooting Text for an Alarm.


Procedure


Step 1

Choose Monitor > Monitoring Tools > Alarms and Events, then click the Alarms tab. (For interface alarms, you can also get this information from the Interface 360 view under the Alarms tab.)

Step 2

Locate the alarm, then click the "i" icon in the Condition column to open the popup window that provides the explanation and the recommended action that can be taken to troubleshoot the alarm.

If you take any actions, we recommend you document your actions. Choose the alarm, click Annotation.


Find Out Which Events Are Associated With An Alarm

To view the events that have been correlated to an alarm, from the Alarms table, click the “i” icon next to the Severity.

Find Out If An Alarm Impacts Other Services or Network Elements

The Alarms table contains a Service Affecting column which tells you if an alarm affects other parts of the network:


Note


Service-affecting information is displayed for optical devices only.
  • SA means it is a service-affecting alarm

  • NSA means it is not a service-affecting alarm

To identify all alarms that can affect services, choose Quick Filter from the Show drop-down list and enter SA in the field above the Service Affecting column.

To find out which services are affected, expand the alarm and check the details in the Impacted Circuits/VCs area of the alarm details.

Alternatively, you can view the list of all the Service Affecting Alarms from the Service Affecting tab on the Alarms and Events page. This list has the service-affecting information for all the devices managed by Cisco EPN Manager. To navigate to the Service Affecting tab, choose Monitor > Monitoring Tools > Alarms and Events, then click Service Affecting tab.


Note


There is no "Showing Active Alarms" option in this tab. By default, the entire list of alarms is displayed.

The Alarms table also contains a Correlation Type column which tells you if the alarm is causing other alarms (Root Cause Alarm), or if the alarm is a symptom of another alarm (Symptom Alarm). For more information, see View Root Cause and Correlated Alarms.

Acknowledge and Clear Alarms

An alarm can have a status of Not Acknowledged, Acknowledged, or Cleared.

Not Acknowledged

Not Acknowledged means the problem is not being worked on. It could indicate that a new fault condition in the network, or that a cleared fault condition that has recurred. Not Acknowledged alarms are not removed from the Alarms and Events tables until they are either acknowledged or cleared.

Acknowledged

Acknowledged means a fault condition has either been recognized and is being worked on, or it can be ignored. Moving an alarm to the acknowledged status is a manual operation and changes the alarm Status to Acknowledged. An acknowledged event is still considered to be open (that is, not cleared), so if any related events recur, the events are added to the alarm.

By default, acknowledged alarms are not removed from the Alarms list. This behavior depends on the Hide Acknowledge Alarms setting that is controlled by the Administrator.

Acknowledged alarms can be moved back to the Not Acknowledged status (for example, if you acknowledged the wrong alarm).

Cleared

Cleared means the fault condition no longer exists. If an alarm is cleared but an associated event recurs, Cisco Evolved Programmable Network Manager opens a new alarm. An alarm can be cleared by a user or by the Cisco Evolved Programmable Network Manager system. Cleared alarms are removed from the Alarms list (but you can still view them under the Cleared Alarms tab).

By default, cleared alarms will not be shown in the Alarms and Events page. To view the cleared alarms in the Alarms History table in the Alarms and Events page:


Note


When FRU alarms are generated, if inventory lacks location parameters then, generated alarms will not have location parameters. When the FRU alarms are cleared, the alarms may not have inventory location parameters.


  • Choose Administration > Settings > System settings, then choose Alarms and Events.

  • Under Alarm Display Options, uncheck the Hide cleared Alarms check box.

You can also clear an alarm by choosing Clear all of this Condition , which will clear all alarms that are having the same problem. You may also be prompted to change all alarms with that condition to Informational severity. This means that if an associated event recurs, a new alarm will not be opened. You should use that setting with care.

To change the status of an alarm:

Procedure


Step 1

Choose Monitor > Monitoring Tools > Alarms & Events .

Step 2

Select an alarm, then choose Change Status and the appropriate status (Acknowledge, Unacknowledge, Clear, Clear all of this Condition).

Note

 
Clear all of this Condition triggers a clearing event for all alarms with the same condition as the alarm you selected. When you choose this status, Cisco Evolved Programmable Network Manager displays a dialog asking if you want to change the severity for the selected alarm condition to Information. This prevents Cisco Evolved Programmable Network Manager from issuing alarms for the specified condition. To later reset the condition’s severity, choose Administration > Settings > System Settings > Alarm Severity and Auto Clear and modify the severity.

Step 3

Click Yes to confirm that you want to clear all alarms of the specified condition.


What are the Supported Alarm Clearing Mechanisms

At times you may face a situation where there are so many alarms that are available irrespective of their events being cleared. If you encounter any such problems, here are some of the solutions supported in Cisco EPN Manager.

  • Default clearing of alarms—The fault is resolved on the device and an event is triggered for the same. For example, a device-reachable event clears the device-unreachable event. This in-turn, clears the device-unreachable alarm.

  • Auto-clearing of alarms—In some cases, a device may not generate a clearing alarm. In such cases, Cisco EPN Manager waits for 24 hours (default interval) and then auto-clears the alarm. You need to have administrator privileges to change the auto-clear duration and to know how to set that interval, see Change Alarm Auto-Clear Intervals.

  • Clearing alarms based on inventory status of ports— When a device is rebooted, a card is reloaded or a RSP failover happens, the inventory collection is triggered for that device. During this inventory synchronization, Cisco EPN Manager clears several types of alarms located on some specific ports based on the operational status of that particular port of the device. For example, when Cisco EPN Manager receives a Link Down trap from a device, it generates a Link Down alarm on the specific port since it is operationally down. After a device reboot, if the operational status of the port changes to up, then the Link Down alarm is cleared automatically by Cisco EPN Manager.

  • Syncing device to clear alarms—Here, the devices are synced so that Cisco EPN Manager gets the list of the outstanding active alarms and the events that does not exist are cleared. This is a different mechanism when compared to the event based alarm/event reporting (over traps/syslogs). Once the sync is over, the Alarms Table is refreshed to display only the outstanding active alarms.


    Note


    This feature is supported only for certain devices or for certain device functionalities. For example, this feature is supported for optical devices/optical part of devices such as Cisco NCS 4000 series and Cisco NCS 1000 series devices.

    Note


    This feature is also supported for certain packet devices such as NCS 42xx. See the Cisco Evolved Programmable Network Manager Supported Syslogs spreadsheet for the list of syslogs that are supported on the NCS 42xx devices. For the Cisco NCS 4200 series devices, the alarm severity that is configured on the device will overwrite the alarm severity that is configured in the Cisco EPN Manager (Administration > Settings > System Settings > Alarms and Events > Alarm Severity and Auto Clear). This feature is not supported for other packet devices such as Cisco ASR 9000 routers.


  • Manual clearing of alarms—In situations where the clearing event is missing, you can manually clear an alarm by choosing the particular alarm, and changing its status to Clear. For more information, see the Cleared section under Acknowledge and Clear Alarms.

Add Notes To an Alarm

The annotation feature allows you to add free-form text to the alarm, which is displayed in the Messages area of the alarm details. To add text to an alarm, choose the alarm in the Alarms and Events table, click Annotation, and enter your text. As with acknowledging, when you annotate an alarm, Cisco Evolved Programmable Network Manager adds your user name and the annotation time stamp to the Messages area of the alarm details.

Manage How Alarms are Triggered (Alarm Thresholds)

You can customize how often information is gathered (polling interval), the threshold value that indicates a problem, and whether Cisco Evolved Programmable Network Manager should generate an informational event or an alarm (of an severity) when a problem is detected. Not all policies have all of these settings; for example, a policy may only collect statistics, so it would not have any thresholds or alarms associated with it.

Procedure


Step 1

Choose Monitor > Monitoring Tools > Monitoring Policies > My Policies and select the policy you want to edit.

Step 2

Locate the parameter you want to change. You can search for the parameter by entering a string in the Parameter text box.

Step 3

To adjust the polling interval, select the new interval from the Polling Frequency drop-down list. To disable polling, choose No Polling . Note that some polling frequencies are applied to groups of parameters. Changing the group interval will change the polling for all settings in the group. If a policy does not have any thresholds or events associated with it, Cisco Evolved Programmable Network Manager prompts you to save the changes.

Step 4

To change a threshold value, expand the parameter and choose a value from the parameter’s drop-down list.

Step 5

To specify what Cisco Evolved Programmable Network Manager should do when the threshold is surpassed, choose an alarm value from the parameter’s drop-down list. You can configure Cisco Evolved Programmable Network Manager to generate an alarm of a specified severity, generate an informational event, or do nothing (if no reaction is configured).

Step 6

Click:

  • Save and Activate to save and activate the policy immediately on the selected devices.

  • Save and Close to save the policy and activate it at a later time.


View Events (Including Generic Events)

The Events tab displays supported and generic (unsupported) events. Supported events are events that Cisco EPN Manager generates based on information about the network. It receives this network information either through syslogs and traps generated by devices, or through polling and inventory collection. This process is described in How are Alarms and Events Created and Updated?. Generic events are events that Cisco EPN Manager does not recognize. Rather than drop the events, Cisco EPN Manager assigns the events a Minor severity (this severity is applied to all generic events). If desired, you can customize the information displayed by generic events. For information about supported events, see Which Events Are Supported?.

Generic event processing is disabled by default. Users with Administrator privileges can disable or re-enable it.

The Events tab provides a variety of filters that you can use to find the information you are looking for. You can also create and save customized (preset) filters using the same procedure described in Find and View Alarms. The following table lists some of the ways you can filter events.

To find these events:

Select Monitor > Monitoring Tools > Alarms and Events, click the Events tab, and:

All events in the network

Click the Show Event History hyperlink

Latest 4,000 Events

Click the Show Active Events hyperlink

All events generated by a device group, series, type, location group, or user-defined group

Choose a group from the left sidebar menu

Events in last x minutes, hours, or days

Click the Show drop-down filter list and choose the appropriate filter

Non-informational events generated in the last hour

From the Show drop-down filter list, choose Non-info events in last hour

Events using customized filters

Create and save an advanced filter (see Find and View Alarms)

Configure an Event or a Syslog as an Alarm

You can configure an event to generate an alarm. The event can be a trap or a syslog.

To configure an event or a syslog as an alarm:

Procedure


Step 1

Open the configuration file PKT_INFRA-FM_EvenTypes.xml under <XMP_HOME/conf/fault/event/eventTypes.

Step 2

Create a Bean ID with a unique alphanumeric string without any special characters or space, except “_” and “-”.

Step 3

Set the name, message, and description as required.

Step 4

Set the following values as below:

  • defaultCategory = Optical Transport

  • defaultSeverity = Severity of the syslog you want to configure

  • clearBy= Event

Step 5

Save the configuration file. The alarm for the event reflects under the Alarms tab under Alarms and Events, without the need to restart Cisco EPN Manager.

You can check the log file, decap.core.java.log to see syntax errors.

Note


When you configure an event or a syslog as an alarm, you cannot clear the alarm using the GUI of Cisco EPN Manager. The alarm is automatically cleared when the corresponding event is cleared.


Export Alarms, Events or Syslogs to a CSV or PDF File

Use this procedure to save alarms, events or syslogs as a CSV or PDF file.

Procedure


Step 1

Navigate to the data you want to export.

  • Alarms—Choose Monitor > Monitoring Tools > Alarms and Events, then click the Alarms or Cleared Alarms or Correlated Alarms tab. or Service Affecting Alarms.

  • Events—Choose Monitor > Monitoring Tools > Alarms and Events, then click the Events tab.

  • Syslogs—Choose Monitor > Monitoring Tools > Alarms and Events, then click the Syslogs tab.

Step 2

If you have a very large amount of data, apply a filter; otherwise the export process may take some time.

Step 3

Click at the top right of the table to open the Export dialog box.

Step 4

Choose CSV or PDF, click OK, and save the file.

To export the events for a particular alarm, in the Alarms tab, hover the mouse over the "i" icon next to the particular alarm. In the pop-up window that opens, click at the top right corner to perform the export operation.


What is an Alarm Policy?

An Alarm Policy is a filtering method that allows you to control the alarms on network conditions, thereby reducing noise in the system. With Alarm policies, you can control the alarms generated in the network based on conditions you specify. To view the list of alarm policies, navigate to Monitor > Monitoring Tools > Alarm Policies. You can create, edit, delete, and rank alarm policies.

Alarm policy includes one or more conditions and an action. Cisco EPN Manager applies the action to any events or alarms that meet all the specified conditions.


Note


Newly created alarm policies do not apply retrospectively on alarms generated prior to the policy creation.


You can create alarm policies to perform the following actions:

  • Suppress alarms—Does not generate alarms for the selected events. But, events are created and saved normally.

  • Suppress events and alarms—Does not create events and alarms.


Note


For entsensor alarms, you must use the Alarm Policy feature to suppress the alarm by using the Suppress Alarms option. Do not use the Suppress Alarms and Events option.


Alarm Policy Ranks

Cisco EPN Manager determines the priority or execution order of an Alarm Policy based on its rank. When two or more policies apply to the same alarm or event, Cisco EPN Manager executes the Alarm Policy with a higher rank. By default, Cisco EPN Manager ranks alarm policies in the order in which they are created.

Points to remember when you rank the alarm policies are:

  • Alarm policies are ranked in ascending order. So, a policy with a lower number has higher priority.

    For example, an alarm policy with rank 1 has higher priority than an alarm policy with rank 10.

  • A policy with highest priority is applied first, followed by the next highest, and so on.

  • Policies with a higher rank may affect the behavior of a policy with a lower rank or may even override the lower-ranking policy entirely.

  • Cisco EPN Manager does not suppress alarms in the following instances if a higher-rank alarm suppression policy has already been applied to the event.

To change the rank of an Alarm Policy:

Procedure


Step 1

Navigate to Monitor  > Monitoring Tools  > Alarm Policies.

Cisco EPN Manager lists the alarm policies in the order in which they are created.

Step 2

Select the Alarm Policy for which you want to change the ranking.

Step 3

Click the Move To icon and enter the ranking number in the Row field or click the Move up icon or Move down icon and change the ranking order.


View Alarm Policies

Procedure


Step 1

Choose Monitor > Monitoring Tools > Alarm Policies.

All the alarm polices are listed in the this page.

Step 2

Click the Expand icon to view the policy details.


Create a New Alarm Policy

To create a new Alarm Policy:

Procedure


Step 1

Choose Monitor > Monitoring Tools > Alarm Policies.

Step 2

Click the Add icon and choose the policy type from the Select A Policy Type window.

The Create a New Alarm Policy wizard appears.

Step 3

In the Policy Attributes page, enter the Name, Description (optional), and choose the type of action you want to perform.

Step 4

Choose one of the following options under Action Options tab.

  • Suppress Permanently.

  • Display if the condition persists for this duration (minutes); and select the time duration using the time slider.

    Note

     
    This tab is enabled only if you have chosen Suppress Alarms in step 3.

Step 5

Choose the Device groups.

If you do not select any device the policy applies to all devices.

Step 6

Choose the alarms or events that you want to suppress based on the action chosen in the Policy Attributes page.

Step 7

Click Summary to view the details of the policy. If you wish to change the settings, navigate to the respective page and make the desired changes.

Step 8

Click Finish.


Edit an Existing Alarm Policy

To edit an Alarm Policy:

Procedure

Procedure


Step 1

Choose Monitor > Monitoring Tools > Alarm Policies.

Step 2

Choose the policy and then click the Edit icon.

Clicking this icon starts the Edit Alarm Policy wizard.

Step 3

In the Policy Attributes page, check and modify the Description if required.

Note


You cannot edit the policy name and action chosen while creating the policy.

Step 4

The remaining steps in the Edit Alarm Policy wizard are same as the steps in Create a New Alarm Policy wizard. See Create a New Alarm Policy.

Step 5

Click Finish to save the changes or click Cancel to discard.


Delete Alarm Policy

To delete the alarm policy:

Procedure

Procedure


Step 1

Choose Monitor > Monitoring Tools > Alarm Policies.

Step 2

Choose the alarm policy which you wish to delete and click the Delete icon.

Step 3

Click Yes in the Delete Confirmation dialog box to delete, or No to cancel.


Alarms and Events Notification Policies

You can create policies for sending notifications on specific alarms of interest that are generated from particular device groups, to specific recipient groups.

For more information see the section Event Receiving, Forwarding, and Notifications in the chapter Fault Management Administration Tasks.

Respond to Problems Within Cisco EPN Manager

Cisco EPN Manager generates internal SNMP traps to monitor its own functions—such as server CPU and disk utilization, fan and power supply failures, and high availability (HA) state changes. For information on these types of events, see Troubleshoot Server Internal SNMP Traps.