Plan Comparison Reports
Comparison reports let you compare objects between two plan files to determine:
-
Which objects are present in one plan, but not in the other.
-
Which objects are present in both plans and which, if any, have different properties.

You can run four types of plan comparison reports:
-
IP/MPLS topology and configuration—Objects describing the topology (such as nodes, circuits, and interfaces), configured objects (such as LSPs and LSP paths), and related properties (such as IGP metrics and capacity).
-
Demand routings—Demand paths and the properties that indicate routing changes, such as Path Length and Max Latency. For a complete list of compared properties, see Table 1.
-
LSP routings—Properties of LSPs that indicate routing changes, such as TE Path Metric and Active Path Sim. For a complete list of compared properties, see Table 2.
-
Complete plan comparison—All tables in the table schema are compared, except for internal simulation caching tables. For a complete list of these tables, refer to the $CARIDEN_HOME/docs/table_schema file.
Report Columns
Each WAE Design table has key columns that uniquely identify objects. For example, the key columns in the Interfaces table are the Node and Interface columns, which represent the name of the node containing the interface and the name of the interface itself. In a Plan Comparison report, an object in one plan is identified with an object in another plan only if the key columns of the two objects match. That is, key columns determine if an object is present in both plans or in only one of the plans.
The Plan Comparison report displays three other types of columns. Table 1, Table 2, and Table 3 list the properties reported upon and their associated column type.
-
Information only (Info)—There are no comparisons made. Information is reported for the plan file from which you are running the report (Plan 1).
-
Differences (Diff)—Specific properties are compared for each object that has matching key columns across the two plan files. Objects are then identified as belonging in either Plan 1 only (file from which you are running the report), in Plan 2 only (plan file to which you are comparing), or in both Plan 1 and Plan 2. If the object exists in both plan files, but has different properties, a Diff column shows T (true) if there are any differences or F (false) if there are none.
Differences are based on the current state of the open plan files. For example, if a circuit has failed, the demand routings change to route around the failure.
-
Summary Differences (Summ Diff)—These are not columns within WAE Design tables. They are T/F (true or false) values, depending on some differences in the table objects that are not represented in the table columns. For example, if a common LSP path is configured differently between plans, this difference is represented in a summary difference column in the LSP section. If demand routings differ, this is represented in a summary difference column in the Demands section.

Note
For easy reference, the following tables list columns in the order of type first: Key, Info, Diff, and Summ Diff. Properties within each column type are alphabetical.
|
Compared Table |
Compared Columns |
Comparison Column Type |
Summary Difference Description |
|---|---|---|---|
|
Interfaces |
Name |
Key |
|
|
Node |
Key |
||
|
Remote Node |
Info |
||
|
Affinities |
Diff |
||
|
Area |
Diff |
||
|
Capacity |
Diff |
||
|
Circuit |
Diff |
||
|
Description |
Diff |
||
|
FRR Protect |
Diff |
||
|
IGP Metric |
Diff |
||
|
IP Address |
Diff |
||
|
PC Min BW |
Diff |
||
|
PC Min Links |
Diff |
||
|
Resv BW |
Diff |
||
|
TE Metric |
Diff |
||
|
Circuits |
InterfaceA |
Key |
|
|
InterfaceB |
Key |
||
|
NodeA |
Key |
||
|
NodeB |
Key |
||
|
Name |
Info |
||
|
Active |
Diff |
||
|
Capacity |
Diff |
||
|
Delay |
Diff |
||
|
Nodes |
Name |
Key |
|
|
Active |
Diff |
||
|
AS |
Diff |
||
|
BGP ID |
Diff |
||
|
ECMP Max |
Diff |
||
|
IP Address |
Diff |
||
|
IP Manage |
Diff |
||
|
Model |
Diff |
||
|
OS |
Diff |
||
|
Vendor |
Diff |
||
|
LSPs |
Node |
Key |
|
|
Source |
Key |
||
|
Active |
Diff |
||
|
Destination |
Diff |
||
|
Exclude |
Diff |
||
|
FRR Link Protect |
Diff |
||
|
Hold Pri |
Diff |
||
|
Hop Limit |
Diff |
||
|
Include |
Diff |
||
|
Include Any |
Diff |
||
|
Load Share |
Diff |
||
|
Metric |
Diff |
||
|
Metric Type |
Diff |
||
|
Setup BW |
Diff |
||
|
Setup Pri |
Diff |
||
|
Unresolved Destination |
Diff |
||
|
LSPs Path Diff |
Summ Diff |
T (true) if there are any differences in the LSP Paths table for this LSP. If two LSPs have differences in their named path hops or LSP paths, these differences are propagated to this column. |
|
|
LSP Paths |
Node |
Key |
|
|
Path Option |
Key |
||
|
Source |
Key |
||
|
Exclude |
Diff |
||
|
Hold Pri |
Diff |
||
|
Hop Limit |
Diff |
||
|
Include |
Diff |
||
|
Include Any |
Diff |
||
|
Path Name |
Diff |
||
|
Setup BW |
Diff |
||
|
Setup Pri |
Diff |
||
|
Standby |
Diff |
||
|
Named Path Diff |
Summ Diff |
T (true) if there are any differences in the Named Paths table for this LSP path. |
|
|
Named Paths |
Active |
Key |
|
|
Name |
Key |
||
|
Source |
Key |
||
|
Named Path Hops Diff |
Summ Diff |
T (true) if there are any differences in the Named Path Hops table for this named LSP path. |
|
|
Named Path Hops |
Name |
Key |
|
|
Source |
Key |
||
|
Step |
Key |
||
|
Interface |
Diff |
||
|
IP Address |
Diff |
||
|
Node |
Diff |
||
|
Type |
Diff |
||
|
Unresolved Hop |
Diff |
|
Compared Table |
Compared Columns |
Comparison Column Type |
Summary Difference Description |
|---|---|---|---|
|
Demands |
Destination |
Key |
|
|
Name |
Key |
||
|
Service Class |
Key |
||
|
Source |
Key |
||
|
Destination Site |
Info |
||
|
Source Site |
Info |
||
|
Active |
Diff |
||
|
ECMP Min % |
Diff |
||
|
Max Latency |
Diff |
||
|
Path Metric |
Diff |
||
|
Path Diff |
Summ Diff |
T (true) if there are any differences in routing of the demand. |
|
Compared Table |
Compared Columns |
Comparison Column Type |
Summary Difference Description |
|---|---|---|---|
|
LSPs |
Name |
Key |
|
|
Source |
Key |
||
|
Active Path Sim |
Diff |
||
|
Destination |
Diff |
||
|
Routed |
Diff |
||
|
Shortest TE Path |
Diff |
||
|
TE Path Metric |
Diff |
||
|
Actual Path Diff |
Summ Diff |
T (true) if there are any differences in routing of the actual LSP path. |
|
|
Simulated Path Diff |
Summ Diff |
T (true) if there are any differences in routing of the LSP. |
Report Sections
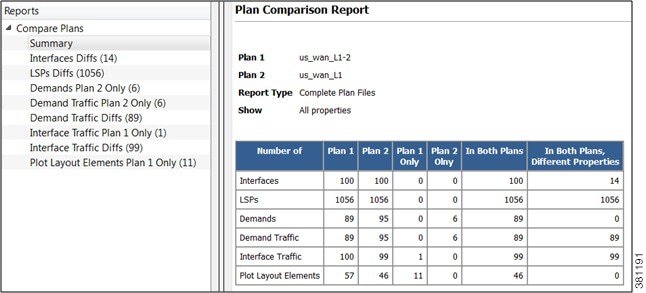
The Summary section shows the number of objects in each plan file, the number of objects in both plan files, and the number of objects with property differences (Example Plan Comparison Report Summary).
Example: Nodes A, B, and C are in Plan 1, and B, C, and D are in Plan 2. Nodes B and C have matching key columns. The B nodes have identical properties, but the C nodes have different IP addresses. Therefore, in the Summary section, the In Both Plans column shows 2, and the Different Properties column shows 1.
An individual section is generated for each object that appears in only one plan file and if there are differences between the properties, a section is generated showing these differences. Thus, there is the potential of generating one to three sections per compared table: one for objects appearing only in Plan 1, one for objects appearing only in Plan 2, and one listing objects existing in both plan files, along with their differences noted with a T (true) or F (false).
Other than Summary, the report sections and columns (properties) that appear depend on the options selected when generating the report.
-
If you select to show only properties with differences, only those columns with differences in properties appear in the report. If only one value is different, all objects are listed (not just the one with the different property).
-
If you select to show all properties compared, all compared properties appear in the report whether there are differences between the two plan files or not.
Creating Plan File Comparison Reports
Procedure
|
Step 1 |
Open the two plan files you want to compare. |
|
Step 2 |
In either of these two plan files, choose Tools > Reports > Compare Plans. |
|
Step 3 |
Choose the plan file to which you are comparing the open plan. |
|
Step 4 |
Choose the type of comparisons you want to generate:
|
|
Step 5 |
Choose whether to show only properties with differences or whether to show all properties compared. |
|
Step 6 |
Click OK. |


 Feedback