Underlay Measurement and Tracing Services

Table 1. Feature History

Feature Name

Release Information

Description

Underlay Measurement and Tracing Services

Cisco IOS XE Catalyst SD-WAN Release 17.10.1a

Cisco Catalyst SD-WAN Control Components Release 20.10.1

The underlay measurement and tracing services (UMTS) feature provides visibility into the exact paths that tunnels take between local and remote Cisco IOS XE Catalyst SD-WAN devices, through the underlay network (the physical devices that comprise the network). For a specific tunnel, the path includes all the nodes between the two devices.

You can enable UMTS using Cisco SD-WAN Manager. You can view the resulting path information in Cisco SD-WAN Manager and in Cisco SD-WAN Analytics.

Information About Underlay Measurement and Tracing Services

UMTS provides visibility into the exact path that a tunnel takes between local and remote Cisco IOS XE Catalyst SD-WAN devices, through the underlay network (the physical devices that comprise the network). For a specific tunnel, the path includes all the nodes between the two devices.

When a device creates an IPsec or GRE tunnel to a remote device, connecting through devices in the underlay network, more than one path may be possible from the local device to the remote device. The number of paths and the hops in the paths depend on the variability of the underlay network. The path that a tunnel takes through the underlay network can change over time. For example, if a tunnel uses a path that includes router A, and if router A becomes unavailable later, the tunnel will require a different path.

Each possible path through the underlay network is called a candidate path. The actual path that the tunnel is using at the moment is called the exact path. UMTS traces only the exact path. It does not discover or trace candidate paths.

The following illustration shows an underlay network that provides multiple paths for a tunnel between Device 1 and Device 2, and shows the exact path used by the tunnel.
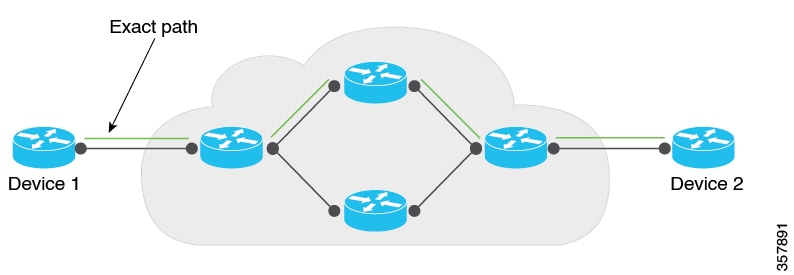
Figure 1. Exact Path
Exact-Path

You can trace the path of the tunnels in a network using one of these options:

  • Monitoring: Trace tunnel paths regularly according to a configured time interval.

  • Event-Driven: Trace tunnel paths when triggered by one of the following events:

    • A change in the service-level agreement (SLA) for the tunnel.

    • A change in the path maximum transmission unit for the tunnel.

  • On demand: Trace the path of tunnels on demand, and display the results in Cisco SD-WAN Manager. For information, see View Exact Paths On Demand.

Mechanism for Underlay Measurement and Tracing Services

For UMTS interval-based monitoring and event-driven monitoring, Cisco SD-WAN Manager provides monitoring configuration (interval, event types) as part of the overall device configuration. In accordance with the configuration, Cisco IOS XE Catalyst SD-WAN devices use an UMTS probe packet mechanism to trace the exact paths of tunnels across all hops, and collect network metrics such as delay and loss. Latency is only supported hop by hop.

The devices send the resulting information to Cisco SD-WAN Manager, which in turn, sends it to Cisco SD-WAN Analytics. Cisco SD-WAN Analytics uses the information to graphically display the exact path of the tunnels in the network.

For the on-demand option, Cisco SD-WAN Manager sends a request to the Cisco IOS XE Catalyst SD-WAN devices in the network to probe the network and trace the exact paths of tunnels. This request is in the form of a NETCONF action, and not a device configuration. The devices use the UMTS probe packet mechanism to trace the exact paths of the tunnels across all the hops, and to collect network metrics such as delay and loss. The devices send the resulting information to Cisco SD-WAN Manager, and Cisco SD-WAN Manager graphically displays the exact path of the tunnels in the network.

Benefits of Underlay Measurement and Tracing Services

UMTS provides details of the exact path of each Cisco Catalyst SD-WAN tunnel, which can be useful in identifying problems with the tunnels.

Prerequisites for Underlay Measurement and Tracing Services

  • To view the exact path graphs in Cisco SD-WAN Analytics, you must enable application visibility and flow visibility.


    Note


    This prerequisite does not apply to on-demand viewing of graphs in Cisco SD-WAN Manager.


    For more information about configuring application visibility and flow visibility, see Configure Global Application Visibility, Configure Global Flow Visibility.

  • Data Stream must be enabled in Cisco SD-WAN Manager (from the Cisco SD-WAN Manager menu, choose Administration > Settings) to trace the path of tunnels on demand and display the results in Cisco SD-WAN Manager.

  • Cisco SD-WAN Manager and Cisco SD-WAN Analytics must be integrated to view visualizations in Cisco SD-WAN Analytics. For more information about integrating Cisco SD-WAN Analytics with Cisco SD-WAN Manager, see Onboarding Cisco vics.

Restrictions for Underlay Measurement and Tracing Services

  • UMTS is supported only on Cisco Catalyst SD-WAN tunnels using IPv4 addresses.

  • For the interval- and event-driven options, you can view the graphical representation of the exact paths only in Cisco SD-WAN Analytics. For the on-demand option, you can view the exact paths in Cisco SD-WAN Manager.

  • Cisco SD-WAN Analytics UMTS graphs cannot distinguish between monitoring records and SLA and path maximum transmission unit events.

  • Jitter and loss measurements are not supported.

Configure Underlay Measurement and Tracing Services

Configure UMTS Using Configuration Group

  1. From the Cisco SD-WAN Manager menu, choose Configuration > Templates > Configuration Groups.

  2. Click adjacent to the configuration group name and choose Edit.

  3. Click System Profile.

  4. Click Add Feature.

  5. From the Type drop-down list, choose Performance Monitoring.

  6. In the Feature Name field, enter a name for the feature.

  7. In the Description field, enter a description for the feature.

  8. Click Underlay Measurement Track Service.

  9. To trace the tunnel paths regularly, based on a time interval, do the following:

    1. From the Monitoring drop-down list, choose Global.

    2. Click the toggle button to enable the continuous monitoring option in UMTS.

    3. In the Monitoring Interval (Minutes) drop-down list, choose a time.

      This option enables you to monitor the exact path during a specific time period.

  10. To trace tunnel paths when triggered by an event, do the following:

    1. Click the Event Driven drop-down list, and choose Global.

    2. Click the Event Type drop-down list, and choose one or more event types.

    3. Click Save.

  11. Click the Associated Devices tab.

  12. From the list of Cisco IOS XE Catalyst SD-WAN devices, choose one or more Cisco IOS XE Catalyst SD-WAN devices, and then click Deploy.

  13. In the Process Overview window, click Next.

    The Selected Devices to Deploy window displays the Cisco IOS XE Catalyst SD-WAN devices selected previously.

  14. Check or uncheck the check boxes adjacent to the Cisco IOS XE Catalyst SD-WAN devices and then click Next.

  15. In the Summary window, click Deploy to deploy the configurations in the Cisco IOS XE Catalyst SD-WAN devices.


Note


With the Monitor option enabled in Cisco SD-WAN Manager, time-series data for the exact path can be generated and displayed in Cisco SD-WAN Analytics.


For more information on using configuration groups, see Configuration Groups and Feature Profiles.

Configure Underlay Measurement and Tracing Services Using a CLI Template

Use the CLI templates to configure continuous monitoring and event types for exact paths. For more information about using CLI templates, see CLI Add-On Feature Templates and CLI Templates.


Note


By default, CLI templates execute commands in global config mode.


This procedure configures interval-based monitoring and event-driven UMTS monitoring of tunnel paths.

  1. Monitor the exact paths of tunnels continually, with a specific time interval:

    sdwan 
    umts 
     monitor 
     periodicity seconds 
     local-color-all 
     remote-color-all 
     remote-system-ip-all 
    

    Tunnel periodicity range is from 10 to 4294967295 seconds.

  2. Monitor the exact paths of tunnels when triggered by a change in a tunnel's service-level agreement (SLA) or path maximum transmission unit:

    sdwan 
    event 
     event-type event-type 
     local-color-all 
     remote-color-all 
     remote-system-ip-all 
    

The following is a complete configuration example:

sdwan
umts
 monitor
 periodicity 1800
 local-color-all
 remote-color-all
 remote-system-ip-all
 !
 event
 event-type tunnel-sla-change
 local-color-all
 remote-color-all
 remote-system-ip-all
 !
 event-type tunnel-pmtu-change
 local-color-all
 remote-color-all
 remote-system-ip-all
!

Trace and View Tunnel Paths On Demand

Before You Begin

You can configure UMTS to trace exact paths at intervals or when triggered by an event. See Configure Underlay Measurement and Tracing Services.

Alternatively, you can trace tunnel paths on demand, and view the paths using this procedure.

Trace and View Tunnel Paths On Demand

  1. From the Cisco SD-WAN Manager menu, choose Monitor > Devices.

  2. Click adjacent to the corresponding device name and click Underlay Discovery.

  3. Enter the parameters required to retrieve the exact path details.

  4. Click Start.

    A graph with details about the exact path a network traffic taking is displayed.

Alternatively, you can trace and view the exact paths on demand using any of the following navigation paths in Cisco SD-WAN Manager.

  • From the Cisco SD-WAN Manager menu, choose Monitor > Tunnels, click adjacent to the corresponding tunnel name, and choose Underlay Discovery.

  • From the Cisco SD-WAN Manager menu, choose Monitor > Applications page, click adjacent to the corresponding application name, and choose Underlay Discovery.

  • In the Site Topology window, click a device or tunnel name, and then click Underlay Discovery in the right pane.

Troubleshooting Underlay Measurement and Tracing Services

Zero IP Address

Problem

Cisco SD-WAN Manager displays hops with a zero IP address (0.0.0.0) in the exact path.

Possible Causes

  • The intermediate hops in the public internet may not respond because Internet Control Message Protocol (ICMP) time exceeded messages are disabled or blocked by a firewall. In such cases, hops are shown with a zero IP address.

  • The destination edge device could be a Cisco vEdge device, which does not support UMTS.

Solution

Zero IP addresses in the exact path does not imply any functional problems with the tunnel. Verify that the zero IP address is because of one of the reasons described in Possible Causes section.

Timeout Error

Problem

A timeout error is displayed after starting an UMTS session, on demand, in Cisco SD-WAN Manager.

Possible Causes

  • You are not using the minimum required releases--Cisco IOS XE Catalyst SD-WAN Release 17.10.1a or later for Cisco IOS XE Catalyst SD-WAN devices, and Cisco Catalyst SD-WAN Control Components Release 20.10.1 or later.

  • There are network connectivity issues.

Solution

Check for the causes listed in Possible Causes section, and try the trace again.

Configuration Example for Underlay Measurement and Tracing Services

This example displays the configuration for the Monitoring and Event-Driven options configured in a Cisco IOS XE Catalyst SD-WAN device:

sdwan
umts
 monitor
 periodicity 1800
 local-color-all
 remote-color-all
 remote-system-ip-all
 !
 event
 event-type tunnel-sla-change
 local-color-all
 remote-color-all
 remote-system-ip-all
 !
 event-type tunnel-pmtu-change
 local-color-all
 remote-color-all
 remote-system-ip-all
!