Use Cases

Use Case 1: Verify a Cisco Cloud OnRamp for SaaS Policy

Assume that you have a deployment that includes several branch sites. One of these sites, the SJC branch, with a site ID of 3, has two WAN links: an MPLS link, and a public internet link through which the Microsoft cloud can be accessed directly.

In addition, assume that a Cisco Catalyst SD-WAN Cloud OnRamp for SaaS policy, which is a part of an Application-Aware Routing (App-route) policy, has been created and enabled for Microsoft Office 365 applications.

In this use case, let's see how network-wide path insight can be used to determine whether the traffic from Microsoft Office 365 applications is following the expected network path, validate that the policy is programmed correctly and operates as intended, and view the configuration of the policy.

To begin, perform the following actions to start a trace in the SJC branch:

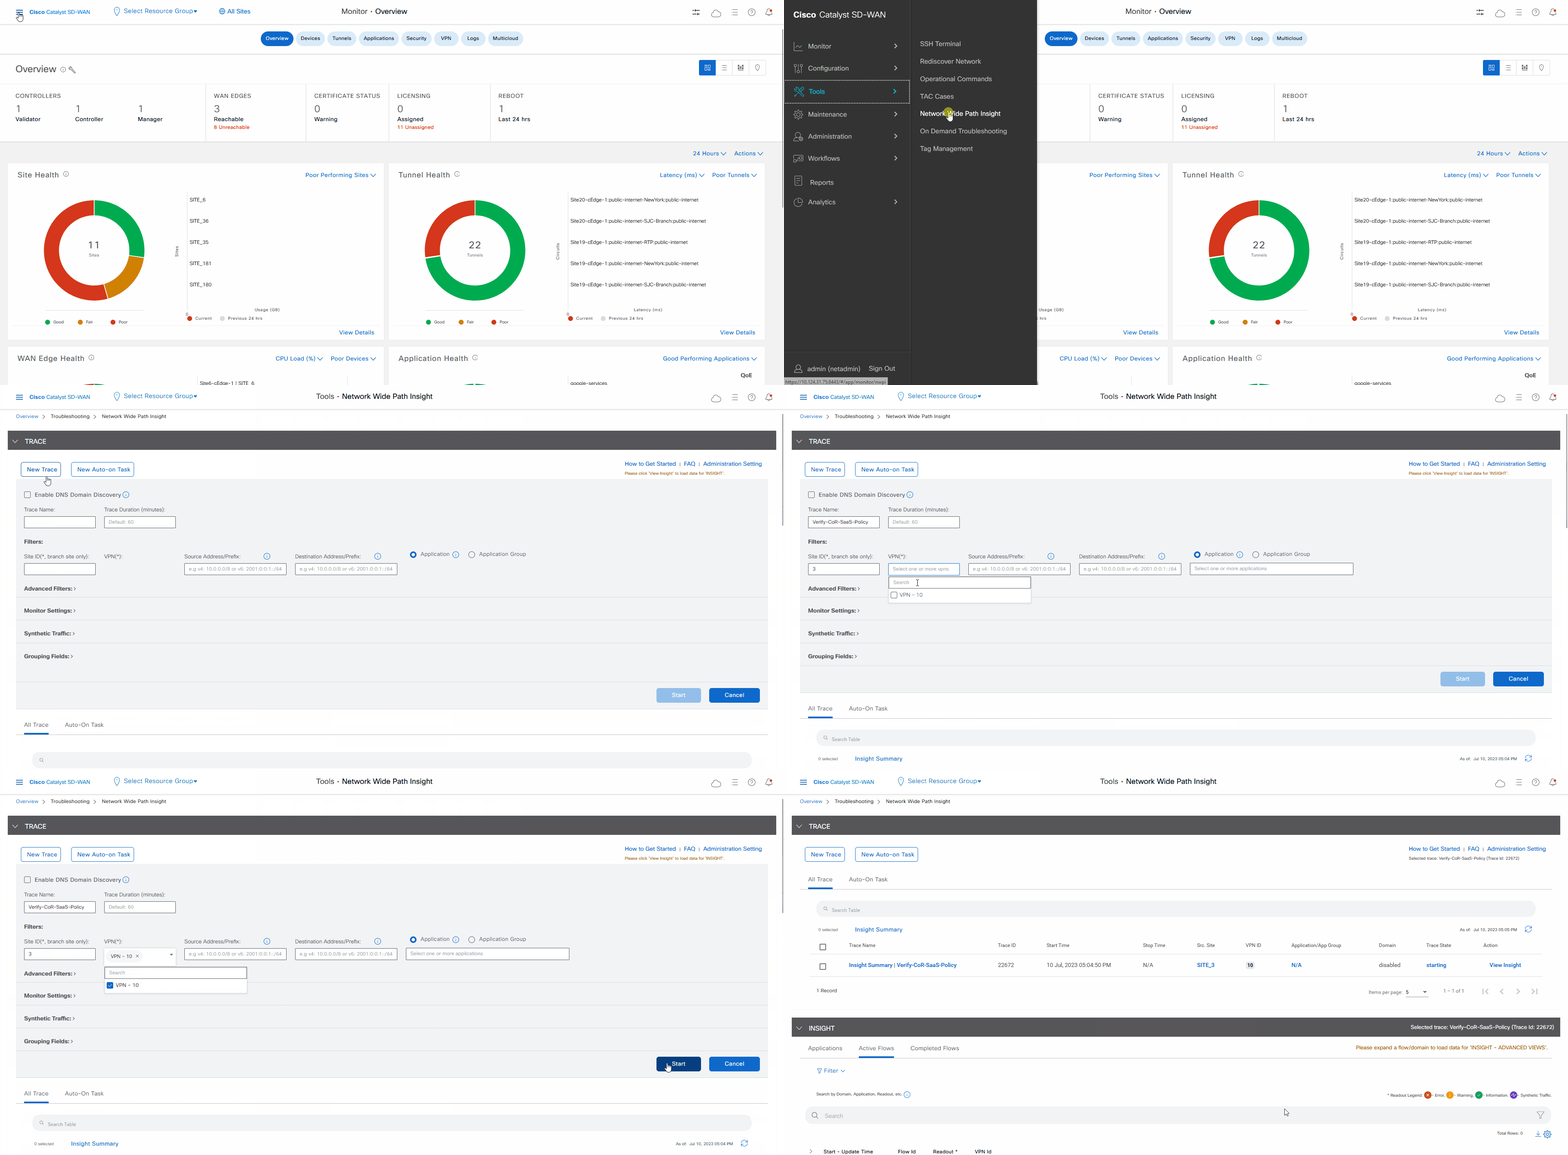
  1. From the Cisco Catalyst SD-WAN menu, choose, Tools > Network Wide Path Insight.

  2. Click New Trace.

  3. In the Trace Name field, enter a name for the trace.

    In this use case, we use the name Verify-Cor-Saas-Policy.

  4. From the VPN drop-down list, choose VPN - 10.

  5. Click Start.

Figure 1. Start a Trace

Let the trace run for approximately 5 minutes so that it can collect data, then perform the following actions to see a Sankey diagram that shows the network paths of Microsoft Office 365 applications traffic. This application-level information lets you see whether the traffic is taking the expected network path according to your Cisco Catalyst SD-WAN Cloud OnRamp for SaaS policy.

  1. In the list of traces in the All Trace tab, click Insight Summary in the row that shows the Verify-Cor-Saas-Policy trace.

  2. In the Insight Summary slide-in pane, choose the App Performance Insight tab and use the filters to see the Sankey chart that shows the network paths of Microsoft applications traffic.

    The Sankey chart shows that this traffic flows directly from the SJC branch to the SaaS cloud-based host.
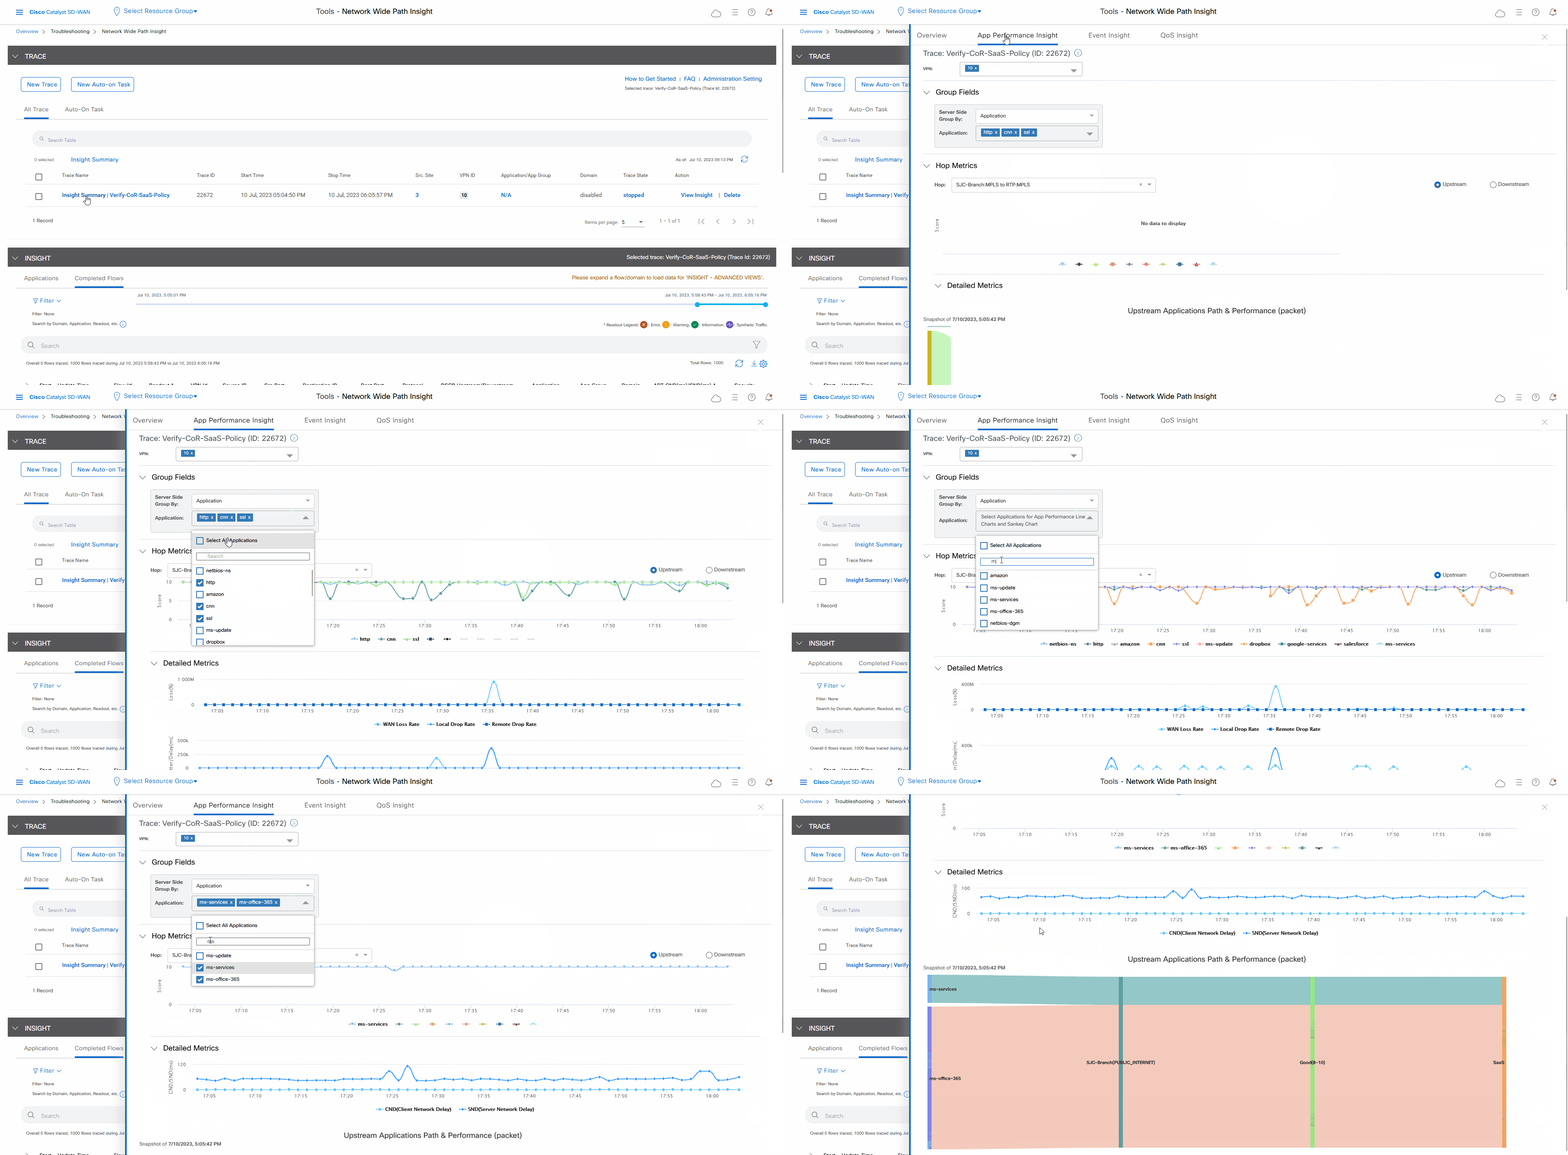
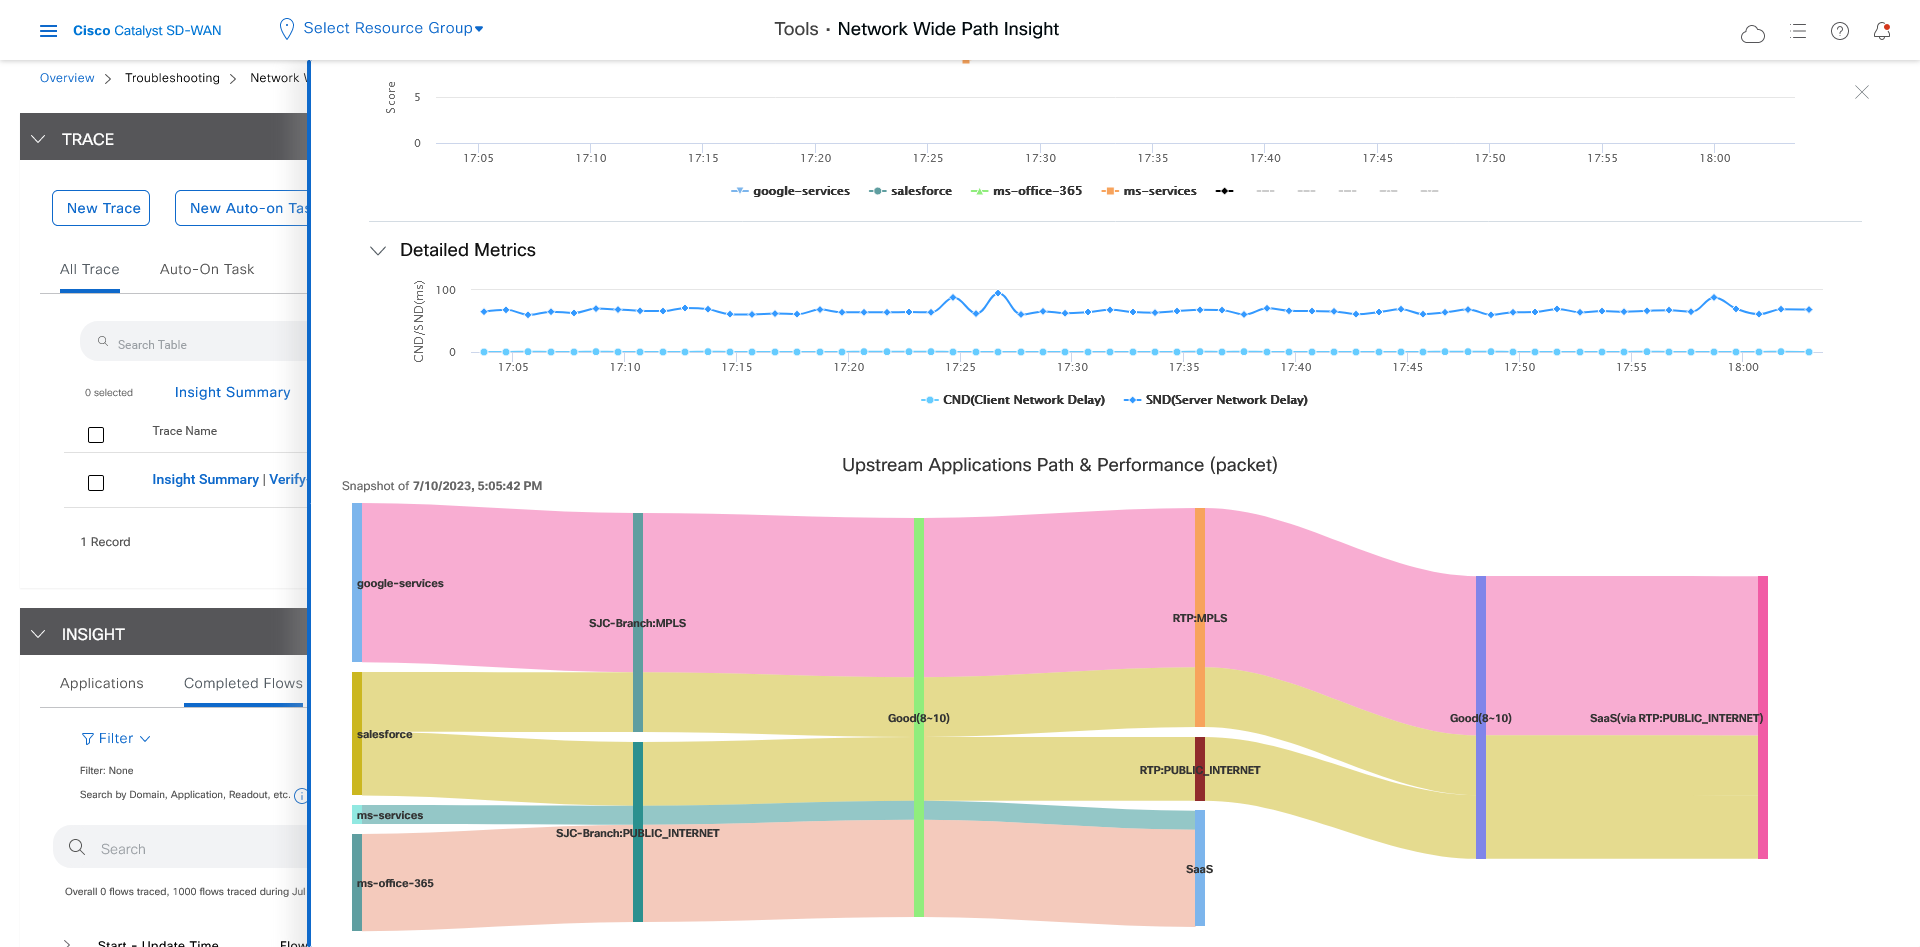
Figure 2. Display the Upstream Application Path & Performance Sankey Chart
Figure 3. Upstream Application Path & Performance Sankey Chart

After reviewing application-level data, you can check whether your Cisco Catalyst SD-WAN Cloud OnRamp for SaaS policy took effect for Microsoft Office 365 applications traffic. To do so, look at flow-level information for this traffic:

  1. In the All Trace tab, go to the Completed Flows tab in the Insight area.

  2. Search for Office.

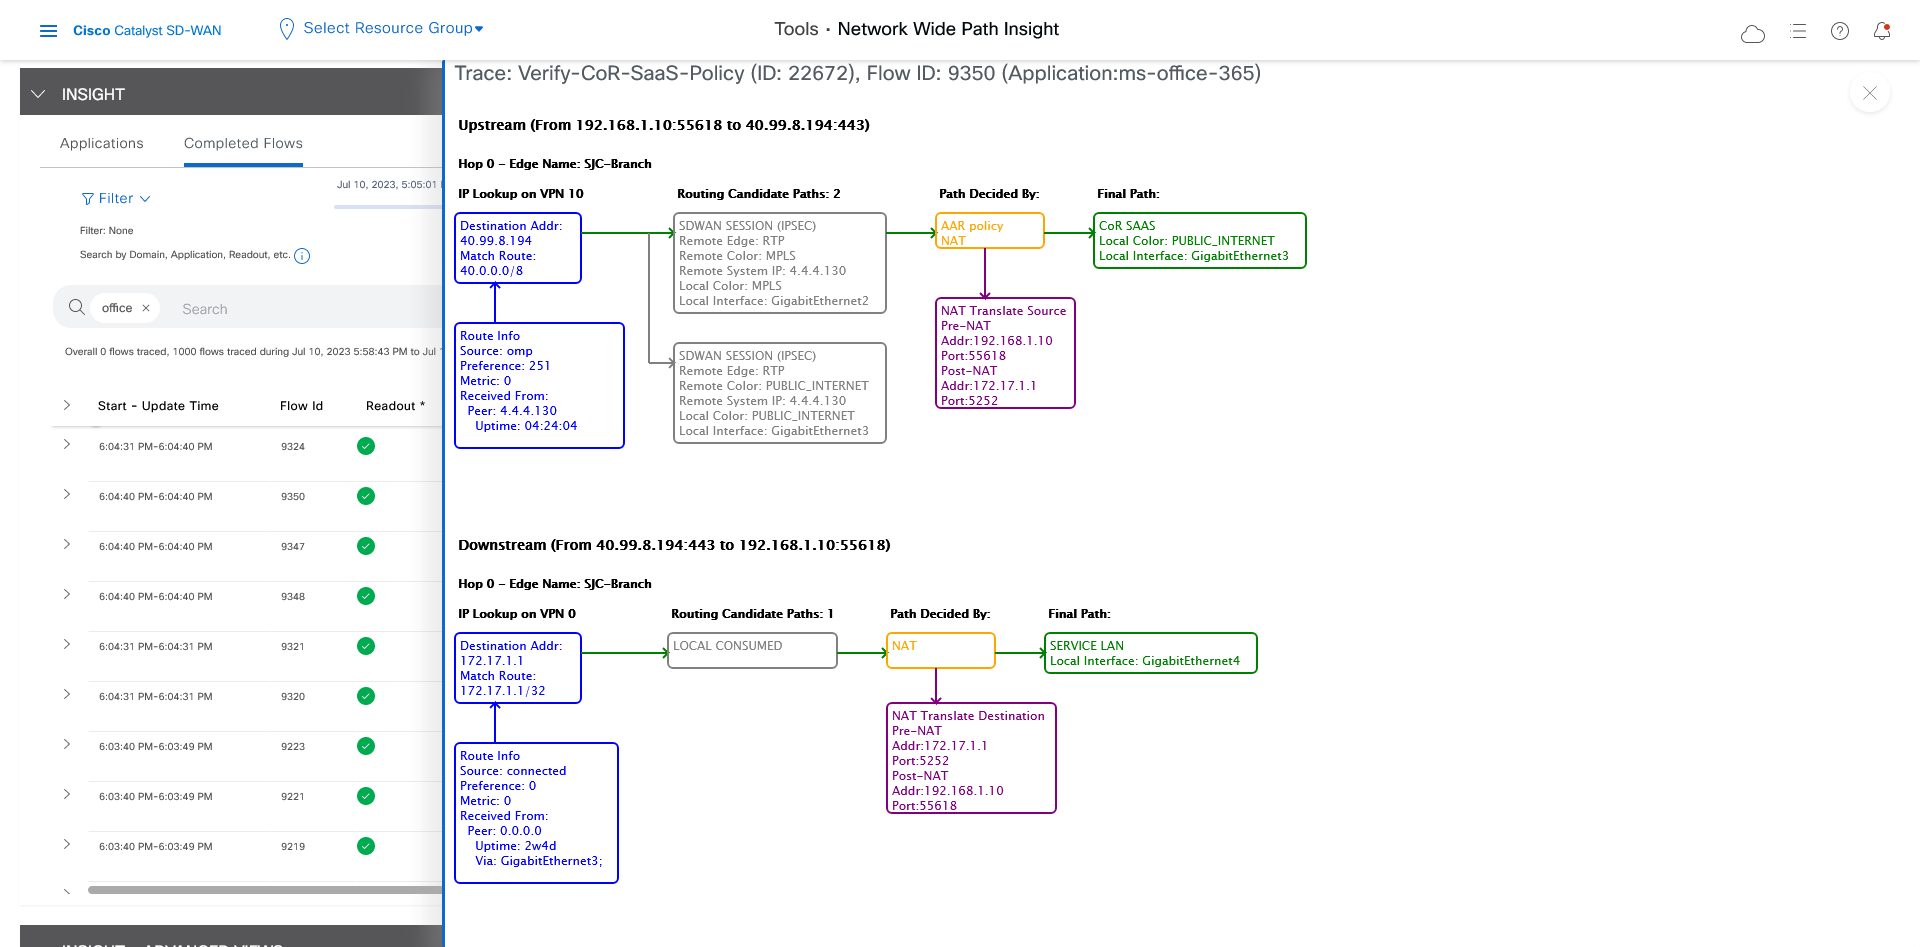
  3. For any Microsoft Office 365 flow, click the green check mark in the Readout column to display the Flow Readout slide-in pane.

  4. Click the Path Insight tab in the Flow Readout pane.
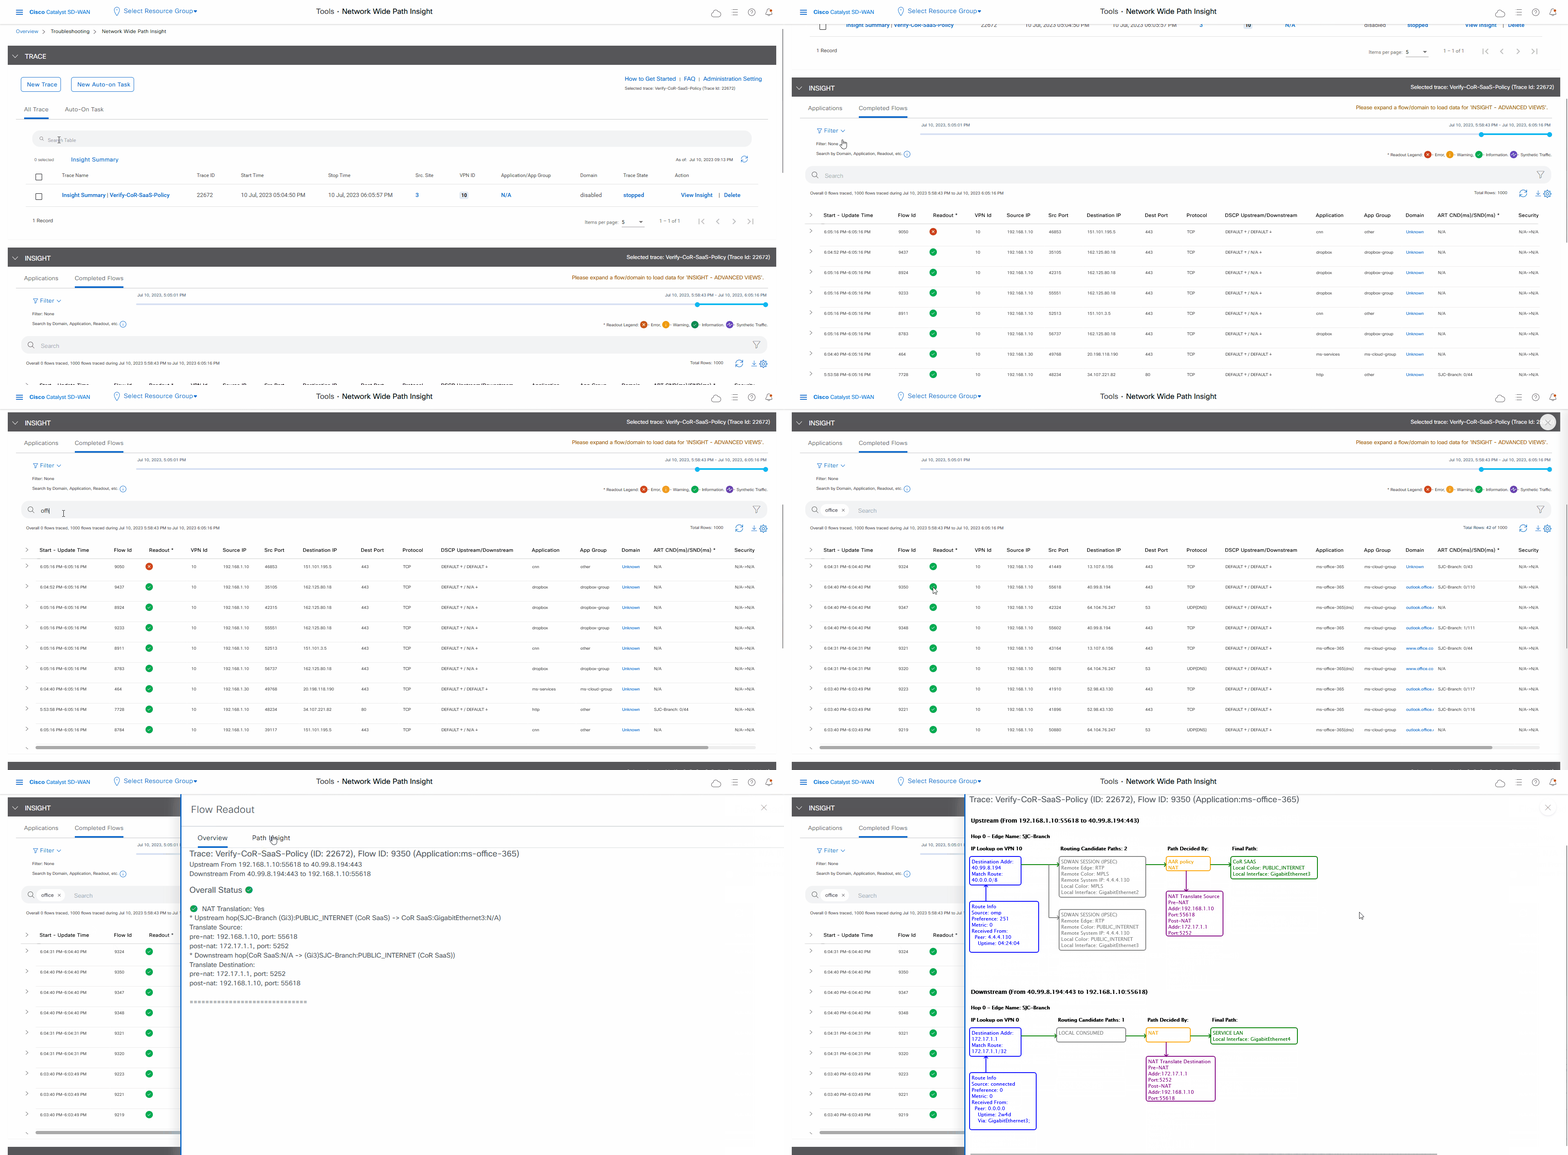
Figure 4. View Flow-Level Information
Figure 5. Flow-Level Information

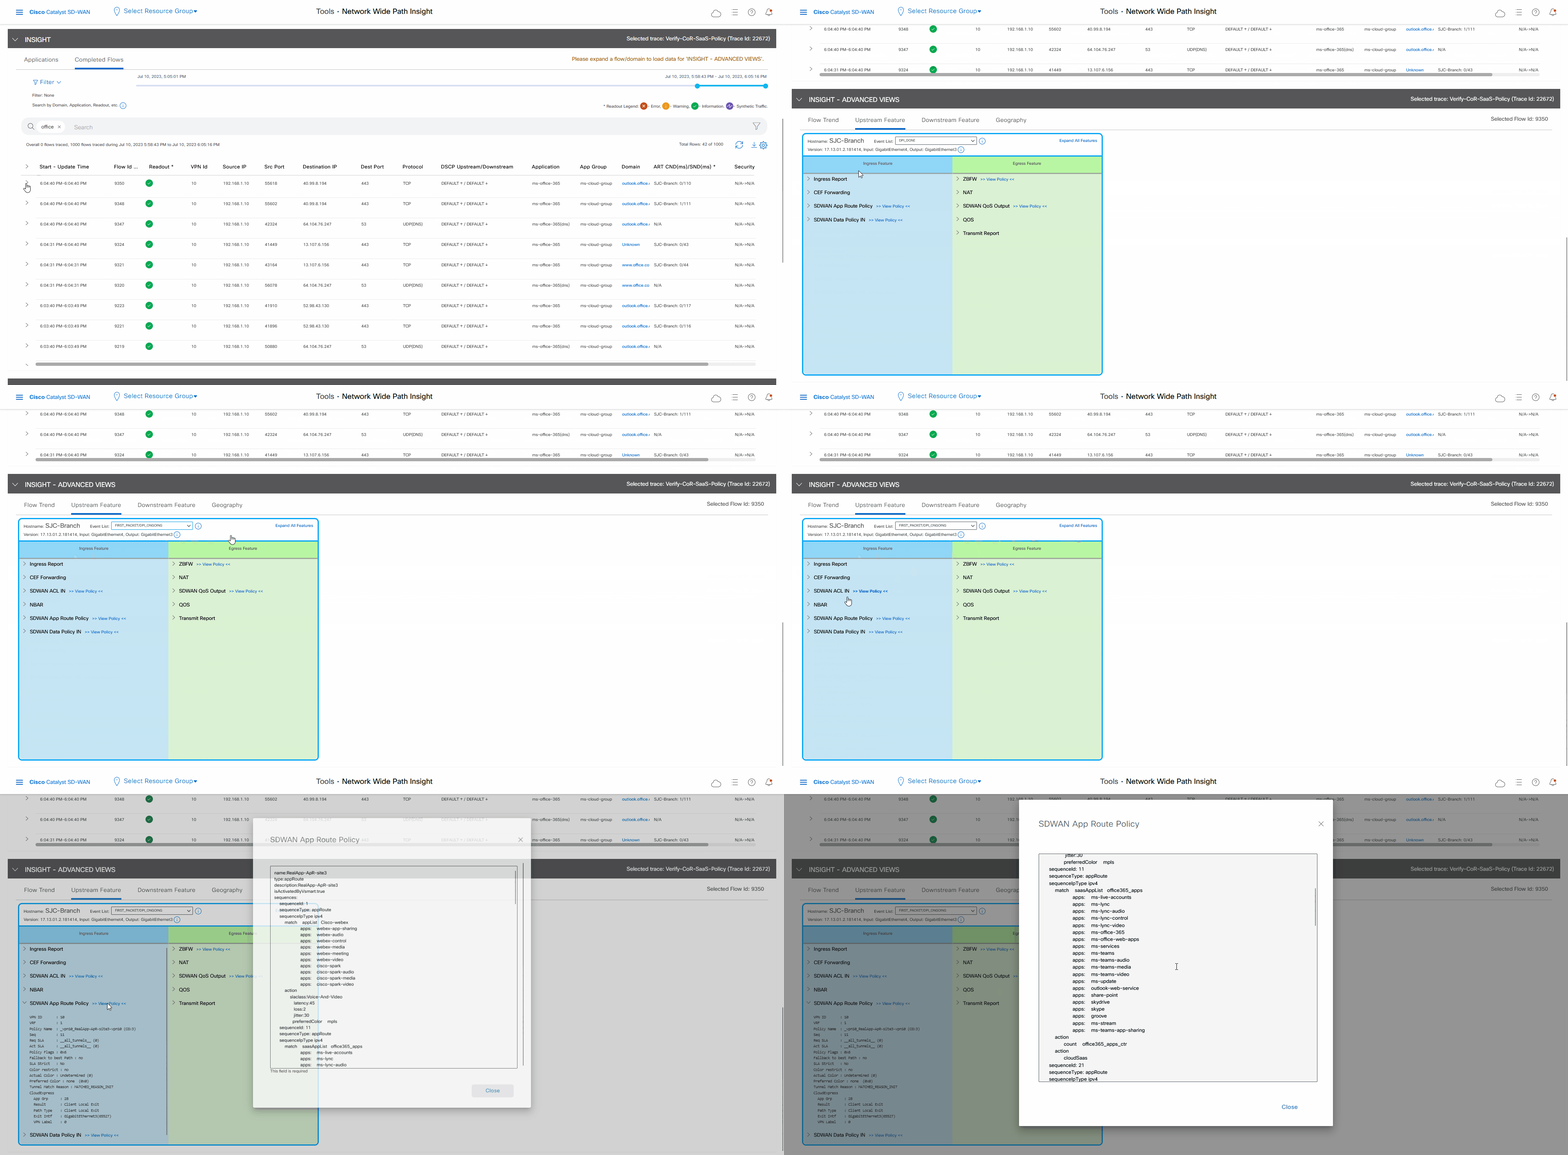
Finally, you can confirm how the App-route policy is programmed. This information lets you validate that Microsoft Office 365 applications traffic flows through the link that is intended according to your Cisco Catalyst SD-WAN Cloud OnRamp for SaaS policy, which is a part of the App-route policy.

  1. In the All Trace tab, go to the Completed Flows tab in the Insight area.

  2. Expand any Microsoft Office 365 flow by clicking the right-arrow icon at the beginning of the row.

  3. Scroll down to the Insight – Advanced Views area.

  4. In the Upstream Feature tab:

    1. Choose an event from the Event List drop-down list.

    2. Click Expand All Features to see detailed ingress and egress information about the features that are executed for the flow, then click Collapse All Features.

    3. In the Ingress Feature area, expand SDWAN App Route Policy to see policy information.

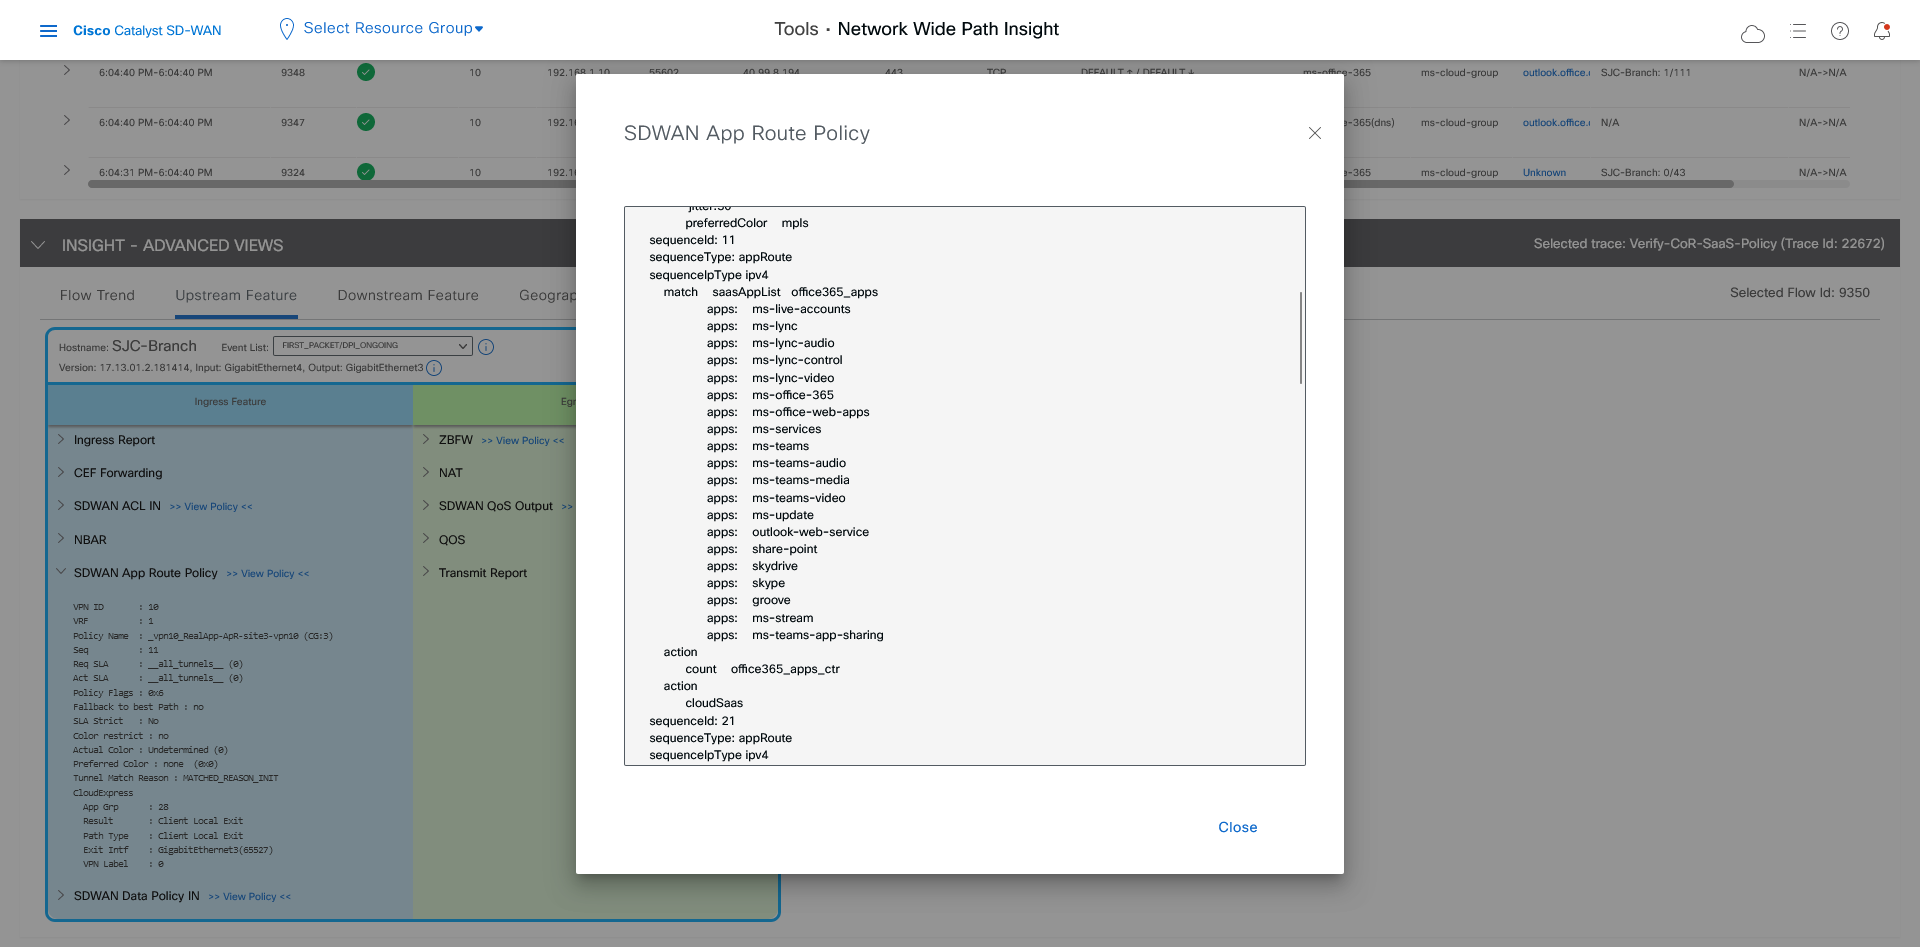
    4. Click View Policy next to SDWAN App Route Policy to see the policy programming.

Figure 6. Confirm the Programming of the App-Route Policy
Figure 7. Detailed Information about the App-Route Policy

Use Case 2: Troubleshoot Network Quality on a Website

Assume that your users have trouble accessing the Google website and experience slowness after they are able to access.

In this use case, you’ll see how to use network-wide path insight to determine the root cause of these issues.

To begin, perform the following actions to start a trace in the SJC branch:

  1. From the Cisco Catalyst SD-WAN menu, choose, Tools > Network Wide Path Insight.

  2. Click New Trace.

  3. In the Trace Name field, enter a name for the trace.

    In this use case, we use the name Troubleshooting-Google.

  4. Click Start.

Let the trace run for approximately 5 minutes so that it can collect data, then follow these steps to determine the root cause of the issue:

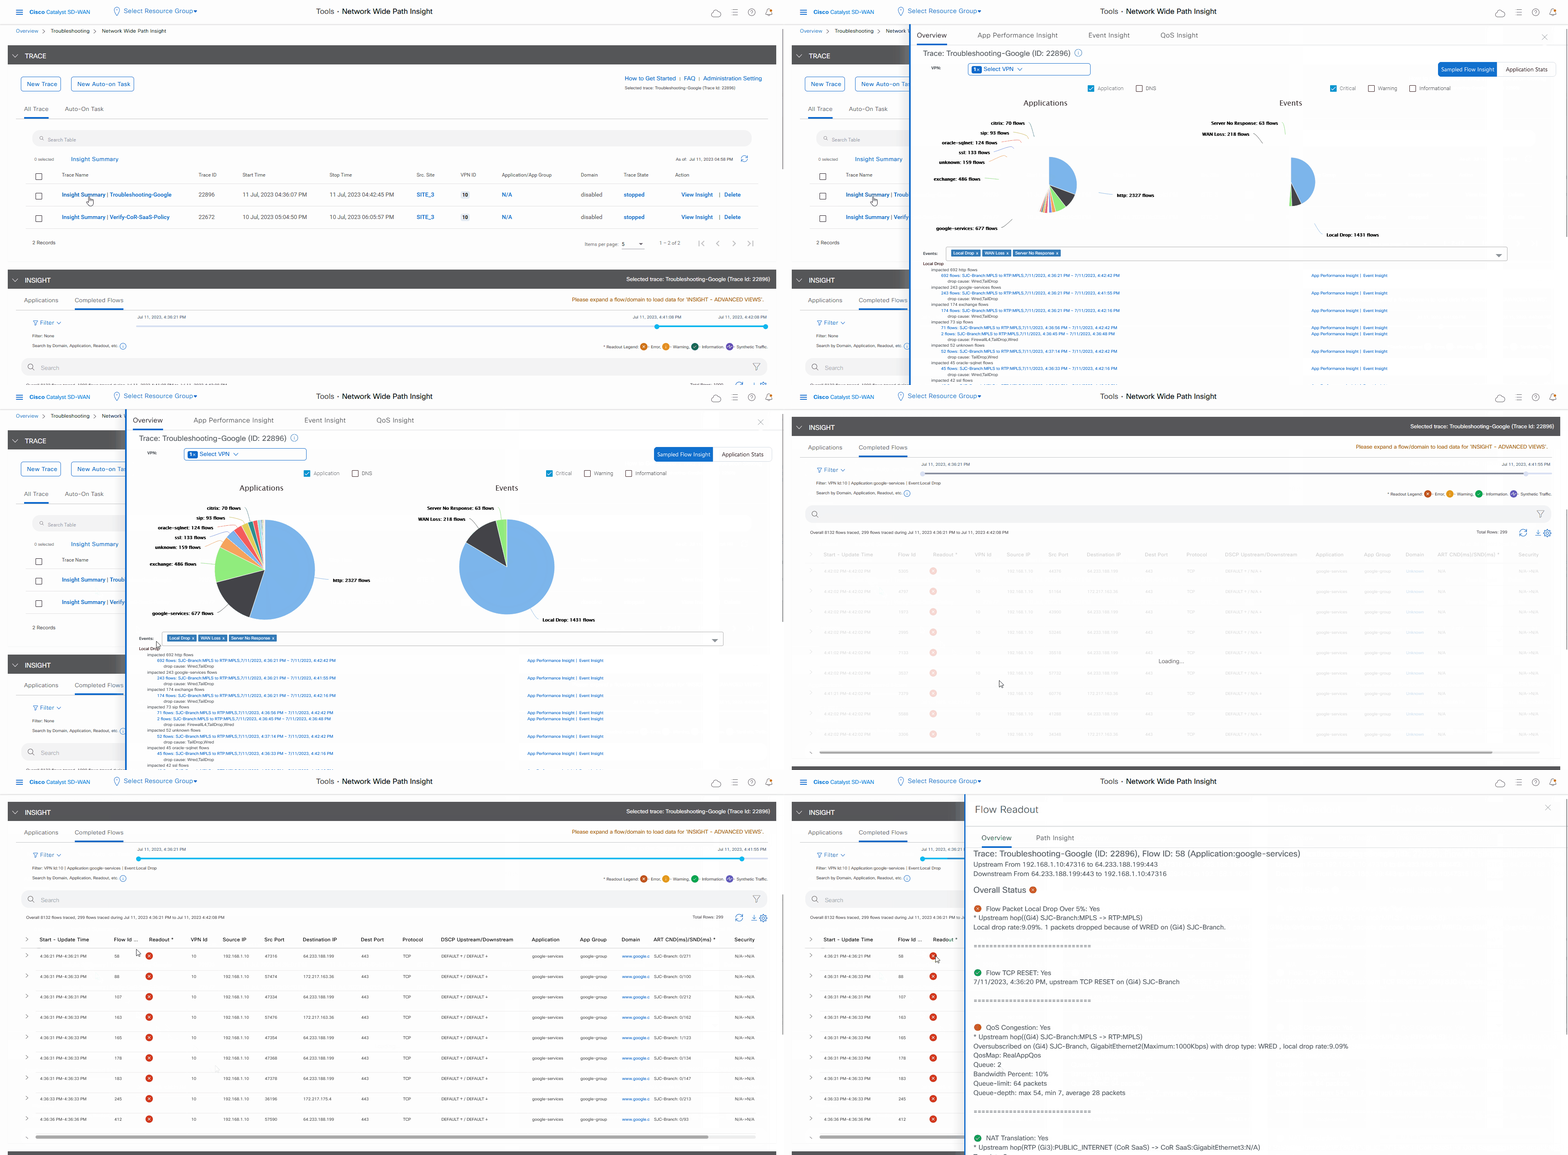
  1. In the list of traces in the All Trace tab, click Insight Summary in the row that shows the Troubleshooting-Google trace.

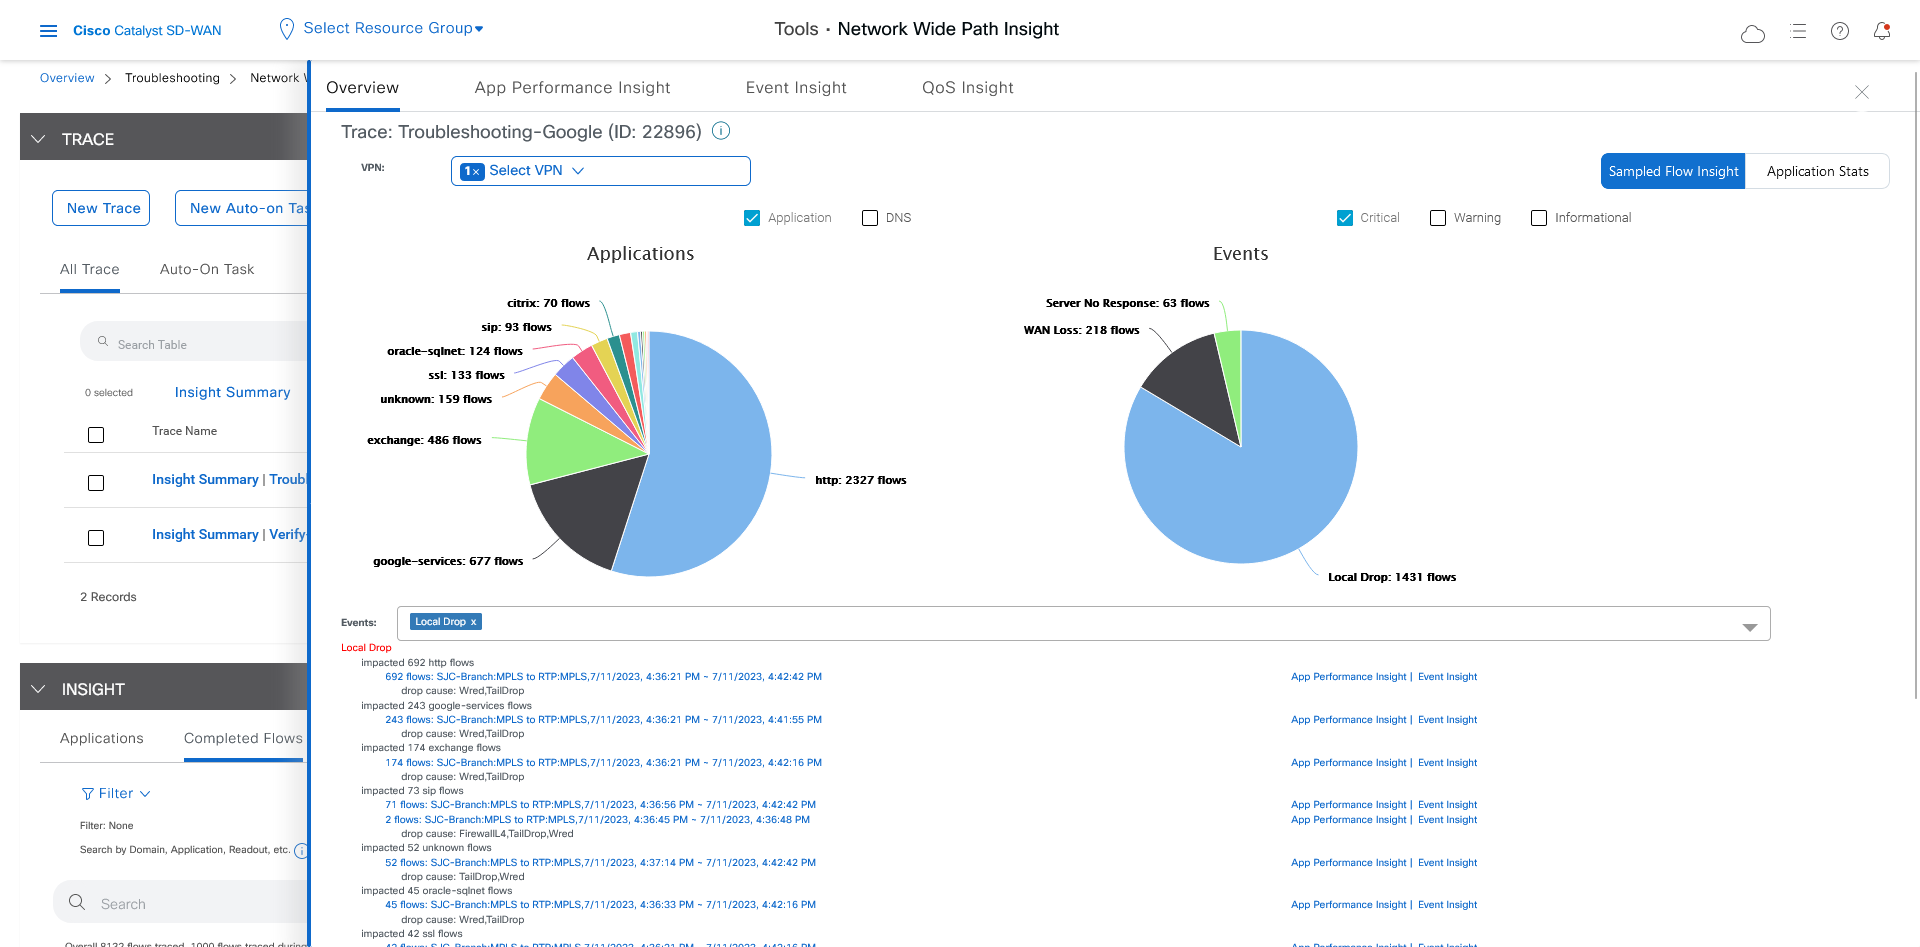
    A slide-in pane with detailed insight information appears. The Overview tab shows that 243 google-services flows are affected by local drop events and provides related detailed information for these flows.

  2. In the Events area, click the link under “impacted 243 google-services flows” to display the Completed Flows tab in the Insight area on the All Trace tab.

    Based on the link that you clicked, the table on the Completed Flows tab displays only information for google-services application flows that have a local drop event.

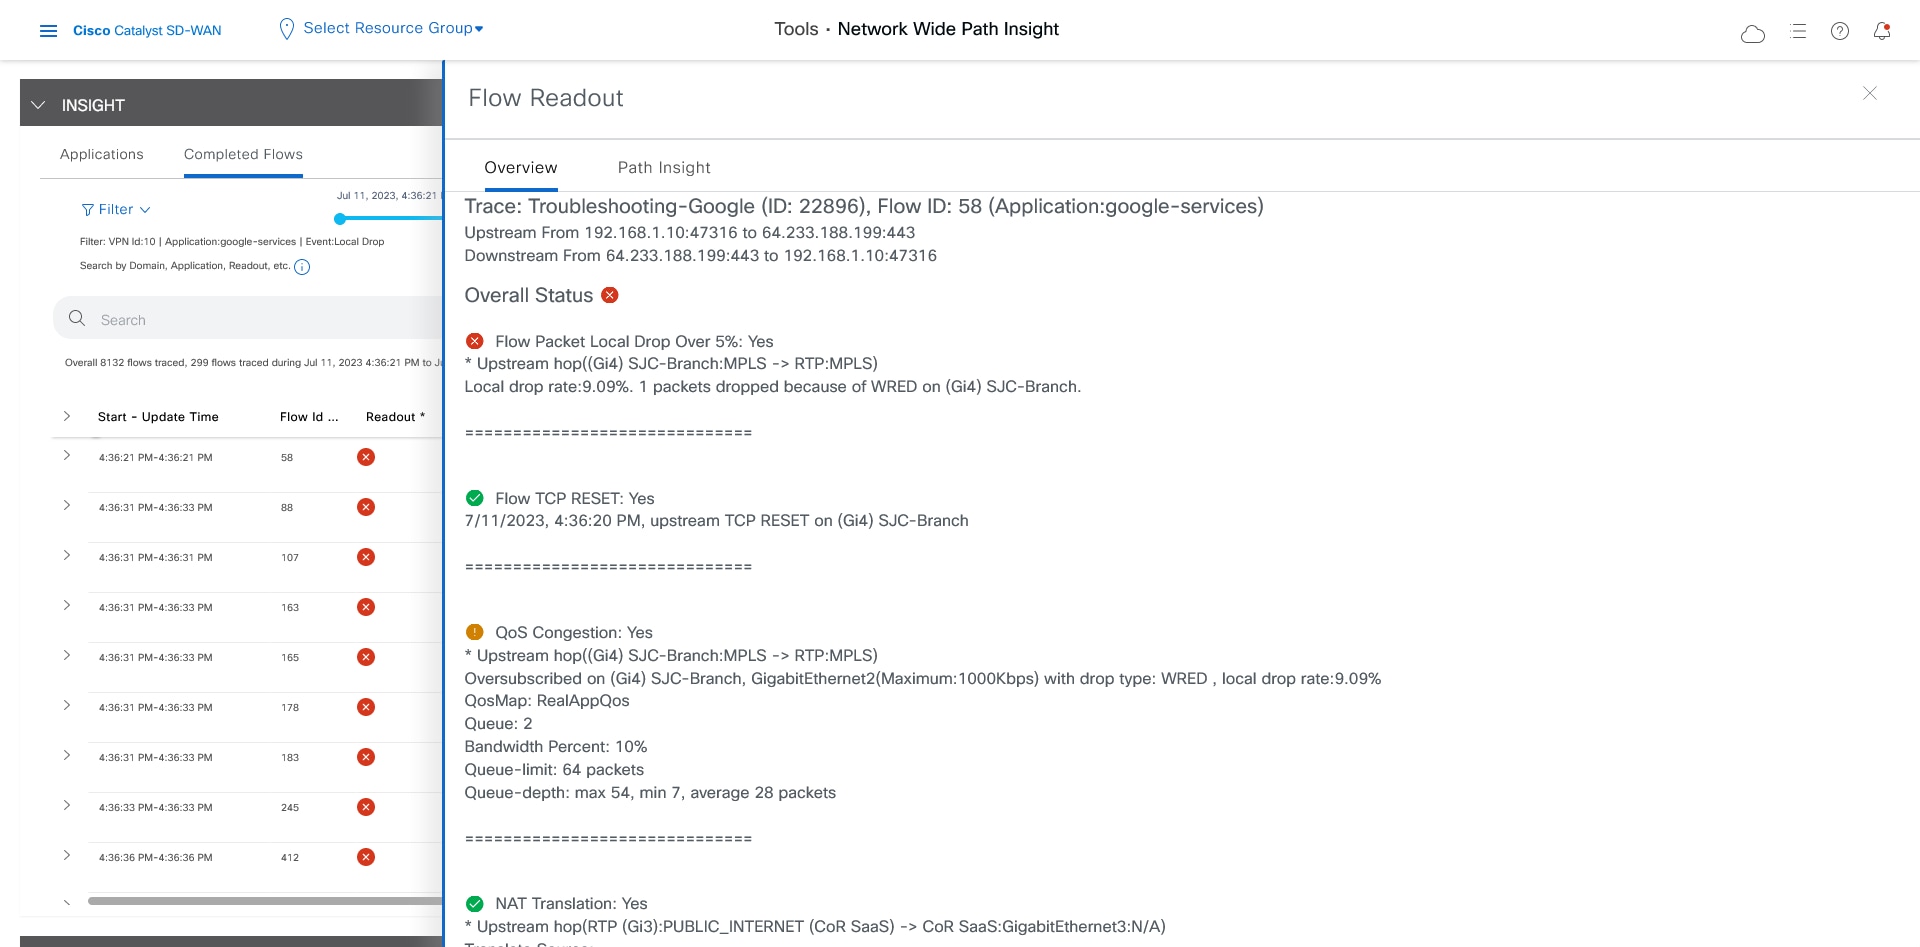
  3. To see additional information for a particular flow, click the red X in the Readout column for the flow to display the Flow Readout slide-in pane.

    The Overview tab on the Flow Readout slide-in pane shows that the flow is affected by a local drop event and provides related detailed information.

Figure 8. View Insight and Readout Information for Flows
Figure 9. Flow Insight Information
Figure 10. Flow Readout Information

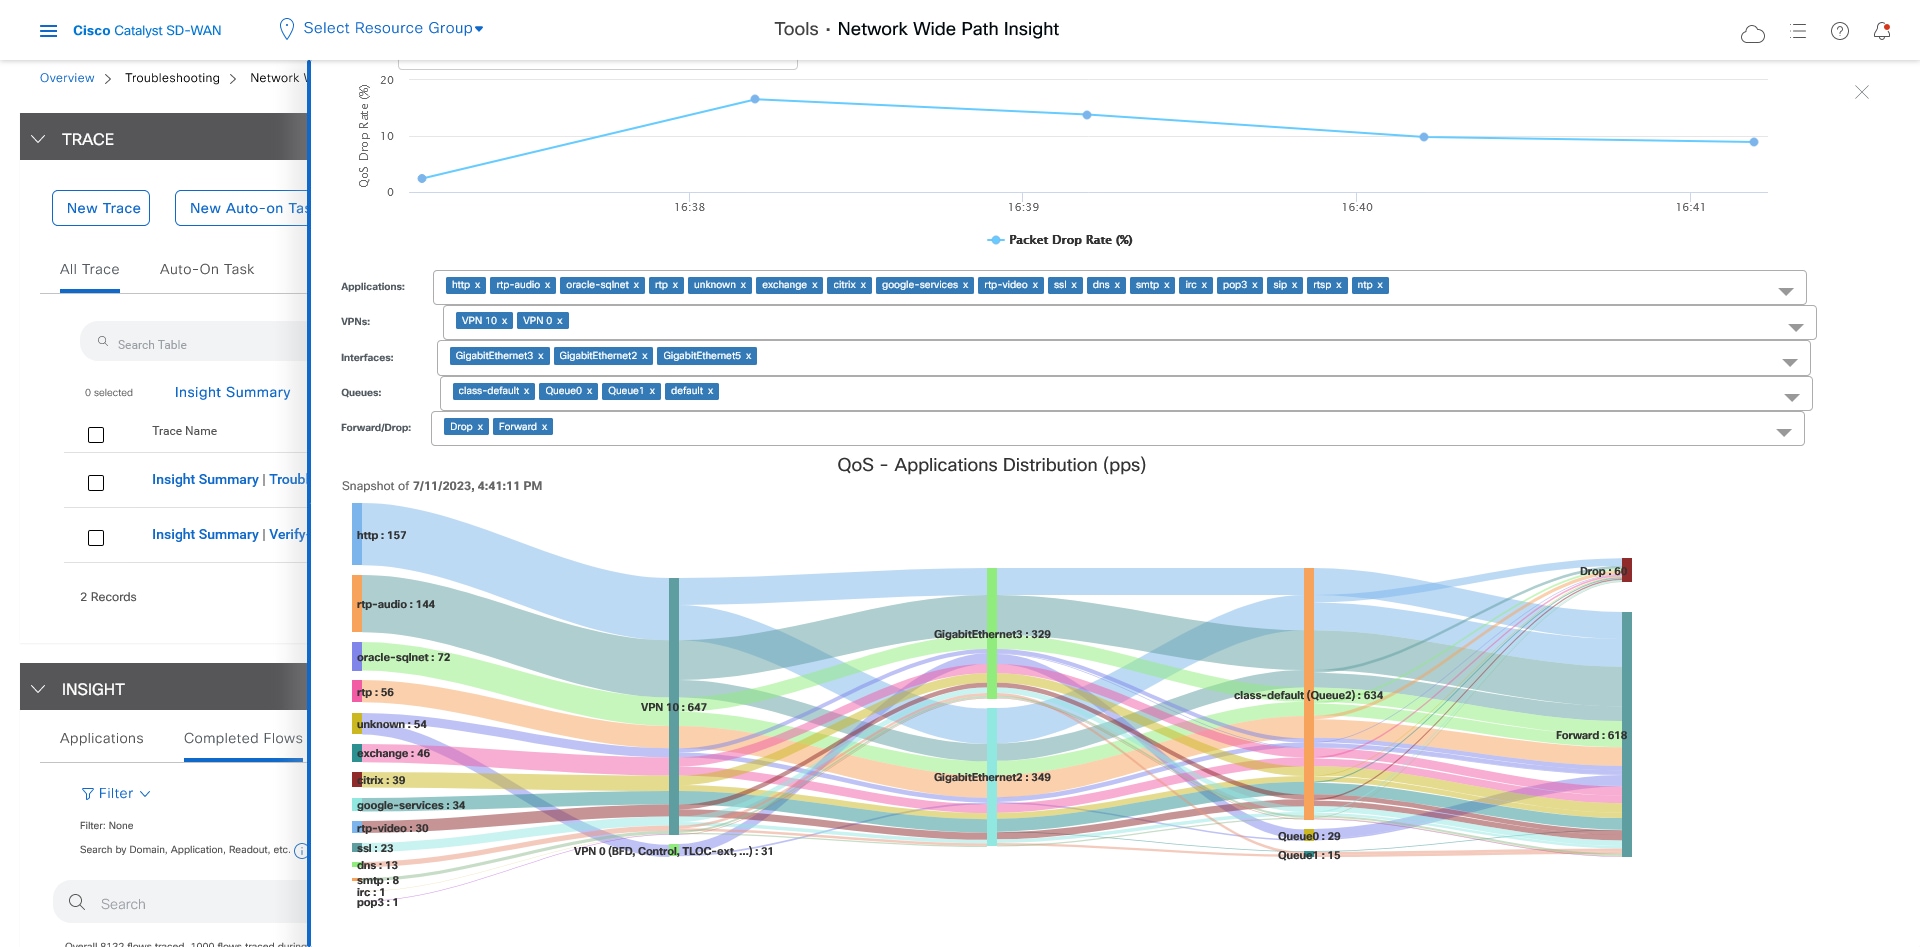
You’ve now determined that the issue is related to local drop events. These events occur due to packets that are dropped because of network congestion, and they affect the quality of traffic flows on your network. Next, you can use network-wide path insight to answer the following questions that relate to QoS:

  • Which queue is google-services traffic sent to?

  • What applications besides google-services are consuming the bandwidth on this queue?

With the answers to these questions, you can take steps to reduce the congestion on the queue.

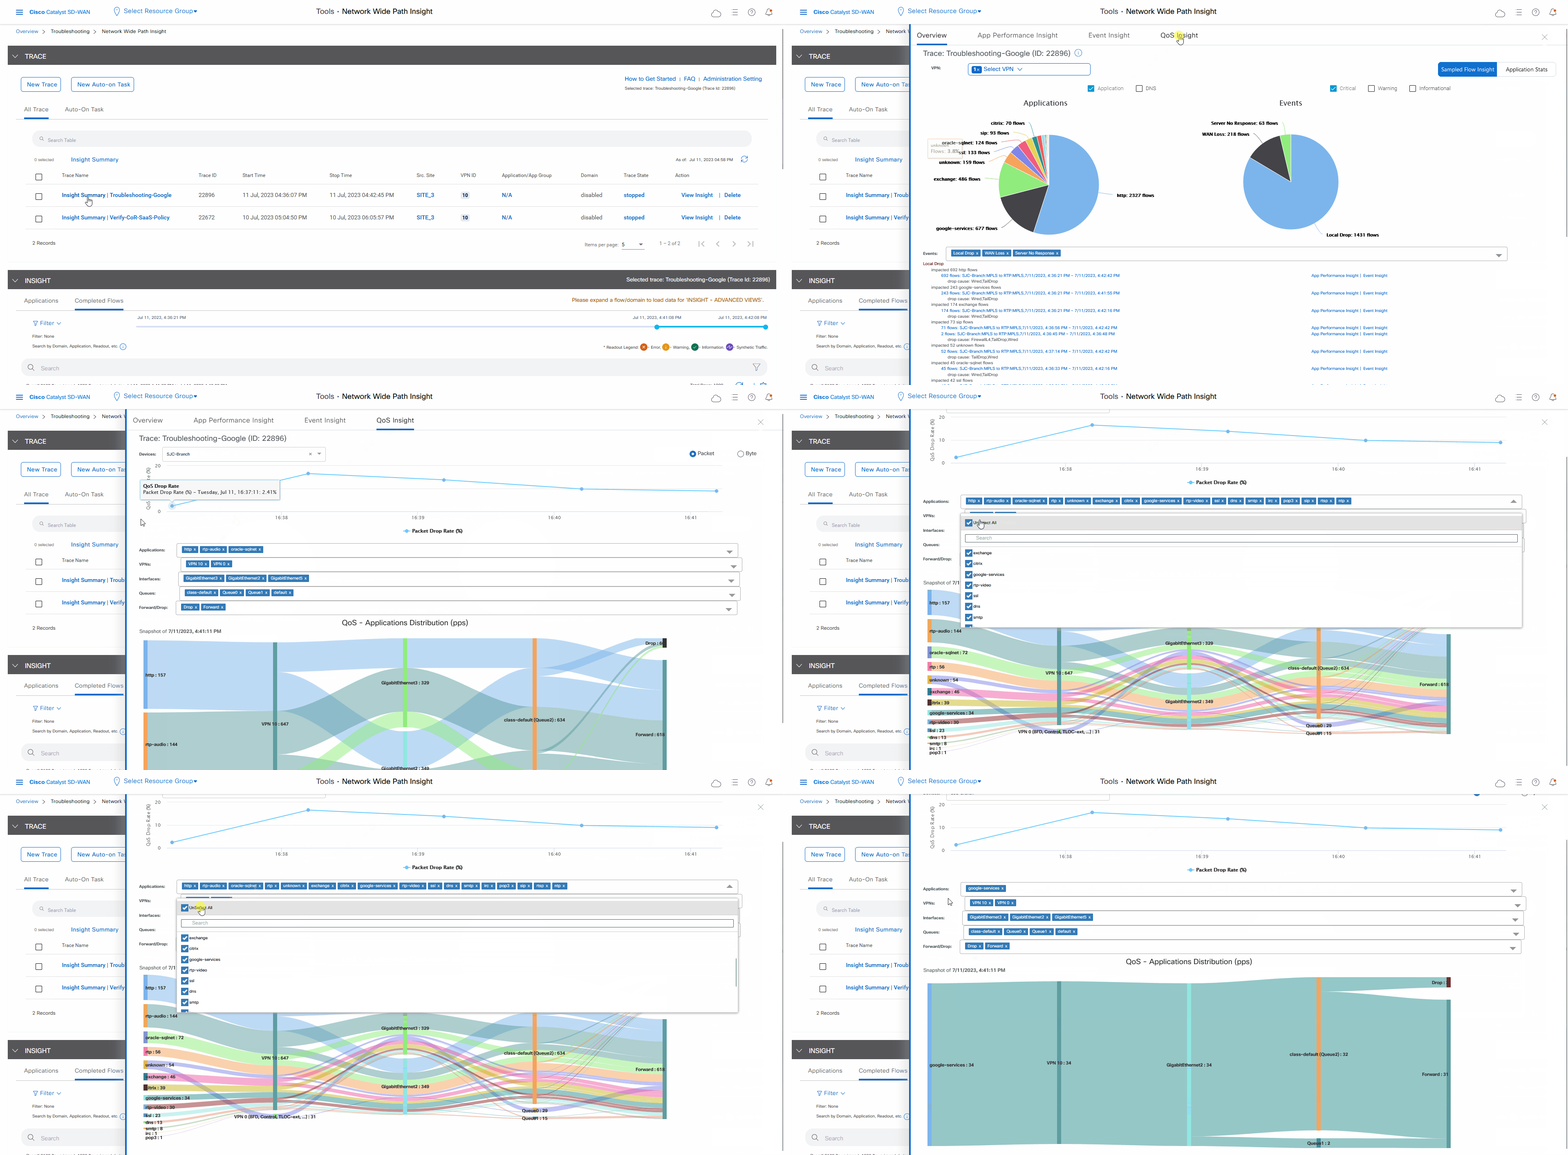
  1. In the list of traces in the All Trace tab, click Insight Summary in the row that shows the Troubleshooting-Google trace.

  2. In the Insight Summary slide-in pane, choose the QoS Insight tab.

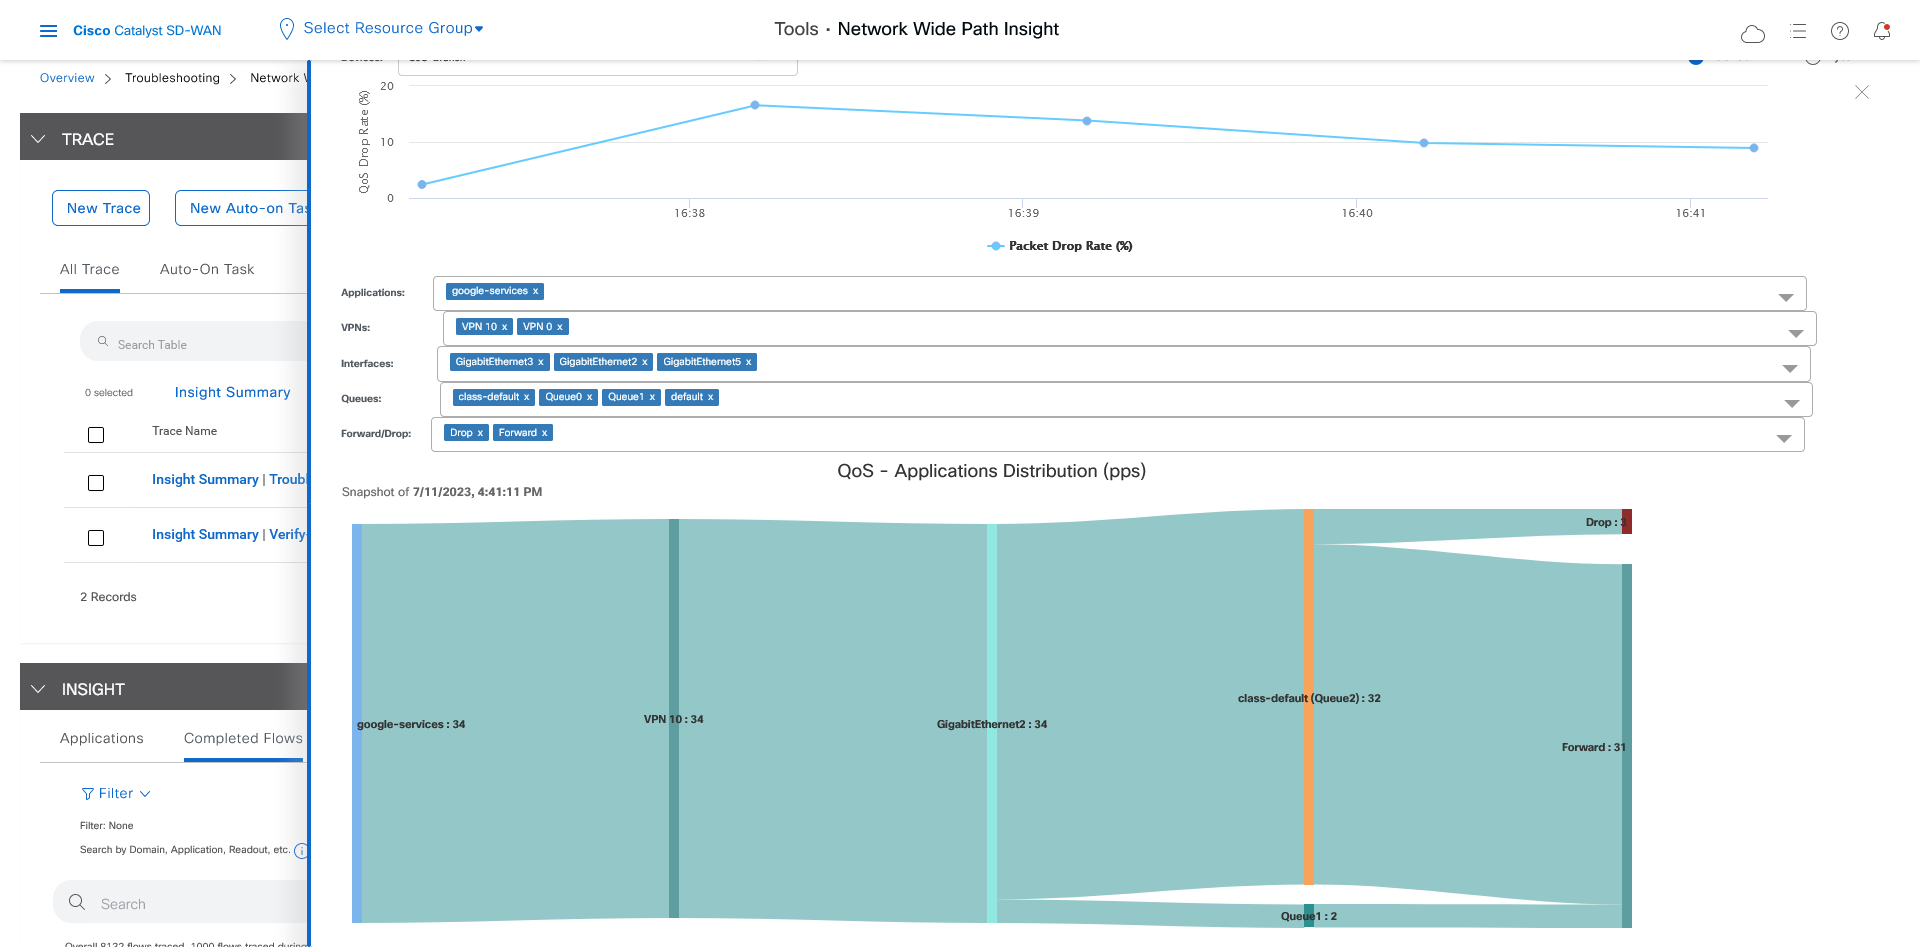
  3. In the Applications field, choose all applications to see which applications are consuming bandwidth on which queue, then choose the google-services application to see which queue is used by this application.

    You can see that Google applications use queue 2, but many other applications also use this queue. These applications using the same queue are causing congestion.

Using the information that you found, you can reduce congestion and address the issues that your users experience when they visit the Google website by performing any of the following actions:

  • Adjust the QoS policy for the queue,

  • Move the Google application to another queue

  • Move other applications to another queue

Figure 11. View QoS Information
Figure 12. QoS Information for All Applications
Figure 13. QoS Information for the google-services Application