Monitor

Geography

Use the Geography screen to view information about the Cisco SD-WAN devices and links in the overlay network. The Geography screen provides a map displaying the geographic location of the Cisco SD-WAN devices.

Note: The browser on which you are running vManage NMS must have Internet access. If you do not have Internet access, ensure that the browser has access to "*.openstreetmaps.org."

Set Map Filters

To select the devices and links you want to display on the map:

  1. Navigate to Monitor > Geography.

  2. Click the Filter button to display a pull-down menu.

  3. Select the device group from the pull-down menu which includes all configured device groups. By default, the group "All" is selected and displays all Cisco SD-WAN devices in the overlay network. The group "No Groups" includes the devices that are not part of a device group. If all devices are in a group, the "No Groups" group is not displayed.

  4. Select the Cisco SD-WAN devices to display on the map. By default, the map displays all device types including vEdge, vEdge-vBond, vSmart, and vManage.

  5. Select the state of control and data links. By default, the map displays all control and data connections.

  6. Close the Filter box by moving the cursor outside the box.

The map is dynamically updated to reflect your selections. Also, as you make the device group, device type, and link selections, the tabs next to the Filter button are updated.

View Device Information

To display basic information for a device, hover over the device icon. A hover box displays the system IP, hostname, site ID, device type, and device status.

To display detailed information for a device, double-click the device icon to open the View More Details hover box. Click Device Dashboard, Device DetailsSSH Terminal, or Links to get further details for the device.

View Link Information

By default, control and data connections are not displayed on the map. To see control and data connections for a device:

  1. Double-click the device icon to open a hover box with details about the device.

  2. Click Links.

Note the following:

  • An active control connection between two devices is displayed on the map as a thin blue line. Multiple active connections between devices are displayed by a bold blue line. A control connection that is down is displayed on the map as a dotted red line. Multiple control connections that are down are displayed by a bold dotted red line. If you hover over the line, a hover box tells you if the connection is up or down.

  • An active data connection between two devices is displayed on the map as a thin green line. Multiple active data connections are displayed by a bold green line. A data connection that is down is displayed on the map as a dotted red line. Multiple data connections that are down are displayed by a bold dotted red line. If you hover over the line, a hover box tells you if the connection is up or down.

  • An active consolidated control and data connection between two devices is displayed on the map as a thick grey line.

Configure Geographic Coordinates for a Device

To configure the geographic coordinates for a device, use the Configuration > Templates > System feature template.

If the Cisco SD-WAN device is not attached to a configuration template, you can configure the latitude and longitude directly on the device:

  1. Select the Tools > SSH Terminal screen.

  2. Select the device from the left pane. The SSH Terminal screen opens in the right pane.

  3. Enter the username and password to log in to the device.

  4. Determine whether the device is attached to a configuration template:
    Device# 
    show system status Check the values in the vManaged and Configuration template output fields. For example:
    ...
        Personality:            vedge
        Model name:             vedge-cloud
        Services:               None
        vManaged:               false
        Commit pending:         false
        Configuration template: None
    If the vManaged field is false, the device is not attached to a configuration template, and the Configuration template field says None. For such a device, you can configure the GPS coordinates directly from the CLI. If the vManaged field is true, the device's configuration has been downloaded by the vManage server, and the Configuration template field shows the name of the configuration template. For such a device, you cannot configure the GPS coordinates directly from the CLI. If you attempt to do so, the validate or commit command fails, with the following message:
    Aborted: 'system is-vmanaged': This device is being managed by the vManage. Configuration through the CLI is not allowed.
  5. Enter configuration mode:
    Device# configDevice(config)#
  6. Configure the latitude and longitude on the device:
    Device(config)# system gps-location latitude 
                                degrees.minutes.seconds
        Device(config-system)# gps-location longitude
                                degrees.minutes.seconds
                            
  7. Save the configuration:
    Device(config-system)# commit
        Device(config-system)#

Network

Use the Network screen to display a list of Cisco SD-WAN devices in the overlay network and to display detailed information about individual devices.

View List of Devices

The Network screen lists the Cisco SD-WAN devices in the overlay network. When you first come to the Network screen, the device group "All" is selected, and the screen shows status information for all Cisco SD-WAN devices in the overlay network.

To see a list of devices in a particular group, select that device group.

To filter the devices by reachability, hostname, system IP address, site ID, and device model, select from the sort options in the drop-down or type a string in the Search box.

To display information about an individual device, click its hostname.

Export Device Data in CSV Format

To export data for all devices to a file in CSV format, click the Download button. This button is located to the right of the filter criteria.

vManage NMS downloads all data from the device table to an Excel file in CSV format. The file is downloaded to your browser’s default download location and is named viptela_download.csv.

View Tunnel Latency Statistics

From the vManage NMS, you can display average packet latency information for application-aware routing using the Dashboard or the Monitor > Network screen.

To use the Dashboard screen:

  1. Select the Dashboard screen.

  2. Locate the Application-Aware Routing pane on the bottom right of the screen.

To use the Network screen:

  1. Select Monitor > Netork.

  2. Locate the device using the Sort options drop-down and the Search box. Or scroll through the list of devices in the device table.

  3. Select the device by clicking its system IP address.

  4. In the screen that opens, select WAN–Tunnel in the left pane.

CLI equivalent: show app-route statistics

View Client Details

To view details of clients connected to the WiFi access point, click the Clients Details button on the WiFi screen.

The upper part of the Clients Info right pane contains the following elements:

  • Clients Details title bar—Includes the Clients Usage tab.

  • Time periods—Click a predefined or custom time period for which to display data.

  • Information of clients connected to the WiFi access point in graphical format. Select a column to display information for just those clients in tabular format in the lower part of the screen.

The lower part of the Clients Info right pane contains the following elements:

  • Filter criteria.

  • Table of clients connected to the WiFi access point.

View Client Usage

To view data usage details of all clients connected to the WiFi access point, click the Clients Usage tab.

The upper part of the Clients Usage right pane contains the following elements:

  • Time periods—Click a predefined or custom time period for which to display data.

  • Data usage of all clients connected to the WiFi access point in graphical format.

  • Data usage information graph legend—Select a client MAC address to display information for just that client.

The lower part of the Clients Usage right pane contains the following elements:

  • Filter criteria.

  • Data usage information table. By default, the first six clients are selected.

View Events

To view the number of critical, major, or minor events on a device:

  1. From the Monitor > Network screen, select a device.

  2. Click Events in the left pane. The right pane displays information about all events on the device.

The upper part of the right pane contains the following elements:

  • Filter bar—Includes the Filter drop-down and time periods. Click the Filter icon to display a drop-down menu to add filters for searching events by severity, component, and event name. Click a predefined or custom time period for which to display data.

  • Events Histogram—Displays a graphical representation of all events. To hide the events histogram, click the Events Histogram title or the down angle bracket to the right of it.

The lower part of the right pane has the following elements:

  • Search box—Includes the Search Options drop-down, for a Contains or Match.

  • Events table.

    • To re-arrange the columns, drag the column title to the desired position.

    • To change the sort order in a column, click the Up or Down arrow in the column title.

View ACL Logs

To view logs for access lists (ACLs) configured on a vEdge router:

  1. From the Monitor > Network screen, select a vEdge router.

  2. Click ACL Logs in the left pane. The right pane displays information about all localized data policy (ACL) logs on the router. You configure these logs by including the log action in an ACL.

The upper part of the right pane contains the following elements:

  • Filter bar—Includes the Filter drop-down and time periods. Click the Filter icon to display a drop-down menu to add filters for searching logs by VPN. Click a predefined or custom time period for which to display data.

  • Search box—Includes the Search Options drop-down, for a Contains or Match.

The lower part of the right pane contains the following elements:

  • Logs table.

    • To re-arrange the columns, drag the column title to the desired position.

    • To change the sort order in a column, click the Up or Down arrow in the column title.

Troubleshoot a Device

You can troubleshoot connectivity or traffic health for all devices in the overlay network.

Check Device Connectivity

To troubleshoot connectivity for a device in the network, you can do the following:

  • Check device bringup

  • Ping the device

  • Run a speed test

  • Run a traceroute

  • View control connections in real time

Check Device Bringup

To verify the status of a device bringup (available on vEdge routers only):

  1. From the Monitor > Network screen, select the device.

  2. Click Troubleshooting in the left pane.

  3. From the Connectivity pane, click Device Bringup.

The Device Bringup screen opens and displays:

  • Troubleshooting drop-down—Located to the right of the Select Device drop-down. Click an option to view troubleshooting information. To close the drop-down, click the Troubleshooting button again.

  • Device bringup state—Indicated by one of the following states:

    • Green check mark—Indicates that the device has successfully established control-plane connections with the controller devices in the network and is up and running.

    • Gray check mark—Indicates that ZTP was disabled in the Administration > Settings screen when the device initially came up. You will see this state for the Software Image Update box only.

    • Red check mark—Indicates that the device failed to establish control-plane connections with the controller devices in the network and is not up and running.

    • Yellow exclamation point—Indicates that vManage NMS could not find the reason for a failure on the device.

Ping a Device

To verify that a device is reachable on the network, ping the device to send ICMP ECHO_REQUEST packets to it:

  1. From the Monitor > Network screen, select the device.

  2. Click Troubleshooting in the left pane.

  3. From the Connectivity pane, click Ping.

  4. In the Destination IP field, enter the IP address of the device to ping.

  5. In the VPN drop-down, select the VPN to use to reach the device.

  6. In the Source/Interface drop-down, select the interface to use to send the ping packets.

  7. In the Probes field, select the protocol type to use to send the ping packets.

  8. In the Source Port field, enter the number of the source port.

  9. In the Destination Port field, enter the number of the destination port.

  10. In the Type of Service field, enter the value for the type of service (ToS) field to include in the ping packets.

  11. In the Time to Live field, enter the round-trip time for sending this ping packet and receiving a response, in milliseconds.

  12. Click the Don't Fragment slider to set the Don't Fragment bit in the ping packets.

  13. Click Advanced Options to specify additional parameters:

    1. In the Count field, enter the number of ping requests to send. The range is 1 through 30. The default is 5.

    2. In the Payload Size field, enter the size of the packet to send. The default is 64 bytes, which comprises 56 bytes of data and 8 bytes of ICMP header. The range for data is 56 through 65507 bytes.

    3. Click the Rapid slider to send 5 ping requests in rapid succession and to display statistics only for packets transmitted and received, and the percentage of packets lost.

  14. Click Ping.

Run a Speed Test

To check the actual bandwidth of a circuit from one device to another:

  1. In the Administration > Settings screen, ensure that Data Stream is enabled.

  2. From the Monitor > Network screen, select the device.

  3. Click Troubleshooting in the left pane.

  4. From the Connectivity pane, click Speed Test.

  5. In the Source Circuit drop-down, select the color of tunnel interface on the local device.

  6. In the Destination Device drop-down, select the remote device by the device's name and system IP address.

  7. In the Destination Circuit drop-down, select the color of the tunnel interface on the remote device.

  8. Click Start Test. The speed test sends a single packet from the source to the destination and receives the acknowledgment from the destination.

The middle part of the right pane reports the results of the speed test. The clock reports the circuit's speed based on the round-trip time. The download speed shows the speed from the source to the destination, and the upload speed shows the speed from the destination to the source, both in Mbps. The configured downstream and upstream bandwidths for the circuit are also displayed.

When a speed test completes, the test results are added to the table at the lower part of the right pane.

Run a Traceroute

To display the path that packets take to reach a host or IP address on the network:

  1. From the Monitor > Network screen, select the device.

  2. Click Troubleshooting in the left pane.

  3. From the Connectivity pane, click Trace Route.

  4. In the Destination IP field, enter the IP address of a device on the network.

  5. In the VPN drop-down, select the VPN to use to reach the device.

  6. In the Source/Interface drop-down, select the interface to use to send traceroute probe packets.

  7. Click Advanced Options.

  8. In the Size field, enter the size of the traceroute probe packets, in bytes.

  9. Click Start to trigger a traceroute to the requested destination.

The lower part of the right pane displays:

  • Output—Raw output of the path the traceroute probe packets take to reach the destination.

  • Graphical depiction of the path the traceroute probe packets take to reach the destination.

Check Device Syslog Files

To display the contents of a device's syslog files:

  1. In the Administration > Settings screen, ensure that Data Stream is enabled.

  2. From the Monitor > Network screen, select the vEdge router.

  3. Click Troubleshooting in the left pane.

  4. From the Logs pane, click Debug Log.

  5. In the Log Files field, select the name of the log file. The lower part of the screen displays the log information.

View QoS Information

View QoS statistics to know which traffic classes experienced the greatest number of drops on which devices in your network.

Table 1. Feature History
Feature Name

Release Information

Description

QoS Monitoring in Cisco vManage

Cisco IOS XE Release Amsterdam 17.2.1r

This release extends the capability of viewing interface-wise QoS information through Cisco vManage to support Cisco IOS XE SD-WAN devices. Before this release, QoS information for Cisco IOS XE SD-WAN devices could only be monitored through device CLI.

Note that this feature was already available for Cisco vEdge devices.

Limitations for QoS Monitoring

  • This feature is not supported for sub-interfaces.

  • This feature is not supported if per-tunnel QoS is enabled.

View QoS Information Chart

A QoS chart shows the packet speed and the number of packets dropped for each queue for the selected interface.

  1. In Cisco vManage, navigate to Monitor > Network.

  2. Select a device from the list of devices that displays.

  3. Under the Application pane on the left, click QoS.

  4. The upper part of the right pane has the following options to choose from.

    • Interface NameFrom the drop-down menu, choose the interface for which you want to view QoS data.

    • Time Range: Choose to view the information for a specified time range—Real time, predefined time ranges (1h, 3h, 6h, and so on), or click Custom to define a time range.

      Real time QoS information can also be viewed in a tabular format. See the section View Real Time QoS Information Table.

  5. From the Chart drop-down menu, choose one of the following.

    • Post Policy Rate: This option displays the speed at which data travels per second in either kbps (default) or in packets per second (PPS). This value is calculated to get the per second speed by using the formula: Post Policy Counter/10.

    OR

    • Post Policy Counter: This option displays the number of packets (or the number of packets in bytes) that have gone through the queue in the last 10 seconds.

    The QoS chart displays. The following example shows QoS data for a specified, historical time range for the selected interface. In this chart, each data point represents 10 minutes. For longer time ranges, Cisco vManage aggregates data points.

    Figure 1. QoS Chart

    Cisco vManage also displays a table below the chart. However, the table always displays historical data even if you choose the Real Time option to generate a chart. Such historical tables generated below real time charts have no connection with the real time values in the chart.

    The following example shows a table showing historical data that was generated below the real time QoS chart.

    Figure 2. Historical QoS Table

View Real Time QoS Information Table

To view real time QoS information in a tabular format, follow these steps:

  1. In Cisco vManage, navigate to Monitor > Network and select a device from the list displayed.

  2. In the left pane, click Real Time.

  3. From the Device Options drop-down, select Interface QoS Statistics.

    A table of QoS statistics displays. You can filter the table by interface name by selecting an interface from the Filter drop-down.

Check Traffic Health

To check traffic health for a vEdge router in the network:

  • View tunnel health

  • View traffic path information

  • Packet capture

  • Simulate flows

View Tunnel Health

To view the health of a tunnel from both directions (available on vEdge routers only):

  1. From the Monitor > Network screen, select the device.

  2. Click Troubleshooting in the left pane.

  3. From the Traffic pane, click Tunnel Health.

  4. From the Local TLOC drop-down, select a source TLOC.

  5. From the Remote Device drop-down, select a remote device.

  6. From the Remote TLOC drop-down, select a destination TLOC.

  7. Click Go. The lower part of the screen displays:

  • Chart Options bar—Located directly under the device name, this bar includes the Chart Options drop-down and time periods. Click Chart Options to select the type of data to display. Click a predefined or custom time period for which to display data.

  • App-route data (either loss, latency, or jitter) in graphical format for all tunnels between the two devices in each direction.

  • App-route graph legend—Identifies selected tunnels from both directions.

Select a TLOC to display information for just that TLOC.

Check Application-Aware Routing Traffic

To check application-aware routing traffic from the source device to the destination device (available on vEdge routers only):

  1. From the Monitor > Network screen, select the device.

  2. Click Troubleshooting in the left pane.

  3. From the Traffic pane, click App Route Visualization.

  4. From the Remote Device drop-down, select a destination device.

  5. Click Go. The lower part of the screen displays:

  • Chart Options bar—Located directly under the device name, this bar includes the Chart Options drop-down and time periods. Click Chart Options to select the type of data to display. Click a predefined or custom time period for which to display data.

  • Application-aware routing data (either loss, latency, or jitter), along with octets, in graphical format for all tunnels between the two devices.

  • Application-aware routing graph legend—Identifies source and destination TLOC.

Capture Packets

To capture control plane and data plane packets in real time, similar to a UNIX tcpdump operation, and to save these packets to a file (available on vEdge routers only):


Note

For Cisco vManage cluster environments, to enable you to run speed test and capture packets on all devices in the cluster irrespective of the vManage node that the devices are connected to, we recommend configuring data stream with the following:

  • Management IP address and VPN 512

OR

  • Transport IP address and VPN 0

Data stream configuration with the system IP address of a vManage node and VPN 0 is not recommended in cluster environments because it limits speed test and packet capture only to devices that are connected to the vManage node that is configured in the data stream.


  1. From the Monitor > Network screen, select the device.

  2. Click Troubleshooting in the left pane.

  3. From the Traffic pane, click App Packet Capture.

  4. From the VPN drop-down, select the VPN in which to capture packets.

  5. From the Interface drop-down, select the interface over which to capture packets.

  6. Optionally, click Traffic Filter to filter the packets to capture based on values in their IP headers. Enter values for one or more of these fields:

    1. In Source IP, enter the packets' source IP address.

    2. In Source Port, enter the packets' source port number.

    3. In Protocol, enter the packets' protocol number

    4. In Destination IP, enter the packets' destination IP address.

    5. In Destination Port, enter the packets' destination port number.

  7. Click Start. The packet capture begins, and displays its progress:

    1. Packet Capture in Progress—Packet capture stops after 5 minutes, after the file of collected packets reaches 5 MB, or when you click the Stop button.

    2. Preparing file to download—vManage NMS creates a file in libpcap format (a .pcap file).

    3. File ready, click to download the file—Click the download icon to download the generated file.

Simulate Flows

Table 2. Feature History

Feature Name

Release Information

Description

Forwarding Serviceability

Cisco IOS XE Release Amsterdam 17.2.1r

This feature enables service path and tunnel path under Simulate Flows function in the vManage template and displays the next-hop information for an IP packet. This feature enables Speed Test and Simulate Flow functions on the Cisco IOS XE SD-WAN devices.

To display the next-hop information for an IP packet available on routers:

  1. From the Monitor > Network screen, select the router.

  2. Click Troubleshooting in the left pane.

  3. From the Traffic pane, click Simulate Flows.

  4. To specify the data traffic path, select values or enter data in the required fields (marked with an asterisk [*]) and optional fields. The required fields are:

    • VPN—VPN in which the data tunnel is located.

    • Source Interface—Interface from which the cflowd flow originates.

    • Source IP—IP address from which the cflowd flow originates.

    • Destination IP—Destination IP address of the cflowd flow.

    • Protocol (under Advanced Options)—Number of the protocol being used to transmit the cflowd flow.

    The optional fields are:

    • Application—Application running on the router.

    • Source Port (under Advanced Options)—Port from which the cflowd flow originates.

    • Destination Port (under Advanced Options)—Destination port of the cflowd flow.

    • DSCP (under Advanced Options)—DSCP value in the cflowd packets.

  5. Click Advanced Options:

    1. In the Path toggle field, select whether the data traffic path information comes from the service side of the router or from the tunnel side.

    2. Select values or enter data in the required fields (marked with an asterisk [*]) and optional fields. The required field is Protocol—Number of the protocol being used to transmit the cflowd flow. The optional fields are:

      • Source Port—Port from which the cflowd flow originates.

      • Destination Port—Destination port of the cflowd flow.

      • DSCP—DSCP value in the cflowd packets.

    3. Check the All Paths check box to display all possible paths for a packet.

  6. Click Simulate to determine the next hop that a packet with the specified headers would take.

For service path and tunnel path commands, see show sdwan policy service-path and show sdwan policy tunnel-path.

Identify the Recommended Security Virtual Image Version

At times, you may want to check the recommended Security Virtual Image (SVI) release number for a given router. To check this using vManage:

Procedure


Step 1

From the vManage dashboard, select Monitor > Network.

Step 2

Choose WAN – Edge.

Step 3

Select the device that will run the SVI.

The System Status page displays.

Step 4

Scroll to the bottom of the device menu, and click Real Time.

The System Information page displays.

Step 5

Click the Device Options field, and select Security App Version Status from the menu list.

Step 6

Note the image name in the Recommended Version column. It should match the available SVI for your router from the Cisco downloads website.


Monitor URL Filtering

You can monitor the URL Filtering for a device by web categories using the following steps.

To monitor the URLs that are blocked or allowed on an IOS XE SD-WAN device:

  1. From the Monitor > Network screen, select a device.

  2. In the left panel, under Security Monitoring, select the URL Filtering tab. The URL Filtering wizard displays.

  3. Click on the Blocked tab, the session count on a blocked URL appears as shown in the following screenshot.

  4. Click on the Allowed tab, the session count on allowed URLs appear as shown in the following screenshot.

Monitor Advanced Malware Protection

You can monitor Advanced Malware Protection from the Device Dashboard by using the following steps.

Procedure


Step 1

From the Monitor > Network screen, select a device.

Step 2

In the left panel, under Security Monitoring, select the Advanced Malware Protection tab.

This tab shows the following:

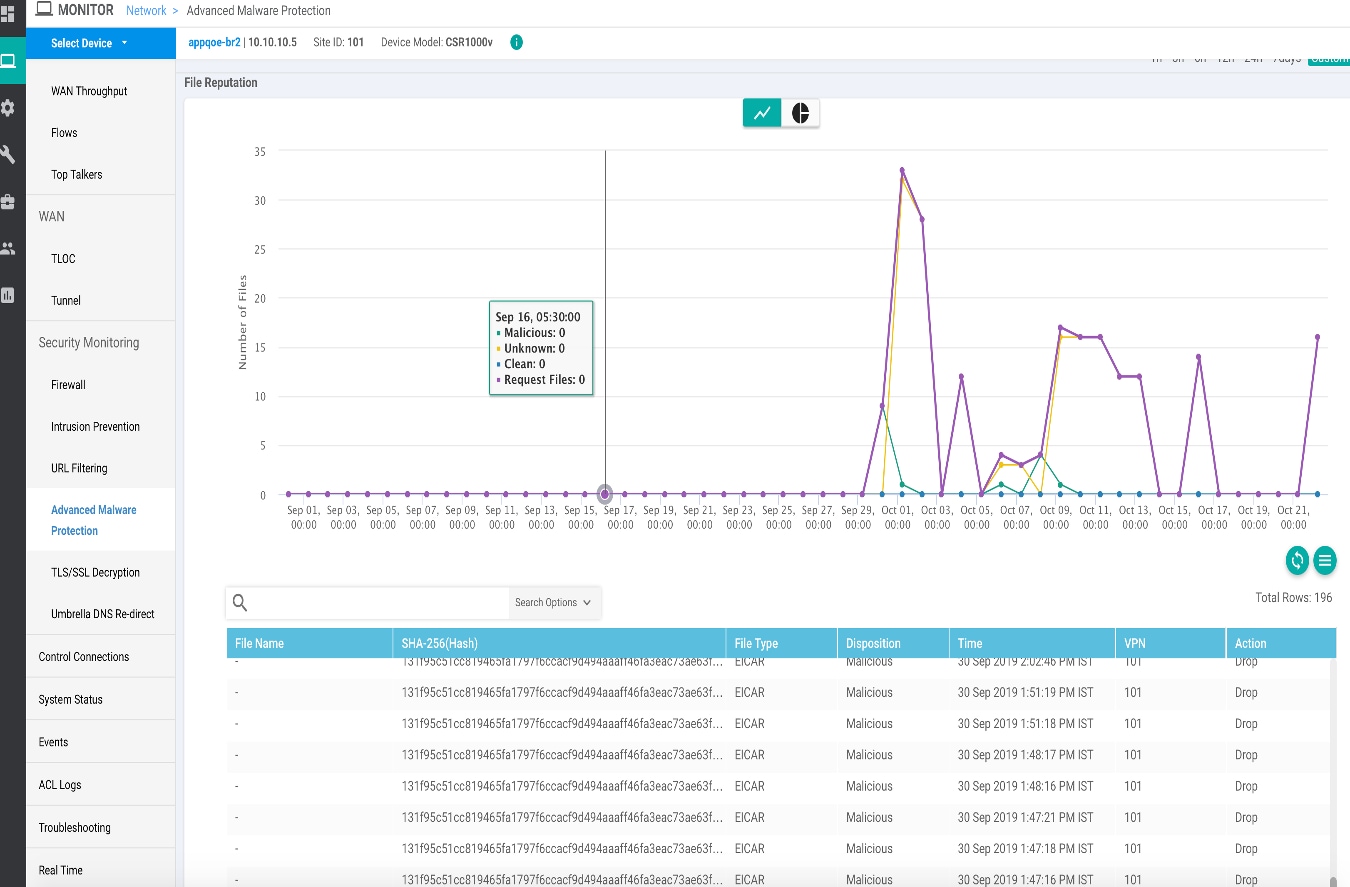
  • File Reputation – The graph or pie chart shows the total number of files transferred and how many are malicious, clean, or unknown. This tab area also includes a table with detailed information about each file that was inspected.

  • File Retrospection – A table with detailed information about file retrospection events.

  • File Analysis – A graph that shows the number of files that were uploaded to Threat Grid, and a table with detailed information about each file that was uploaded for analysis.


Monitor Intrusion Prevention Policy

You can monitor the Intrusion Prevention System (IPS) signature violations by severity and by count using the following steps.

To monitor the Signatures of IPS Configuration on IOS XE SD-WAN device:

  1. From the Monitor > Network screen, select a device.

  2. In the left panel, under Security Monitoring, select Intrusion Prevention tab. The Intrusion Prevention wizard displays.

  3. Click By Severity or By Count to designate how you want to display intrusion prevention information.

Monitor TLS Proxy

  1. Cisco vManage, navigate to Monitor > Network.

  2. Select a device from the list of devices that displays.

  3. Under the Application pane on the left, click SSL Proxy.

  4. The upper part of the right pane has the following options to choose from.

    • Traffic View: From the drop-down menu, choose one of the following–All Policy Actions, Encrypted, Un-encrypted, Decrypted.

    • Filter: You have the option to filter the traffic statistics by VPN, TLOC, Remote TLOC, and Remote System IP.

    • SSL Proxy View Format: You can choose to view the SSL proxy information in form of a line graph, bar chart, or a pie chart.

    • Time Range: Choose to view the information for a specified time range (1h, 3h, 6h, and so on) or click Custom to define a time range.

  5. Based on your selection, the information displays. For representation, we have only shown the information in form of a bar chart.

    This example shows the data that the selected device encrypted and decrypted in the last 12 hours.

    Figure 3. SSL Proxy Information in a Bar Chart

    Additionally, on the SSL Proxy Monitoring page, the information is also displayed in tabular format below the bar chart.

    Figure 4. SSL Proxy Information in a Table

Monitor SSL Decryption Statistics

  1. Cisco vManage, navigate to Monitor > Network.

  2. Select a device from the list of devices that displays.

  3. Under the Security Monitoring pane on the left, click TLS/SSL Decryption.

  4. The upper part of the right pane has the following options to choose from.

    • Network Policy: You can view the traffic information for an applied network policy.

    • URL Policy: You can view the traffic information of a URL policy.

    • Time Range: Choose to view the information for a specified time range (1h, 3h, 6h, and so on) or click Custom to define a time range.

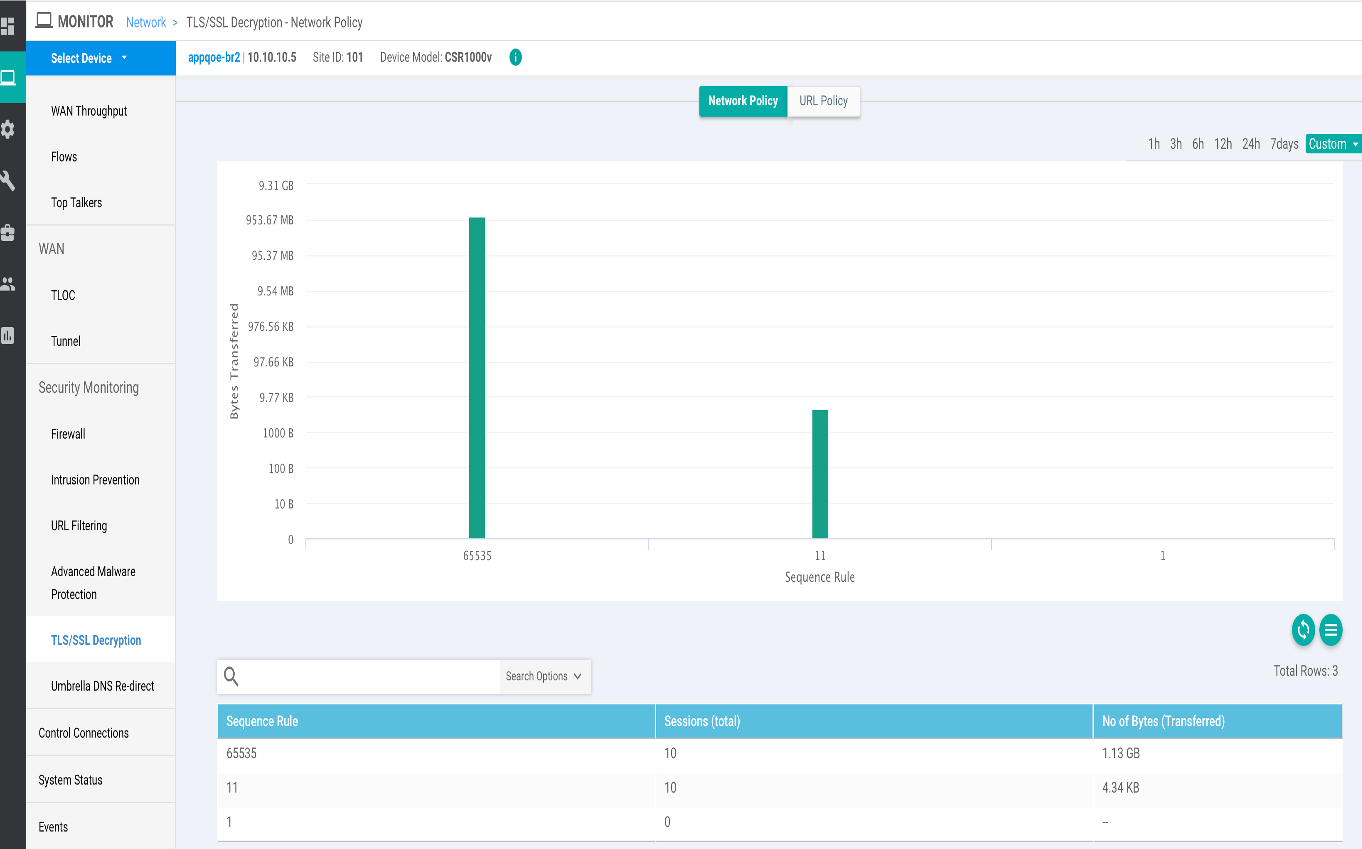
  5. Based on your selection, the information displays. For example, the network policy displays as in the following screenshot. This example shows the number of bytes that were transferred for the sequence rules 65535, 11, and 1

    Figure 5. TLS/SSL Decryption

    Additionally, from the Security Monitoring pane, you can also view information for other Security features such as Firewall, Intrusion Prevention, URL Filtering, and so on. For example, the following image displays the Advanced Malware Protection page in the graph format:

    Figure 6. Advanced Malware Protection

Monitoring Umbrella Feature

You can monitor the registered VPNs, DNSCrypt status, packet counts for required timestamps on a umbrella configured router using the following steps.

To monitor the status of Umbrella DNS Configuration on IOS XE device:

  1. From the Monitor > Network screen, select an IOS XE device.

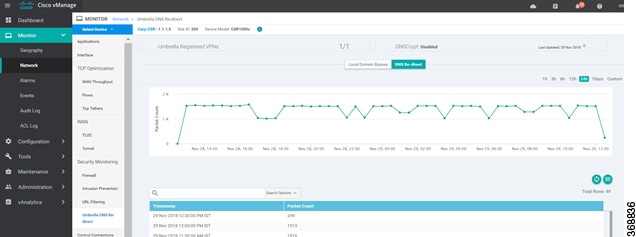
  2. In the left panel, under Security Monitoring, select Umbrella DNS Re-direct tab. The Umbrella DNS Re-direct wizard displays showing how many packets are redirected to configured DNS server.

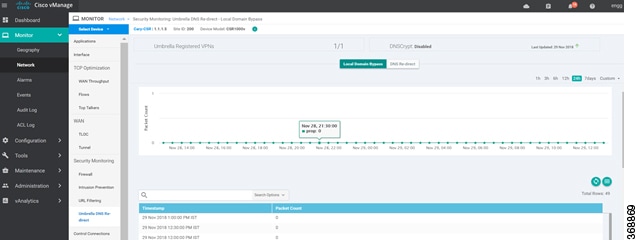
  3. Click on Local Domain Bypass to monitor the packet counts showing how many packets are bypassed to DNS server.

Monitor Forward Error Correction Tunnel Information

Procedure


Step 1

Select Monitor > Network.

Step 2

Select a device group.

Step 3

In the left panel, click Tunnel, which displays under WAN

The WAN tunnel information includes the following:

  • A graph that shows the total tunnel loss for the selected tunnels.

  • A graph that shows the FEC loss recovery rate for the selected tunnels. The system calculates this rate by dividing the total number of reconstructed packets by the total number of lost packets on FEC:

  • A table that provides the following information for each tunnel endpoint:

    • Name of the tunnel endpoint

    • Communications protocol that the endpoint uses

    • State of the endpoint

    • Jitter, in ms, on the endpoint

    • Packet loss percentage for the endpoint

    • FEC loss recovery percentage for the endpoint

    • Latency, in ms, on the endpoint

    • Total bytes transmitted from the endpoint

    • Total bytes received by the endpoint

    • Application usage link


Monitor Forward Error Application Family Information

Procedure


Step 1

Select Monitor > Network.

Step 2

Select a device group.

Step 3

In the left panel, click DPI, which displays under WAN.

The FEC application information includes the following:

  • A graph for which you can select any of the following perspectives:

    • Application Usage—Usage of various types of traffic for the selected application families, in KB.

    • Application Goodput—Goodput metadata for the selected application families.

    • Mean Opinion Score (MOS)—MOS for the selected application families.

    • FEC Recovery Rate— FEC loss recovery rate for the selected application families. The system calculates this rate by dividing the total number of reconstructed packets by the total number of lost FEC-enabled packets.

  • A table that provides the following for each application family:

    • Name of the application family.

    • Goodput, in kbps, for the application family.

    • MOS for the selected application family.

    • FEC loss recovery percentage for the application family.

    • Traffic usage, in MB, for the selected application family.


View Cisco Colo Manager Health

You can view Cisco Colo Manager health for a device, Cisco Colo Manager host system IP, Cisco Colo Manager IP, and Cisco Colo Manager state. Reviewing this information can help you to determine which VNF to use when you are designing a network service. To view information about VNFs, perform the following steps:

Procedure


Step 1

In vManage, click Monitor > Network.

The right pane displays VNF information in a tabular format. The table includes information such as CPU use, memory consumption, and disk, and other core parameters that define performance of a network service.

Step 2

Click a CSP device from the table.

Step 3

From the left pane, click Colo Manager.

The right pane displays information about the memory usage, CPU usage, uptime, and so on, of the colo manager.


Monitor Cloud OnRamp Colocation Clusters

You can view the cluster information and their health states. Reviewing this information can help you to determine which CSP device is responsible for hosting each VNF in a service chain. To view information about a cluster, perform the following steps:

Procedure


Step 1

In vManage, click Monitor > Network.

Step 2

To monitor clusters, click the Colocation Clusters tab.

All clusters with its relevant information are displayed in tabular format. Click a cluster name.

In the primary part of the left pane, you can view the PNF devices in a service group that are attached to a cluster along with the switches. In the right pane, you can view the cluster information such as the available and total CPU resources, available and allocated memory, and so on, based on Cloud OnRamp for Colocation size.

The detail part of the left pane contains:

  • Filter criteria: Select the fields to be displayed from the search options drop-down.

  • A table that lists information about all devices in the cluster (CSP devices, PNFs, and switches).

    Click a CSP cluster. VNF information is displayed in tabular format. The table includes information such as VNF name, service chains, CPU use, memory consumption, disk, management IP, and other core parameters that define performance of network service. See View Information About VNFs.

Step 3

Click the Services tab.

In this tab, you can view:

  • The monitoring information of a service chain can be viewed in tabular format. The first two columns display the name and description of the service chain within the service group and the remaining columns mention about the VNF, PNF statuses, monitoring service enablemement, and the overall health of a service chain. The various health statuses and their representations are:

    • Healthy—Up arrow in green. A service chain is in 'Healthy' status when all the VNF, PNF devices are running and are in healthy state. Ensure that you configure the routing and policy correctly.

    • Unhealthy—Down arrow in red. If one of the VNFs or PNFs are in unhealthy state, the service chain is reported to be in 'Unhealthy' status. For example, after deploying a service chain, if one of the network function IP address changes on the WAN or LAN side, or the firewall policy is not configured to let the traffic pass through, then unnhealthy state is reported. This is because the network function or overall service chain is Unhealthy or both are in Unhealthy state.

    • Undetermined—Down arrow in yellow. This is a third state that is reported when the health of the service chain cannot be determined. This state is also reported when there is no status such as healthy or unhealthy available for the monitored service chain over a time period. You cannot query or search a service chain with undetermined status.

      If a service chain consists of a single PNF and PNF is orchestrated outside of vManage, then it cannot be monitored. If a service chain consists of a single network function, firewall that has VPN termination on both sides which cannot be monitored, then it is reported as Undetermined.

      Note 

      If the status of a service chain is undetermined, you cannot choose the service chain to view the detailed monitoring information.

    Figure 7. Service Chain Health Monitoring Results
  • Click a service group that is in Healthy or Unhealthy state. The primary part of the service chain monitoring in the right pane contains the following elements:

    Figure 8. Service Chain Health Monitoring Status

    Graphical display that plots the latency information of the service chain, VNFs, PNFs.

    The detail part of the right pane contains:

    • Filter criteria

    • A table that lists information about all service chains, VNFs, PNFs, their health status, and types.

      • Check the checkbox at the left of a row to select and deselect a service chain, VNF, PNF.

      • To change the sort order of a column, click the column title.

    In the following image, the status details column indicate the monitored data path and it provides the per hop analysis.

  • Click the Diagram button and view the service group with all its service chains and VNFs in the design view window.

  • Click a VNF. You can view CPU, memory, and disk allocated to the VNF in a dialog box.

  • Select a service group from the Service Groups drop-down. The design view displays the selected service group with all its service chains and VNFs.

Step 4

Click the Network Functions tab.

In this tab, you can view:

  • All the virtual or physical network functions in tabular format. From the Show button, you can choose to display either a VNF or PNF.

    VNF information is displayed in tabular format. The table includes information such as VNF name, service chains, CPU use, memory consumption, disk, management IP, Share NF column, and other core parameters that define performance of network service. Click a VNF to view more information about the VNF. See View Information About VNFs.

  • PNF information is displayed in tabular format. The table includes information such as the serial number and PNF type. To view and note configuration of a specific PNF, click the desired PNF serial number. Ensure that you manually note all the configuration of the PNFs and then configure the PNF devices. For example, the following are some of the PNF configuration where you position the PNF at various locations in the service chain. See Custom Service Chain with Shared PNF Devices to create services chains by adding PNFs. Also, see the ASR 1000 Series Aggregation Services Routers Configuration Guides and Cisco Firepower Threat Defense Configuration Guides to configure the PNFs manually.

    Figure 9. PNF in the First Position with Service Chain Side Parameters
    Figure 10. PNF in the First Position with Outside Neighbor Information
    Figure 11. PNF Shared Across Two Service Chains

    The ServiceGroup2_chain3 is a PNF-only service chain and therefore no configuration gets generated. The PNF is in the last position of the ServiceGroup2_chain1, so only INSIDE variables gets generated.

    Figure 12. PNF Shared Across Two Service Chains with Outside Neighbor Information

View Information About VNFs

Table 3. Feature History

Feature Name

Release Information

Description

VNF States and Color Codes

Cisco IOS XE Release Amsterdam 17.2.1r

Cisco SD-WAN Release 20.1.1

This feature allows you to determine the state of a deployed VM using color codes, which you can view on the Monitor > Network page. These color codes help you make decisions on creating service chains based on the state of the VM.

Table 4. Feature History

Feature Name

Release Information

Description

Network Utilization Charts for SR-IOV Enabled NICs and OVS Switch

Cisco IOS XE Release Amsterdam 17.2.1r

Cisco SD-WAN Release 20.1.1

This feature allows you to view network utilization charts of VM VNICs connected to both SR-IOV enabled NICs and OVS switch. These charts help you determine if the VM utilization is optimal to create service chains.

You can view performance specifications and required resources for each VNF. Reviewing this information can help you to determine which VNF to use when you are designing a network service. To view information about VNFs, perform the following steps:

Procedure


Step 1

In Cisco vManage, click Monitor > Network.

The right pane displays VNF information in a tabular format. The table includes information such as CPU use, memory consumption, and disk, and other core parameters that define performance of a network service.

Step 2

Click a CSP device from the table.

Step 3

From the left pane, click VNF Status.

Step 4

From the table, click the VNF name. The right pane displays information about the specific VNF. You can click the network utilization, CPU utilization, memory utilization, and disk utilization to monitor the resources utilization of a VNF.

The primary part of the right pane contains the following VNF information:

Table 5. VNF Information

Chart options bar

VNF information in graphical format

VNF information in color coded format

  • Chart Options drop-down—Click Chart Options drop-down list to select the type of data to display.

  • Time periods—Click either a predefined time period, or a custom time period for which to display data.

Choose a VNF from the Select Device drop-down list to display information for the VNF.

The VNFs are shown in specific colors based on the following operational status of the VNF life cycle:

  • Green—VNF is healthy, deployed, and successfully booted up.

  • Red—VNF deployment or any other operation fails, or VNF stops.

  • Yellow—VNF is transitioning from one state to another.

The detail part of the right pane contains:

  • Filter criteria

  • VNF table that lists information about all VNFs or VMs. By default, the first six VNFs are checked. The network utilization charts for VNICs connected to SR-IOV enabled NICs and OVS switch are displayed.
    Figure 13. VNF Information

    The graphical display plots information for the checked VNFs

    • Click the checkbox at the left to select and deselect VNFs. You can select and display information for a maximum of six VNFs at one time.

    • To change the sort order of a column, click the column title.


Alarms

When something of interest happens on an individual device in the overlay network, the device reports it by sending a notification to Cisco vManage. Cisco vManage then filters the event notifications and correlates related events, and it consolidates major and critical events into alarms.

Use the Alarms screen to display detailed information about alarms generated by controllers and routers in the overlay network.

Alarm States

Cisco vManage alarms are assigned a state based on their severity:

  • Critical (red)—Serious events that impair or shut down the operation of an overlay network function.

  • Major (yellow)—Serious events that affect, but do not shut down, the operational of a network function.

  • Medium (blue)—Events that might impair the performance of a network function.

  • Minor (green)—Events that might diminish the performance of a network function.

The alarms listed as Active generally have a severity of either critical or major.

When the notification events that the Cisco vManage receives indicate that the alarm condition has passed, most alarms clear themselves automatically. Cisco vManage then lists the alarm as Cleared, and the alarm state generally changes to medium or minor.

View Alarms

You can view alarms from the Cisco vManage Dashboard by clicking the Alarm Bell icon in the top bar. In the Alarm Bell, the alarms are grouped into Active or Cleared.

Alternatively, follow these steps to view alarms from the Alarms screen in Cisco vManage.

  1. In Cisco vManage, navigate to Monitor > Alarms.The alarms are displayed in graphical and tabular formats.

    The Alarm Details popup window opens, displaying the possible cause of the alarm, impacted entities, and other details.

  2. To view details about an alarm, select the alarm from the alarms table.

  3. Click the More Actions icon to the right of the row, and click Alarm Details.

The Alarm Details pop-up window opens, displaying the possible cause of the alarm, impacted entities, and other details.

Set Alarm Filters

To set filters for searching alarms generated by one or more Cisco SD-WAN devices:

  1. Navigate to Monitor > Alarms.

  2. Click the Filter drop-down menu.

  3. In the Severity drop-down, select the alarm severity level. You can specify more than one severity level.

  4. In the Active drop-down, select active, cleared, or both types of alarm. Active alarms are alarms that are currently on the device but have not been acknowledged.

  5. Click the Alarm Name drop-down, select the name of the alarm. You can specify more than one alarm name.

  6. Click Search to search for alarms that match the filter.

vManage NMS displays the alarms both in table and graphical format.

Export Alarm Data in CSV Format

To export data for all alarms to a file in CSV format, click the Download icon. This icon, which is a downward-pointing arrow, is located to the right of the Search box below the Alarms Histogram.

vManage NMS downloads all data from the alarms table to an Excel file in CSV format. The file is downloaded to your browser's default download location and is named Alarms.csv.

Enable Email Notifications

You can configure the Cisco vManage to send email notifications when alarms occur on devices in the overlay network. First configure the SMTP and email recipient parameters on this screen:

  1. Click the Edit button to the right of the Email Notifications bar.

  2. In the Enable Email Notifications field, click Enabled.

  3. Select the security level for sending the email notifications. The security level can be none, SSL, or TLS.

  4. In the SMTP Server field, enter the name or IP address of the SMTP server to receive the email notifications.

  5. In the SMTP port field, enter the SMTP port number. For no security, the default port is 25; for SSL it is 465; and for TLS it is 587.

  6. In the From Address field, enter the full email address to include as the sender in email notifications.

  7. In the Reply To address, enter the full email address to include in the Reply-To field of the email. This address can be a noreply address, such as noreply@cisco.com.

  8. To enable SMTP authentication to the SMTP server, click Use SMTP Authentication. Enter the username and password to use for SMTP authentication. The default user email suffix is appended to the username. The password that you type is hidden.

  9. Click Save.

Configure alarms that trigger emails by clicking the Email Notifications button on the Monitor > Alarms screen.

Send Alarm Notifications

To send email notifications when alarms occur:

  1. In vManage Administration > Settings screen, ensure that Email Notifications is enabled.

  2. In the Monitor > Alarms screen, click Email Notifications. A list of configured notifications is displayed in the email notifications table.

  3. Click Add Email Notification.

  4. In the Name field, enter a name for the email notification. The name can be up to 128 characters and can contain only alphanumeric characters.

  5. In the Severity drop-down, select one or more alarm severity levels, from Critical, Major, Medium, and Minor.

  6. In the Alarm Name drop-down, select one or more alarms. The alarms generated for each severity level are listed in the section Alarms Generated on vManage NMS, below.

  7. In Account Details, enter the email addresses to receive email notifications:

    1. Click Add New Email List.

    2. In the Email List pop up, click Add Email.

    3. Enter the email address of a user.

    4. Add additional email addresses as desired.

    5. Click Save.

  8. In the Email Threshold field, set the maximum number of emails to be sent per minute. The number can be a value from 1 through 30. The default is 5.

  9. Click the Webhook box to trigger an HTTP callback when an alarm notification event occurs:

    1. Enter the username and password to authenticate the webhook server.

    2. Enter the URL of the webhook server.

  10. Select the routers to which the alarm notification applies, either All Devices or a custom list. If you select Custom, a device list is displayed:

    1. In the Available Devices table on the left, select one or more devices.

    2. Click the right-point arrow to move the devices to the Selected Devices table on the right.

  11. Click Add.

View and Edit Email Notification

  1. Click Email Notifications.

  2. For the desired email notification, click the View icon to the right of the row.

  3. When you are done viewing the notification, click OK.

Edit an Email Notification

  1. Click Email Notifications.

  2. For the desired email notification, click the Pencil icon to the right of the row.

  3. When you are done editing the notification, click Update.

Delete an Email Notification

  1. Click Email Notifications.

  2. For the desired email notification, click the Trash Bin icon to the right of the row.

  3. In the confirmation pop up, click OK.

For information on the permanent alarm fields and various alarms generated, see Permanent Alarms and Alarm Fields.

Permanent Alarms and Alarm Fields

Use the Alarms screen to display detailed information about alarms generated by controllers and routers in the overlay network.

Alarms Generated on Cisco vManage

The table below lists the alarms that the vManage NMS software generates. The software generates alarms when a state or condition changes, such as when a software component starts, transitions from down to up, or transitions from up to down. The severity indicates the seriousness of the alarm. When you create email notifications, the severity that you configure in the notification determines which alarms you can receive email notifications about.

Table 6.

Alarm Name

Severity

Description

AAA Admin Password Change

Critical

The password for the AAA user admin changed on a router or controller.

BFD Between Sites Down

Critical

All BFD sessions on all routers between two sites are in the Down state. This means that no data traffic can be sent to or transmitted between those two routers.

BFD Between Sites Up

Medium

A BFD session on a router between two sites transitioned to the Up state.

BFD Node Down

Critical

All BFD sessions for a router are in the Down state. This means that no data traffic can be sent to or transmitted from that router.

BFD Node Up

Medium

A BFD session for a router transitioned to the Up state.

BFD Site Down

Critical

All BFD sessions on all vEdge routers in a site are in the Down state. This means that no data traffic can be sent to or transmitted from that site.

BFD Site Up

Medium

A BFD session on a router in a site transitioned to the Up state.

BFD TLOC Down

Major

All BFD sessions for a TLOC (transport tunnel identified by a color) are in the Down state. This means that no data traffic can be sent to or transmitted from that transport tunnel.

BFD TLOC Up

Medium

A BFD session for a TLOC transitioned to the Up state.

BGP Router Down

Critical

All BGP sessions on a router are in the Down state.

BGP Router Up

Medium

A BGP session on a router transitioned to the Up state.

Clear Installed Certificate

Critical

All certificates on a controller or device, including the public and private keys and the root certificate, have been cleared, and the device has returned to the factory-default state.

Cloned vEdge Detected

Critical

A duplicate router that has the same chassis and serial numbers and the same system IP address has been detected.

Cloud onRamp

Major

The Cloud onRamp service was started on a router.

Control All vSmarts Down

Critical

All control connections from all vSmart controllers in the overlay network are in the Down state. This means that the overlay network cannot function.

Control Node Down

Critical

All control connections for a vEdge router are in the Down state.

Control Node Up

Medium

At least one control connection for a vEdge router transitioned to the Up State.

Control Site Down

Critical

All control connections from all Cisco SD-WAN devices in a site are in the Down state. This means that no control or data traffic can be sent to or transmitted from that site.

Control Site Up

Medium

A control connection from the vManage NMS and the vBond orchestrator in the site transitioned to the Up state.

Control vBond State Change

Critical Major

A control connection on a vBond orchestrator transitioned to the Down state (Critical) or the Up state (Major).

Control TLOC Down

Major

All control connections for a TLOC are in the Down state.

Control TLOC Up

Medium

A control connection for a TLOC is in the Up state.

Control vManage Down

Critical

All control connections from a vManage NMS are in the Down state.

Control vManage Up

Medium

A control connection from a vManage NMS transitioned to the Up state.

Control vSmart Down

Critical

All control connections from a vSmart controller in the overlay network are in the Down state.

Control vSmart Up

Medium

A control connection from a vSmart controller in the overlay network transitioned to the Up state.

Control vSmarts Up

Medium

Control connection from all vSmart controllers in the overlay network transition to the Up state.

CPU Load

Critical Medium

The CPU load on a controller or device has reached a critical level that could impair or shut down functionality, or a medium level that could impair functionality.

Default App List Update

Major

The default application and application family lists, which are used in application-aware routing policy, have changed.

Device Activation Failed

Critical

Activation of a software image on a controller or device failed.

Device Upgrade Failed

Critical

The software upgrade on a router failed.

DHCP Server State Change

Major

The state of a DHCP server changed.

Disk Usage

Critical Major

The disk usage load on a controller or device has reached a critical level that could impair or shut down functionality, or a medium level that could impair functionality.

Domain ID Change

Critical

A domain identifier in the overlay network changed.

Interface Admin State Change

Critical Medium

The administrative status of an interface in a controller or router changed from up to down (Critical) or down to up (Medium).

Interface State Change

Medium

The administrative or operational status of an interface changed.

Memory Usage

Critical Medium

The memory usage on a controller or device has reached a critical level that could impair or shut down functionality, or a medium level that could impair functionality.

New CSR Generated

Critical

A controller or router generated a certificate signing request (CSR).

OMP All vSmarts Down

Critical

All OMP connections from all vSmart controllers in the overlay network are in the Down state. This means that the overlay network cannot function.

OMP vSmarts Up

At least one OMP connection from all vSmart controllers in the overlay network is in the Up state.

OMP Node Down

All OMP connections for a vEdge router are in the Down state.

OMP Node Up

Medium

At least one OMP connection for a vEdge router is in the Up state.

OMP Site Down

Critical

All OMP connections to vSmart controllers from all nodes in the a are in the Down state. This means that site cannot participate in the overlay network.

OMP Site Up

Medium

At least one OMP connection to vSmart controllers from all nodes in the site is in the Up state.

OMP State Change

Critical Medium

The administration or operational state of an OMP session between a vSmart controller and a vEdge router has changed, from Up to Down (Critical) or Down to Up (Medium).

OMP vSmarts Up

Medium

OMP connection from all vSmart controllers in the overlay network transition to the Up state.

Org Name Change

Critical

The organization name used in the certificates for all overlay network devices changed.

OSPF Router Down

Critical

All OSPF connections on a router are in the Down state.

OSPF Router Up

Medium

An OSPF connection on a router transitioned to the Up state.

PIM Interface State Change

Major

The state of a PIM interface changed.

Process Restart

Critical

A process (daemon) on a controller or router restarted.

Pseudo Commit Status

Minor

The vManage NMS has started pushing a device configuration template to a controller or router. The NMS pushes a tentative configuration (called the pseudo commit) to the device and starts the rollback timer. If , with the new configuration, the control connections between the device and the vManage NMS come up, the tentative configuration becomes permanent. If the control connections do not come up, the tentative configuration is removed, and the device's configuration is rolled back to the previous configuration (that is, to the last known working).

Root Cert Chain Installed

Critical

The file containing the root certificate key chain was installed on a controller or router.

Root Cert Chain Uninstalled

Critical

The file containing the root certificate key chain was removed from a controller or router.

Site ID Change

Critical

A site identifier in the overlay network changed.

System IP Change

Critical

The system IP address on a controller or router changed.

System IP Reuse

Critical

The same system IP address is being used by more than one device in the overlay network.

System Reboot Issued

Critical Medium

A device rebooted, either initiated by the device (Critical) or by a user (Medium).

Template Rollback

Critical

The attaching of a device configuration template to a router did not succeed in the configured rollback time, and as a result, the configuration on the device was not updated, but instead was rolled back to the previous configuration.

Unsupported SFP Detected

Critical

The software detected an unsupported transceiver in a hardware router.

vEdge Serial File Uploaded

Critical

The WAN Edge serial number file was uploaded to the vManage server.

vSmart/vManage Serial File Uploaded

Critical

A vManage NMS uploaded the file containing certificate serial numbers for the vManage NMSs and vSmart controllers in the overlay network.

ZTP Upgrade Failed

Critical

A software upgrade using ZTP failed on a controller or router.

Alarm Fields

Alarm messages can contain the following fields:

Table 7.

Field

Description

acknowledged

Whether the alarm has been viewed and acknowledged. This field allows the vManage NMS to distinguish between alarms that have already been reported and those that have not yet been addressed. To acknowledge an alarm, use the following API post call:

https://vmanage-ip-address:8443/dataservice/alarms/markviewed

Specify the data as:

{“uuid”: [<uuids of alarms to acknowledge>]}

active

Whether the alarm is still active. For alarms that are automatically cleared, when a network element recovers, the alarm is marked as "active":false.

cleared_time

Time when alarm was cleared. This field is present of for alarms whose "active" field is false.

devices

List of system IP addresses or router IDs of the affected devices.

entry_time

Time when the alarm was raised, in milliseconds, expressed in UNIX time.

message

Short message that describes the alarm.

possible_causes

Possible causes for the event.

rule_name_display

Name of the alarm. Use this name when querying for alarms of a particular type.

severity

Severity of the alarm: critical, major, medium, minor.

severity_number

Integer value for the severity: 1 (critical), 2 (major), 3 (medium), 4 (minor)

uuid

Unique identifier for the alarm

values

Set of values for all the affected devices. These values, which are different for each alarm, are in addition to those shown in the "devices" field.

values_short_display

Subset of the values field that provides a summary of the affected network devices.

Events

Table 8. Feature History

Feature Name

Release Information

Description

Event Notifications Support for Cisco IOS XE SD-WAN Devices

Cisco IOS XE Release Amsterdam 17.2.1r

This feature adds support for event notifications, for Cisco IOS XE SD-WAN devices.

Use the Events screen to display detailed information on events generated by Cisco SD-WAN devices.

Set Event Filters

To set filters for searching events generated on one or more Cisco SD-WAN devices:

  1. Navigate to Monitor > Events.

  2. Click the Filter drop-down menu.

  3. In the Severity drop-down, select the event severity level. Events generated by Cisco SD-WAN devices are collected by vManage NMS and classified as:

  • Critical—indicates that action needs to be taken immediately.

  • Major—indicates that the problem needs to be looked into but is not critical enough to bring down the network.

  • Minor—is informational only.

You can specify more than one severity level.

  1. In the Component drop-down, select the configuration component that caused the event. You can select more than one configuration component.

  2. In the System IP drop-down, select the system IP of the devices for which to view generated events.

  3. In the Event Name drop-down, select the event name for which to view generated events. You can select more than one event name.

  4. Click Search to search events that match the filter.

vManage NMS displays the events both in table and graphical format.

Export Event Data in CSV Format

To export data for all events to a file in CSV format, click the Download icon. This icon, which is a downward-pointing arrow, is located to the right of the Search box below the Events Histogram.

vManage NMS downloads all data from the events table to an Excel file in CSV format. The file is downloaded to your browser’s default download location and is named Events.csv.

View Device Details

To view detailed information about a device on which an event was generated:

  1. Select the Monitor ► Events screen to display events in both graphical and table format.

  2. To view detailed information about any event generated on a device, select the event row from the table.

  3. Click the More Actions icon to the right of the row and click Device Details.

    The Device Details pop up window opens, displaying the hostname of the device originating the event and other details.

Using the CLI

If using the CLI to view information about a device on which an event was generated, for Cisco vEdge devices, you can use the show notification stream viptela command. Here is an example of the command output. The first line of the output shows the time when the message was generated (the SNMP eventTime). The time is shown in UTC format, not in the device's local time. The second line of the notification contains a description of the event, and the third line indicates the severity level.

vEdge# show notification stream viptela
notification 
 eventTime 2015-04-17T14:39:41.687272+00:00
 bfd-state-change 
  severity-level major
  host-name vEdge
  system-ip 1.1.4.2
  src-ip 192.168.1.4
  dst-ip 108.200.52.250
  proto ipsec
  src-port 12346
  dst-port 12406
  local-system-ip 1.1.4.2
  local-color default
  remote-system-ip 1.1.9.1
  remote-color default
  new-state down
 !
!
notification 
 eventTime 2015-04-17T15:12:20.435831+00:00
 tunnel-ipsec-rekey 
  severity-level minor
  host-name vEdge
  system-ip 1.1.4.2
  color default
 !
!
notification 
 eventTime 2015-04-17T16:56:50.314986+00:00
 system-login-change 
  severity-level minor
  host-name vEdge
  system-ip 1.1.4.2
  user-name admin
  user-id 9890
 !

If using the CLI to view information about a device on which an event was generated, for Cisco IOS XE SD-WAN devices, you can use the show sdwan notification stream viptela command. Here is an example of the command output. The first line of the output shows the time when the message was generated (the SNMP eventTime). The time is shown in UTC format, not in the device's local time. The second line of the notification contains a description of the event, and the third line indicates the severity level.

Device# show sdwan notification stream viptela
notification                                
 eventTime 2020-03-03T02:50:04.211317+00:00
sla-change
  severity-level major
  host-name SanJose
  system-ip 4.4.4.103
  src-ip 10.124.19.15
  dst-ip 10.74.28.13
  proto ipsec
  src-port 12426
  dst-port 12346
  local-system-ip 4.4.4.103
  local-color default
  remote-system-ip 4.4.4.106
  remote-color biz-internet
  mean-loss 17
  mean-latency 13
  mean-jitter 19
  sla-classes None
  old-sla-classes Voice-And-Video
!
!

Monitor Event Notifications

Table 9. Feature History

Feature Name

Release Information

Description

Monitoring Event Trace for OMP Agent and SD-WAN Subsystem

Cisco IOS XE Release Amsterdam 17.2.1r

Cisco SD-WAN Release 20.1.1

This feature enables monitoring and controlling the event trace function for a specified SD-WAN subsystem. Event trace provides the functionality to capture the SD-WAN traces between the SD-WAN daemons and SD-WAN subsystems.

When something of interest happens on an individual device in the overlay network, the device reports the event in the following ways:

  • Send a notification to the vManage NMS. The vManage NMS filters the event notifications and correlates related events, and it consolidates major and critical events into alarms.

  • Send an SNMP trap to the configured trap target. For each SNMP trap that a device generates, the device also generates a corresponding notification message.

  • Generate a system logging (syslog) message and place it in a syslog file in the /var/log directory on the local device and, if configured, on a remote device.

Notifications are messages that the device sends to the vManage NMS server.

To monitor and control the event trace function for a specified SD-WAN subsystem, use the monitor event-trace command in privileged EXEC mode. Event trace provides the functionality to capture the SD-WAN traces between the SD-WAN daemons and SD-WAN subsystems. For more information on the commands, see monitor event-trace sdwan and show monitor event-trace sdwan.

Audit Log

Use the Audit Log screen to display a log of all activities on Cisco SD-WAN devices.

Set Audit Log Filters

To set filters for searching audit logs:

  1. Navigate to Monitor > Audit Log.

  2. Click the Filter drop-down menu.

  3. In the Module drop-down, select the entity for which you are collecting audit logs. You can select more than one entity.

  4. Click Search to search for logs that match the filter.

vManage NMS displays a log of activities both in table and graphical format.

Export Audit Log Data in CSV Format

To export data for all audit logs to a file in CSV format, click the Download icon. This icon, which is a downward-pointing arrow, is located to the right of the filter criteria.

vManage NMS downloads all data from the audit logs table to an Excel file in CSV format. The file is downloaded to your browser’s default download location and is named Audit_Logs.csv.

View Audit Log Details

To view detailed information about any audit log:

  1. Select the audit log row from the table.

  2. Click the More Actions icon to the right of the row and click Audit Log Details.

The Audit Log Details pop up window opens, displaying details of the audit log.

View Changes to a Configuration Template

When you push a template configuration to a device, you can view changes between the old and the new configuration template. To view changes made to a configuration template:

  1. Select the audit log row from the table. The Message column of the audit log row will contain a message to the effect that the template is successfully attached to the device.

  2. Click the More Actions icon to the right of the row and click CLI Diff.

The CLI Diff pop up window opens, with the Config Diff tab selected by default. This window displays a side-by-side view of the differences between the configuration that was on the device and the changes made to the configuration. To view the changes inline, click the Inline Diff button located to the right of the window.

To view the updated configuration on the device, click the Configuration tab located to the left of the window.

ACL Log

Use the ACL Log screen to view logs for access lists (ACLs) configured on a vEdge router. Routers collect ACL logs every 10 minutes.

Set ACL Log Filters

To set filters for searching ACL logs:

  1. Navigate to Monitor > ACL Log.

  2. Click the Filter drop-down menu.

  3. In the VPN drop-down, select the entity for which you are collecting ACL logs. You can select only one VPN.

  4. Click Search to search for logs that match the filter.

vManage NMS displays a log of activities in table format.

To view logs for access lists (ACLs) configured on a WAN Edge router, use the vManage Monitor > ACL Log screen. Cisco SD-WAN routers collect ACL logs every 10 minutes.