- About this Guide
-
- Information About Cisco Unified Communications Features
- Using the Cisco Unified Communication Wizard
- Configuring the Cisco Phone Proxy
- Configuring the TLS Proxy for Encrypted Voice Inspection
- Configuring Cisco Mobility Advantage
- Configuring Cisco Unified Presence
- Configuring Cisco Unified Communications Intercompany Media Engine
- Index
Troubleshooting Connections and Resources
This chapter describes how to troubleshoot the ASA and includes the following sections:
Testing Your Configuration
This section describes how to test connectivity for the single mode ASA or for each security context, how to ping the ASA interfaces, and how to allow hosts on one interface to ping through to hosts on another interface.
We recommend that you only enable pinging and debugging messages during troubleshooting. When you are done testing the ASA, follow the steps in the “Disabling the Test Configuration” section.
This section includes the following topics:
- Enabling ICMP Debugging Messages and Syslog Messages
- Pinging ASA Interfaces
- Passing Traffic Through the ASA
- Disabling the Test Configuration
- Determining Packet Routing with Traceroute
- Tracing Packets with Packet Tracer
Enabling ICMP Debugging Messages and Syslog Messages
Debugging messages and syslog messages can help you troubleshoot why your pings are not successful. The ASA only shows ICMP debugging messages for pings to the ASA interfaces, and not for pings through the ASA to other hosts.
To enable debugging and syslog messages, perform the following steps:
Examples
The following example shows a successful ping from an external host (209.165.201.2) to the ASA outside interface (209.165.201.1):
The output shows the ICMP packet length (32 bytes), the ICMP packet identifier (1), and the ICMP sequence number (the ICMP sequence number starts at 0, and is incremented each time that a request is sent).
Pinging ASA Interfaces
To test whether the ASA interfaces are up and running and that the ASA and connected routers are operating correctly, you can ping the ASA interfaces.
To ping the ASA interfaces, perform the following steps:
Step 1 Draw a diagram of your single-mode ASA or security context that shows the interface names, security levels, and IP addresses.

Note Although this procedure uses IP addresses, the ping command also supports DNS names and names that are assigned to a local IP address with the name command.
The diagram should also include any directly connected routers and a host on the other side of the router from which you will ping the ASA. You will use this information in this procedure and in the procedure in the “Passing Traffic Through the ASA” section. (See Figure 24-1.)
Figure 24-1 Network Diagram with Interfaces, Routers, and Hosts
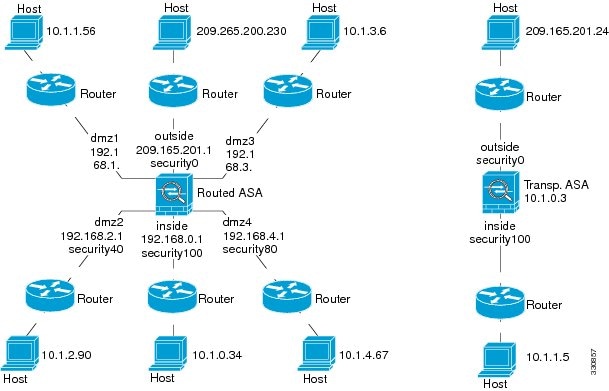
Step 2 Ping each ASA interface from the directly connected routers. For transparent mode, ping the management IP address. This test ensures that the ASA interfaces are active and that the interface configuration is correct.
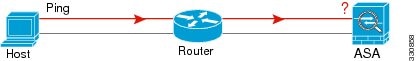
A ping might fail if the ASA interface is not active, the interface configuration is incorrect, or if a switch between the ASA and a router is down (see Figure 24-2). In this case, no debugging messages or syslog messages appear, because the packet never reaches the ASA.
Figure 24-2 Ping Failure at the ASA Interface
If the ping reaches the ASA, and it responds, debugging messages similar to the following appear:
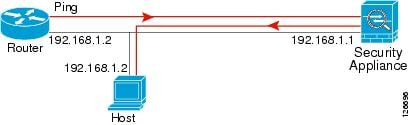
If the ping reply does not return to the router, then a switch loop or redundant IP addresses may exist (see Figure 24-3).
Figure 24-3 Ping Failure Because of IP Addressing Problems
Step 3 Ping each ASA interface from a remote host. For transparent mode, ping the management IP address. This test checks whether the directly connected router can route the packet between the host and the ASA, and whether the ASA can correctly route the packet back to the host.
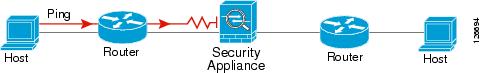
A ping might fail if the ASA does not have a return route to the host through the intermediate router (see Figure 24-4). In this case, the debugging messages show that the ping was successful, but syslog message 110001 appears, indicating a routing failure has occurred.
Figure 24-4 Ping Failure Because the ASA Has No Return Route

Passing Traffic Through the ASA
After you successfully ping the ASA interfaces, make sure that traffic can pass successfully through the ASA. By default, you can ping from a high security interface to a low security interface. You just need to enable ICMP inspection to allow returning traffic through. If you want to ping from high to low, then you need to apply an ACL to allow traffic. If you use NAT, this test shows that NAT is operating correctly.
Ping from the host or router through the source interface to another host or router on another interface. Repeat this step for as many interface pairs as you want to check.
If the ping succeeds, a syslog message appears to confirm the address translation for routed mode (305009 or 305011) and that an ICMP connection was established (302020). You can also enter either the show xlate or show conns command to view this information.
The ping might fail because NAT is not configured correctly. In this case, a syslog message appears, showing that the NAT failed (305005 or 305006). If the ping is from an outside host to an inside host, and you do not have a static translation, the following syslog message appears:
Note The ASA only shows ICMP debugging messages for pings to the ASA interfaces, and not for pings through the ASA to other hosts.
Figure 24-5 Ping Failure Because the ASA is Not Translating Addresses
Detailed Steps
Disabling the Test Configuration
After you complete your testing, disable the test configuration that allows ICMP to and through the ASA and that prints debugging messages. If you leave this configuration in place, it can pose a serious security risk. Debugging messages also slow ASA performance.
To disable the test configuration, perform the following steps:
Determining Packet Routing with Traceroute
You can trace the route of a packet using the traceroute feature, which is accessed with the traceroute command. A traceroute works by sending UDP packets to a destination on an invalid port. Because the port is not valid, the routers along the way to the destination respond with an ICMP Time Exceeded Message, and report that error to the ASA.
Tracing Packets with Packet Tracer
The packet tracer tool provides packet tracing for packet sniffing and network fault isolation, as well as detailed information about the packets and how they are processed by the ASA. If a configuration command did not cause the packet to drop, the packet tracer tool can provide information about the cause in an easily readable format.
In addition, you can trace the lifespan of a packet through the ASA to see whether the packet is operating correctly with the packet tracer tool. This tool enables you to do the following:
- Debug all packet drops in a production network.
- Verify the configuration is working as intended.
- Show all rules applicable to a packet, along with the CLI commands that caused the rule addition.
- Show a time line of packet changes in a data path.
- Inject tracer packets into the data path.
- Search for an IPv4 or IPv6 address based on the user identity and the FQDN.
To trace packets, enter the following command:
Monitoring Per-Process CPU Usage
You can monitor the processes that run on the CPU. You can obtain information about the percentage of CPU that is used by a certain process. CPU usage statistics are sorted in descending order to display the highest consumer at the top. Also included is information about the load on the CPU per process, at 5 seconds, 1 minute, and 5 minutes before the log time. This information is updated automatically every 5 seconds to provide real-time statistics.
You can use the show process cpu-usage sorted command to find a breakdown of the process-related load-to-CPU that is consumed by any configured contexts.
 Feedback