System Status

Audit Logs

Audit logs contain details of actions performed by Users. This includes, but not limited to, actions of login/logout activity, creating, deleting, updating, enabling, disabling etc. of Profiles, Rules, Gateways or any User activity that relates to the configuration and operation of the Multicloud Defense solution.

Time Format

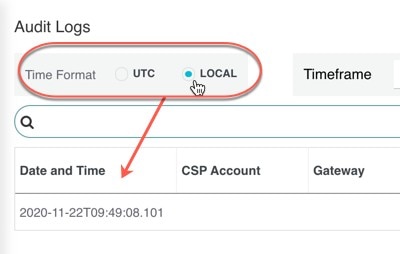
Logs can be displayed in UTC (Coordinated Universal Time) or Local time format. Local means the time zone of the user as configured e.g. USA/Pacific. Date and Time of logs will be displayed in ISO 8601 format (Complete date plus hours, minutes, seconds and a decimal fraction of a second - YYYY-MM-DD T HH:MM:SS:S). Example: 2020-11-22T10:58:46.820

To select, or switch between, different Time Formats, click the radio button as shown:
Timeframe

Logs can be displayed in increment options from 15 minutes to 30 days, or Custom timeframes. To select, or switch between, timeframes, click the drop-down menu and select a timeframe as shown:

For Custom timeframes, select Custom, the Start and the End date or time by clicking the calender objects followed by Save.

Search Filter

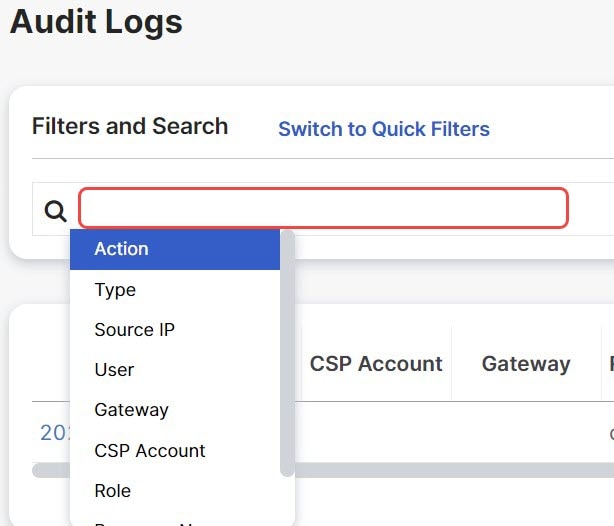
Logs can be filtered using the Search function and audit log fields. The audit log fields are Action Type Source IP User Gateway CSP Account Role

To filter audit logs on one, or multiple, fields:

Procedure


Step 1

Left mouse-click in the Search field to access the pull down menu.
Step 2

Select a field.

Step 3

Type a desired search string.

Step 4

Add additional fields to the search criteria as required.

Example: Filter for Actions = "DELETE" and performed by user with string containing "steve" would appear in the filter criteria and results.


System Logs

System logs contain details of actions that the Multicloud Defense solution performs. This includes system messages, gateway events, instance creation or deletion, and other configuration and operation modifications of the Multicloud Defense solution and more. The system stores these logs for a duration of 1 year.

Time Format

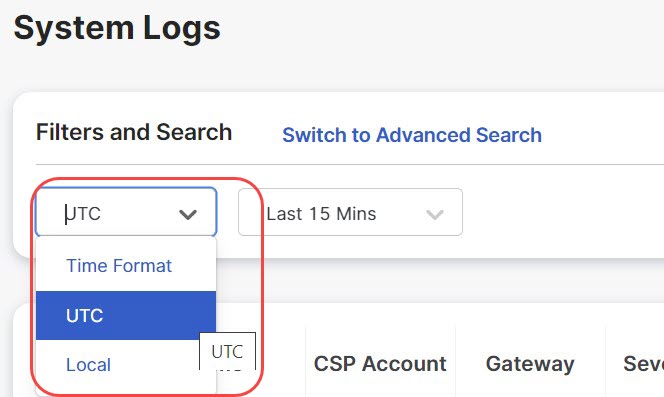
Logs display in UTC (Coordinated Universal Time) or Local time format. Local means the time zone of the user as configured. For example, USA/Pacific. Date and Time of logs display in ISO 8601 format (Complete date plus hours, minutes, seconds, and a decimal fraction of a second - YYYY-MM-DD T HH:MM:SS:S). Example: 2020-11-22T10:58:46.820

To select or switch between different time formats, click the radio button as shown:

Timeframe

You can display logs in increment options from 15 minutes to 30 days, or Custom timeframes.

To select or switch between timeframes, click the drop-down and select a timeframe as shown:

For Custom timeframes, select Custom, the Start, and the End date or time by clicking the calender objects followed by Save.

Severity Levels

The severity levels of system logs are:

  • Info - Informational details such as sign in, sign out, password changes, configuration changes and so on. These contain events that do not qualify as other severity levels.

  • Warning - Notifications that inform you of a possible system action or change, for example, password updates.

  • Medium - Issues that are medium in severity such as package upgrades and so on.

  • High - Serious issues such as network disconnections with external devices and so on.

  • Critical - Major issues that are critical in nature such as hardware failures and so on.

Search Filter

Logs can be filtered using the Search function and System log fields.

The System log fields are Gateway CSP Account Message

To filter System logs on one, or multiple, fields:

Procedure


Step 1

Left mouse-click in the Search field to access the pull down menu.

Step 2

Select a field e.g. Gateway.

Step 3

Type a desired search string e.g. ingress.

Step 4

Add additional fields to the search criteria as required.

Example: Filter for a Gateway = "ingress" and Messages containing "created" would appear in the filter criteria and results.