Threat Intelligence Director

The topics in this chapter describe how to configure and use TID in the Firepower System.

Threat Intelligence Director Overview

The Threat Intelligence Director operationalizes threat intelligence data, helping you aggregate intelligence data, configure defensive actions, and analyze threats in your environment. This feature is intended to supplement other Firepower functionality, offering an additional line of defense against threats.

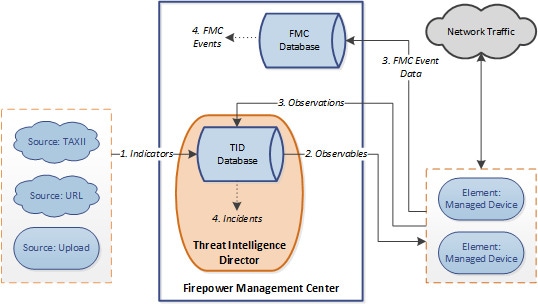
When configured on your hosting platform, TID ingests data from threat intelligence sources and publishes the data to all configured managed devices (elements.) For more information about the hosting platforms and elements supported in this release, see Platform, Element, and License Requirements.

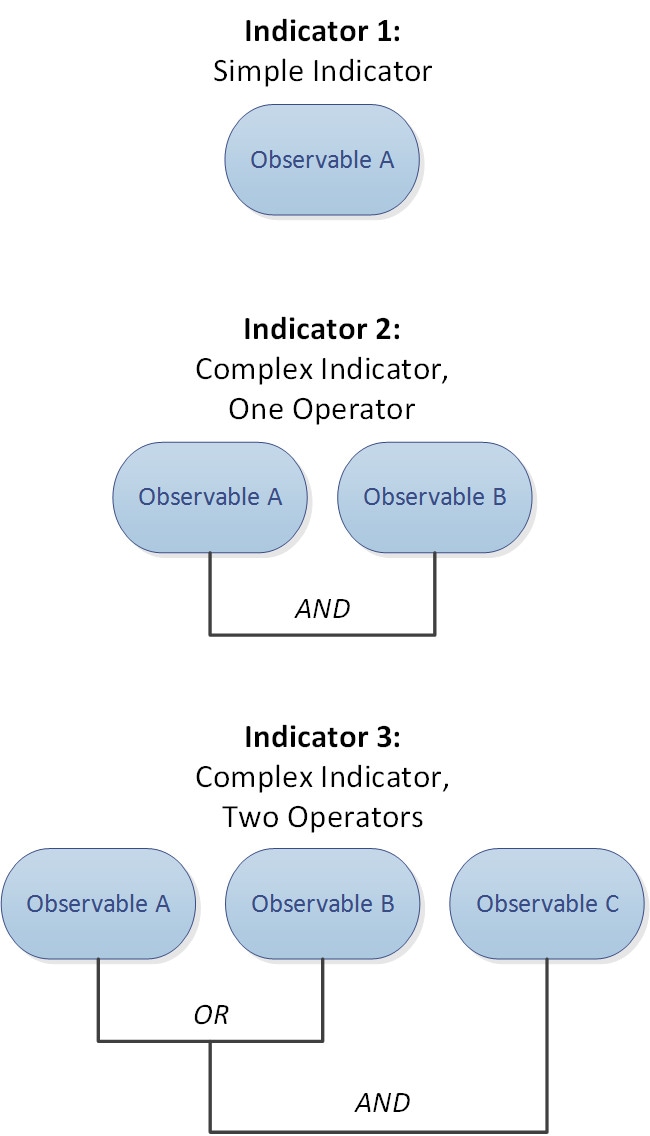
Sources contain indicators, which contain observables. An indicator conveys all of the characteristics associated with a threat, and individual observables represent individual characteristics (e.g. a SHA-256 value) associated with the threat. Simple indicators contain a single observable, and complex indicators contain two or more observables.

Observables and the AND/OR operators between them form an indicator's pattern, as illustrated in the following examples.

Figure 1. Example: Indicator Patterns


After the observables are published to the elements, the elements monitor traffic and report observations to the Firepower Management Center when the system identifies observables in traffic.

The Firepower Management Center collects observations from all elements, evaluates the observations against TID indicators, and generates or updates incidents associated with the observable's parent indicator(s).

An incident is fully realized when an indicator's pattern is fulfilled. An incident is partially realized if traffic matches one or more observables in the indicator but not the entire pattern. For more information, see Observation and Incident Generation.

The following diagram shows data flow in a sample Firepower System configuration.

Figure 2. Firepower Management Center Data Flow


When a TID incident is fully or partially realized, the system takes the configured action (monitor, block, partially block, or no action). For details, see Factors That Affect the Action Taken.

TID and Security Intelligence

As part of your access control policy, Security Intelligence uses reputation intelligence to quickly block connections to or from IP addresses, URLs, and domains. Security Intelligence uniquely provides access to industry-leading threat intelligence from Cisco Talos Intelligence Group (Talos). For more information on Security Intelligence, see About Security Intelligence.

TID enhances the system's ability to block connections based on security intelligence from third-party sources as follows:

  • TID supports additional traffic filtering criteria—Security Intelligence allows you to filter traffic based on IP address, URL, and (if DNS policy is enabled) domain name. TID also supports filtering by these criteria and adds support for filtering on SHA-256 hash values.

  • TID supports additional intelligence ingestion methods—With both Security Intelligence and TID, you can import threat intelligence into the system by either manually uploading flat files or configuring the system to retrieve flat files from a third-party host. TID provides increased flexibility in managing those flat files. In addition, TID can retrieve and ingest intelligence provided in Structured Threat Information eXpression (STIXâ„¢) format.

  • TID provides granular control of filtering actions—With Security Intelligence, you can specify filtering criteria by network, URL, or DNS object. Security Intelligence objects, especially list and feeds, can contain multiple IP addresses, URLs, or DNS domain names, but you can only block or not block based on entire objects, not based on individual components of an object. With TID, you can configure filtering actions for individual criteria (that is, simple indicators or individual observables).

  • TID configuration changes do not require redeployment—After you modify Security Intelligence settings in the access control policy, you must redeploy the changed configuration to managed devices. With TID, after initial deployment of the access control policy to the managed devices, you can configure sources, indicators, and observables without redeploying, and the system automatically publishes new TID data to the elements.

For information about what the system does when either Security Intelligence or TID could handle a particular incident, see TID-Firepower Management Center Action Prioritization.

Performance Impact of Threat Intelligence Director

Firepower Management Center

In some cases, you may notice the following:

  • The system may experience minor performance issues while ingesting particularly large STIX sources, and ingestion may take longer than expected to finish.

  • The system may take up to 15 minutes to publish new or modified TID data down to elements.

Managed Device

There is no exceptional performance impact. TID impacts performance identically to the Firepower Management Center Security Intelligence feature.

Threat Intelligence Director and High Availability Configurations

If you host TID on the active Firepower Management Center in a high availability configuration, the system does not synchronize TID configurations and TID data to the standby Firepower Management Center. We recommend performing regular backups of TID data on your active Firepower Management Center so that you can restore the data after failover.

For details, see About Backing Up and Restoring TID Data.

Requirements and Prerequisites for Threat Intelligence Director

Model Support

Any

Supported Domains

Any

User Roles

Admin

Threat Intelligence Director (TID) User

Additional Requirements

The following topics explain additional requirements for using Threat Intelligence Director.

Platform, Element, and License Requirements

Hosting Platforms

You can host TID on physical and virtual Firepower Management Centers:

  • running Version 6.2.2 or later of the Firepower System.

  • configured with a minimum of 15 GB of memory.

  • configured with REST API access enabled. See Enabling REST API Access.

Elements

You can use any Firepower Management Center-managed device as a TID element if the device is running Version 6.2.2 or later of the Firepower System.

Licensing

To configure the file policies for SHA-256 observable publishing, you need the following licensed devices:

  • For smart licensed devices:

    • Threat License - For IPv4, IPv6, URL, and DNS detection and observables

    • Malware License - For SHA-256 detection and observables

  • For classic licensed devices:

    • Protect License - For IPv4, IPv6, URL, and DNS detection and observables

    • Malware License - For SHA-256 detection and observables

For more information, see Configure Policies to Support TID and About Firepower Licenses.

Source Requirements

Source Type Requirements:

STIX

Files must be STIX Version 1.0, 1.1, 1.1.1, or 1.2 and adhere to the guidelines in the STIX documentation: http://stixproject.github.io/documentation/suggested-practices/.

STIX files can include complex indicators.

Flat File

Files must be ASCII text files with one observable value per line.

Flat files include only simple indicators (one observable per indicator.)

Flat files can be up to 500 MB.

TID does not support:

  • Delimiter characters separating observable values (e.g. observable, is invalid).

  • Enclosing characters around observable values (e.g. "observable" is invalid).

Each file should contain only one type of content:

  • SHA-256— SHA-256 hash values.

  • Domain—domain names as defined in RFC 1035.

  • URL— URLs as defined in RFC 1738.


    Note


    TID normalizes any URLs that contain port, protocol, or authentication information, and uses the normalized version when detecting indicators. For example, TID normalizes any of the following URLs:

    http://example.com/index.htm
    http://example.com:8080/index.htm
    example.com:8080/index.htm
    example.com/index.htm

    as:

    example.com/index.htm

    Or, for example, TID normalizes the following URL:

    
    http://abc@example.com:8080/index.htm

    as

    abc@example.com/index.htm/

  • IPv4— IPv4 addresses as defined in RFC 791.

    TID does not accept CIDR blocks.

  • IPv6— IPv6 addresses as defined in RFC 4291.

    TID does not accept prefix lengths.

Source Content Limitations

The system ingests, and matches on, only the first 1000 characters of a URL observable.

How To Set Up Threat Intelligence Director


Note


If you encounter an issue during TID configuration or operation, see Troubleshoot Threat Intelligence Director.


Procedure


Step 1

Ensure that your installation meets the requirements for running TID.

See Platform, Element, and License Requirements

Step 2

For each managed device, configure the policies required to support TID and deploy those policies to the devices.

See Configure Policies to Support TID.

You can configure elements before or after you ingest intelligence data sources.

Step 3

Configure the intelligence sources that you want TID to ingest.

See Source Requirements and the topics under Options for Ingesting Data Sources.

Step 4

Publish data to the elements if you have not yet done so. See Pause or Publish TID Data at the Source, Indicator, or Observable Level.


What to do next

Configure Policies to Support TID

You must configure access control policies to publish TID data from the Firepower Management Center to your managed devices (elements). In addition, we recommend that you configure your access control policies to maximize observation and Firepower Management Center event generation.

For each managed device that you want to support TID, perform the steps below to configure the associated access control policy.

Elements that are configured to use TID after data has been published will automatically receive all currently-published observables.

Procedure


Step 1

Verify that the Enable Threat Intelligence Director check box is checked in Advanced Settings of the access control policy. This option is enabled by default.

For more information, see Access Control Policy Advanced Settings.

Step 2

Add rules that allow (rather than trust) connections to the access control policy if they are not already present. TID requires that the access control policy specify at least one rule.

Because TID depends on inspection, ensure that you allow traffic, rather than trust it, because the purpose of trusting traffic is to bypass inspection. For more information, see Creating a Basic Access Control Policy.

Step 3

If you choose Intrusion Prevention as the default action for the access control policy and you want to decrypt traffic for TID detection, associate an SSL policy with the access control policy; see Associating Other Policies with Access Control.

Step 4

If you want SHA-256 observables to generate observations and Firepower Management Center events:

  1. Create a file policy containing one or more Malware Cloud Lookup or Block Malware file rules.

    For more information, see Configure File Policies.

  2. Associate this file policy with one or more rules in the access control policy.

Step 5

If you want IPv4, IPv6, URL, or Domain Name observations to generate connection and security intelligence events, enable connection and security intelligence logging in the access control policy:

  1. In access control rules where you invoked a file policy, enable Log at End of Connection and File Events: Log Files, if not already enabled.

    For more information, see Logging Connections with Access Control Rules.

  2. Verify that default logging (DNS Policy, Networks, and URLs) is enabled in your Security Intelligence settings.

    For more information, see Logging Connections with Security Intelligence.

Step 6

Deploy configuration changes; see Deploy Configuration Changes.


What to do next

Complete remaining items in How To Set Up Threat Intelligence Director

Options for Ingesting Data Sources

Choose a configuration option based on the data type and delivery mechanism you want to use.

For more information about these data types, see Source Requirements.

Table 1. Options for Ingesting Data Sources

Data Type

Ingestion Options

STIX

Flat file

Fetch TAXII Feeds to Use as Sources

If you encounter an issue during TID configuration or operation, see Troubleshoot Threat Intelligence Director

Procedure

Step 1

Make sure your source meets the requirements in Source Requirements

Step 2

Choose Intelligence > Sources.

Step 3

Click Add (add icon).

Step 4

Choose TAXII as the Delivery method for the source.

Step 5

Enter information.

  • If the host server requires an encrypted connection, configure the SSL Settings as described in Configure TLS/SSL Settings for a TID Source.

  • You cannot change the Action selection for TAXII sources.

    Block is not an Action option for TAXII sources, as STIX data can contain complex indicators, which the system cannot block. Devices (elements) store and take action based on single observables; they cannot take action based on multiple observables.

    However, after ingestion, you can block individual observables and simple indicators obtained from the source. For more information, see Edit TID Actions at the Source, Indicator, or Observable Level.

  • It may take some time for the list of feeds to load.

  • The Update Every interval specifies the frequency that TID retrieves updates from the TAXII source.

    Set an update frequency that makes sense for how often the data source is updated. For example, if the source is updated 3 times per day, set your update interval to 1440/3 or 480 minutes to regularly capture the latest data.

  • After the number of days you specify for TTL, TID deletes:

    • all of the source's indicators that are not included in subsequent source updates.

    • all observables not referenced by a surviving indicator.

Step 6

If you want to immediately begin publishing to elements, confirm that the Publish Slider (slider icon) is enabled.

When this option is enabled, the system automatically publishes the initial source data and any subsequent changes.

For details, see Pause or Publish TID Data at the Source, Indicator, or Observable Level.

Step 7

Click Save.


What to do next
  • TAXII feeds can contain a lot of data, it may take some time for the system to ingest all of the data. To view ingestion status, refresh the Sources page.

  • If you see an error for this source, hover over status for details.

  • If you are doing initial TID configuration, return to How To Set Up Threat Intelligence Director.

Fetch Sources from a URL

Configure a URL source if you want TID to fetch files from a host.

If you encounter an issue during TID configuration or operation, see Troubleshoot Threat Intelligence Director

Procedure

Step 1

Make sure your source meets the requirements in Source Requirements

Step 2

Choose Intelligence > Sources.

Step 3

Click Add (add icon).

Step 4

Choose URL as the Delivery method for the source.

Step 5

Complete the form.

  • If you are ingesting a flat file, choose a Type that describes the data contained within the source.

  • If the host server requires an encrypted connection, configure the SSL Settings as described in Configure TLS/SSL Settings for a TID Source.

  • For Name: To simpify sorting and handling of incidents based on TID indicators, use a consistent naming scheme across sources. For example, <source>-<type>.

    Including the source name simplifies returning to the source for further information or feedback.

    Be sure to enter the name consistently. For example, for a source with IPv4 addresses, you might always use IPV4 (not IPv4 or ipv4 or IP_v4 or IP_V4 or ip-v4 or IP-v4, IP-V4, etc.)

  • If you are ingesting a STIX file, Block is not an Action option, as STIX data can contain complex indicators, which the system cannot block. Devices (elements) store and take action based on single observables; they cannot take action based on multiple observables.

    However, after ingestion, you can block individual observables and simple indicators obtained from the source. For more information, see Edit TID Actions at the Source, Indicator, or Observable Level.

  • Set an update frequency that makes sense for how often the data source is updated. For example, if the source is updated 3 times per day, set your update interval to 1440/3 or 480 minutes to regularly capture the latest data.

  • After the number of days you specify for the TTL interval, TID deletes:

    • all of the source's indicators that are not included in subsequent source updates.

    • all observables not referenced by a surviving indicator.

Step 6

If you want to immediately begin publishing to elements, confirm that the Publish Slider (slider icon) is enabled.

When this option is enabled, the system automatically publishes the initial source data and any subsequent changes.

For details, see Pause or Publish TID Data at the Source, Indicator, or Observable Level.

Step 7

Click Save.


What to do next

Upload a Local File to Use as a Source

Use this procedure for a one-time manual upload of a local file.

When ingesting a STIX file, TID creates a simple or complex indicator from the contents of the STIX file.

When ingesting a flat file, TID creates a simple indicator for each observable value in the file.

If you encounter an issue during TID configuration or operation, see Troubleshoot Threat Intelligence Director

Procedure

Step 1

Make sure your file meets the requirements in Source Requirements

Step 2

Choose Intelligence > Sources.

Step 3

Click Add (add icon).

Step 4

Choose Upload as the Delivery method for the source.

Step 5

Complete the form.

  • If you are uploading a flat file, choose a Type that describes the data contained within the source.

  • For Name: To simpify sorting and handling of incidents based on TID indicators, use a consistent naming scheme across sources. For example, <source>-<type>.

    Including the source name simplifies returning to the source for further information or feedback.

    Be sure to enter the name consistently. For example, for a source with IPv4 addresses, you might always use IPV4 (not IPv4 or ipv4 or IP_v4 or IP_V4 or ip-v4 or IP-v4, IP-V4, etc.)

  • If you are uploading a STIX file, Block is not an Action option, because STIX data can contain complex indicators. Devices (elements) store and take action based on single observables; they cannot take action based on multiple observables.

    However, you can block a simple indicator at the indicator or observable level. For more information, see Edit TID Actions at the Source, Indicator, or Observable Level.

  • After the number of days you specify for the TTL interval, TID deletes:

    • all of the source's indicators that are not included in a subsequent upload.

    • all observables not referenced by a surviving indicator.

Step 6

If you want to immediately begin publishing to elements, confirm that the Publish Slider (slider icon) is enabled.

If you do not publish the source at ingestion, you cannot publish all source indicators at once later; instead, you must publish each observable individually. See Pause or Publish TID Data at the Source, Indicator, or Observable Level.

Step 7

Click Save.


What to do next

Handling of Duplicate Indicators

If a single indicator is included in multiple sources:

  • Indicators from flat file sources – Each instance of the indicator generates an incident, so one encounter with a particular threat may generate multiple incidents.

  • Indicators from STIX sources – If indicators from different STIX sources share the same ID, only one incident will be generated for that indicator, regardless of the number of sources that include it.

To avoid future duplicate incidents, pause publishing of all but one of the duplicated indicators. See Pause or Publish TID Data at the Source, Indicator, or Observable Level.

Configure TLS/SSL Settings for a TID Source

Configure SSL Settings if the host server requires an encrypted connection.

Before you begin
Procedure

Step 1

In the Edit Source dialog, expand the SSL Settings section.

Step 2

If your server certificate is self-signed:

  1. Enable Self-Signed Certificate.

  2. Choose a SSL Hostname Verification method.

    • Strict—TID requires the source URL to match the hostname provided in the server certificate.

      If the hostname includes a wildcard, TID cannot match more than one subdomain.

    • Browser Compatible—TID requires the source URL to match the hostname provided in the server certificate.

      If the hostname includes a wildcard, TID matches all subdomains.

    • Allow All—TID does not require the source URL to match the hostname provided in the server certificate.

    For example, if subdomain1.subdomain2.cisco.com is your source URL and *.cisco.com is the hostname provided in the server certificate:

    • Strict hostname verification fails.

    • Browser Compatible hostname verification succeeds.

    • Allow All hostname verification ignores the hostname values completely.

  3. For Server Certificate:

    • If you have access to the PEM-encoded self-signed server certificate, open the certificate in a text editor and copy the entire block of text, including the BEGIN CERTIFICATE and END CERTIFICATE lines. Enter this entire string into the field.

    • If you do not have access to the self-signed server certificate, leave the field blank. After you save the source, TID retrieves the certificate from the server.

Step 3

If your server requires a user certificate:

  1. Enter a User Certificate:

    Open the PEM-encoded certificate in a text editor and copy the entire block of text, including the BEGIN CERTIFICATE and END CERTIFICATE lines. Enter this entire string into the field.

  2. Enter a User Private Key:

    Open the private key file in a text editor and copy the entire block of text, including the BEGIN RSA PRIVATE KEY and END RSA PRIVATE KEY lines. Enter this entire string into the field.


What to do next

User Roles with TID Access

You can use Firepower Management Center user accounts to access the TID menus and pages:

  • Accounts with the Admin or Threat Intelligence Director User user role.

  • Accounts with a custom user role containing the Intelligence permission.

In addition, you can use Firepower Management Center user accounts with the Admin, Access Admin, or Network Admin user role to enable or disable TID in your access control policies.

For more information about user accounts, see User Accounts for Management Access.

About Backing Up and Restoring TID Data

You can use the Firepower Management Center to back up and restore all of the data needed for TID: Element data, security intelligence events, connection events, TID configurations, and TID data. For more information, see Backup and Restore.


Note


If you host TID on the active Firepower Management Center in a high availability configuration, the system does not synchronize TID configurations and TID data to the standby Firepower Management Center. We recommend performing regular backups of TID data on your active Firepower Management Center so that you can restore the data after failover.
Table 2. TID-Related Backup and Restore File Contents

TID-Related File Contents

Backup Selection

Restore Selection

Element data

Back Up Configuration

Restore Configuration Data

Firepower Management Center event data

Back Up Events

Restore Event Data

TID configurations and TID data

Back Up Threat Intelligence Director

Restore Threat Intelligense Director Data

Analyze TID Incident and Observation Data

To analyze incident and observation data generated by TID elements, use the Incidents table and Incident Details page.

Observation and Incident Generation

TID generates an incident when the first observable for an indicator is seen in traffic. Simple indicators are fully realized after a single observation. Complex indicators are partially realized until one or more additional observations fulfill their pattern. Complex indicators need not necessarily be fulfilled during a single transaction; each observable can be fulfilled separately over time, by different transactions.


Note


When evaluating an indicator's pattern, TID ignores unsupported and invalid objects and observables on the Do Not Block list.


After an incident is fully realized, subsequent observations trigger new incidents.

Figure 3. Example: Indicator Patterns


If TID ingested the observables from the example above and the observables were seen in order, incident generation would proceed as follows:

  1. When the system identifies Observable A in traffic, TID:

    • Generates a fully-realized incident for Indicator 1.

    • Generates partially-realized incidents for Indicator 2 and Indicator 3.

  2. When the system identifies Observable B in traffic, TID:

    • Updates the incident to fully-realized for Indicator 2, since the pattern was fulfilled.

    • Updates the incident to partially-realized for Indicator 3.

  3. When the system identifies Observable C in traffic, TID:

    • Updates the incident to fully-realized for Indicator 3, since the pattern was fulfilled.

  4. When the system identifies Observable A for a second time, TID:

    • Generates a new fully-realized incident for Indicator 1.

    • Generates new partially-realized incidents for Indicator 2 and Indicator 3.

If a particular indicator exists in multiple sources, you may see duplicate incidents. For more information, see Troubleshoot Threat Intelligence Director.

Note that incidents are generated only by actual traffic. If there is an observable for URL B, and a user visits URL A which displays a link to URL B, no incident occurs unless the user clicks the URL B link.

View and Manage Incidents

The Incidents page displays summary information for up to 1.1 million of the most recent TID incidents; see Incident Summary Information.

Before you begin

Procedure


Step 1

Select Intelligence > Incidents.

Step 2

View your incidents:

  • Click Filter (filter icon) to add one or more filters. The default filter is 6 hours. For more information, see Filter TID Data in Table Views.

  • To view the date and time an incident was last updated by TID, hover the cursor over the value in the Last Updated column.

  • To view more information about the indicator associated with the incident, click the text in the Indicator Name column; see View and Manage Indicators.

Step 3

View additional details by clicking a value in the Incident ID column.

For an explanation of the details you see, see Incident Details.

  • To view indicator details, click an indicator value (for example, an IP address or SHA-256 value) under the Indicator heading in the lower section of the window.

  • To view observation details, click the arrow to the left of an observation immediately under the Observations heading.

  • To view this incident on the Security Intelligence Events page, click the Events link in the observation details section.

Step 4

(Optional) Enter descriptive information on the incident details page:

Tip: To maximize consistency and usefulness of the options below, plan ahead and document your naming conventions, category choices, and confidence level criteria.

  • Enter any value you like in the following fields: Name, Description, and Category.

  • Click a rating level for Confidence.

  • Indicate the status of your investigation into the incident by choosing a value from the drop-down list in the Status field.


Incident Summary Information

The Incidents page displays summary information for all TID incidents.

Table 3. Incident Summary Information

Field

Description

Last Updated

The number of days since either the system or a user last updated the incident. To view the date and time of the update, hover the cursor over the value in this column.

Incident ID

The unique identifier for the incident. This ID has the following format:

<type>-<date>-<number>
  • <type>—The type of indicator or observable involved in the incident. For simple indicators, this value indicates the observable type: IP (IPv4 or IPv6), URL (URL), DOM (domain), or SHA (SHA-256). For complex indicators, this value is COM.

  • <date>—The date (yyyymmdd) on which the incident was created.

  • <number>—The daily incident number, that is, a number specifying where the incident occurs in the daily sequence of incidents. Note that this sequence starts at 0. For example, DOM-20170828-10 is the 11th incident created on that day.

Next to the identifier, the system displays an icon that indicates whether the incident is Partially Realized or Fully Realized. For more information, see Observation and Incident Generation.

Indicator Name

The name of the indicator involved in the incident. To view additional information about the indicator, click the value in this column; see View and Manage Indicators.

Type

The type of indicator involved in the incident.

  • Indicators that contain a single observable display the data type (URL, SHA-256, etc.)

  • Indicators that contain two or more observables display as Complex.

Action Taken

The action taken by the system in relation to the incident. For more information, see Incident Details.

Status

The status of your investigation into the incident. For more information, see Incident Details.

Delete (delete icon)

Clicking this icon permanently deletes the incident.

Incident Details

The Incident Details window displays information about a single TID incident. This window is divided into two sections:

Incident Details: Basic Information

The upper section of the Incident Details window provides the information described below.

Table 4. Basic Incident Information Fields

Field

Description

Partially-Realized IncidentID or Fully-Realized IncidentID

An icon indicating the incident's status (partially-realized or fully-realized), as well as the unique identifier for the incident.

Note


When determining an incident's status, TID ignores unsupported and invalid observables and observables on the Do Not Block list.

Opened

The date and time the incident was last updated.

Name

A custom, optional incident name that you enter manually.

Tip: If there is information from the source in the Description field (in the bottom part of the window), use information from that field to name the incident.

Description

A custom, optional incident description that you enter manually.

Tip: If there is information from the source in the Description field (in the bottom part of the window), use information from that field to describe the incident.

Observations

The number of observations within the incident.

Confidence

An optional rating that you can manually select to indicate the relative importance of the incident.

Action Taken

The action taken by the system: Monitored, Blocked, or Partially Blocked.

Partially Blocked indicates that the incident contained both Monitored and Blocked observations.

Note


The Action Taken indicates the action taken by the system, not necessarily the action selected in TID. For more information, see TID-Firepower Management Center Action Prioritization.

Category

A custom, optional tag or keyword that you manually add to the incident.

Status

A value indicating the current stage of your analysis of the incident. All incidents are New until you change the Status for the first time.

This field is optional. Depending on the needs of your organization, consider using the status values as follows:

  • New—The incident requires investigation, but you have not started investigating.

  • Open—You are currently investigating the incident.

  • Closed—You investigated the incident and took action.

  • Rejected—You investigated the incident and determined there was no action to take.

Delete (delete icon)

Clicking this icon permanently deletes this incident.

Incident Details: Indicator and Observations

The lower section of the Incident Details window provides an in-depth view of the indicator and observation information. This information is organized as Indicator fields, the indicator pattern, and Observations fields.

Indicator Section

When you first view indicator details, this section displays only the indicator name.

Click the indicator name to view the indicator on the Indicators page.

Click the down arrow next to the indicator name to view more indicator details without leaving the incident. Detail fields include:

Table 5. Indicator Fields

Field

Description

Description

The indicator description provided by the source.

Source

The source that contained the indicator. Click this link to access full source details.

Expires

The date and time the incident will expire, based on the source's TTL value.

Action

The action associated with the indicator. For more information, see Edit TID Actions at the Source, Indicator, or Observable Level.

Publish

The publish setting for the indicator. For more information, see Pause or Publish TID Data at the Source, Indicator, or Observable Level.

Download STIX

If the source type is STIX, click this button to download the STIX file.

Indicator Pattern

The indicator pattern is a graphical representation of the observables and operators that comprise the indicator. Operators link the observables within the indicator. AND relationships are indicated with the AND operator. OR relationships are indicated with the OR operator or by a close grouping of several observables.

If an observable in the pattern has already been seen, the observable box is white. If an observable has not already been seen, the observable box is grey.

In the indicator pattern:

  • Click the Whitelist button to add the observable to the Do Not Block list. This icon is present in both white and grey observable boxes. For more information, see About Adding TID Observables to the Do Not Block List.

  • If you hover the cursor over a white observable box, the system highlights the related observation in the Observations section.

  • If you click a white observable box, the system highlights the related observation in the Observations section, scrolls that observation into view (if multiple observations are present), and expands that observation's detailed display.

  • If you hover the cursor over or click a grey observable box in the indicator pattern, there is no change in the Observations section. Because the observable is unseen, there are no observation details to display yet.

Observations Section

By default, the Observations section displays summary information, which includes:

  • The type of observable that triggered the observation (for example, Domain)

  • The data that comprises the observable

  • Whether the observation is the first observation or a subsequent observation (for example, 1st or 3rd)


    Note


    If a single observable has been seen three or more times, TID displays the first and last observation details. The details for intermediary observations are not available.


  • The date and time of the observation

  • The action configured for the observable

If you hover the cursor over an observation in the Observations section, the system highlights the related observable in the indicator pattern.

If you click an observation in the Observations section, the system highlights the related observable(s) in the indicator pattern and scrolls the first related observable into view (if multiple observables are present). Clicking an observation also expands the details of the observation in the Observations section.

Observation details include the following fields:

Table 6. Observation Detail Fields

Field

Description

SOURCE

The source IP address and port for the traffic that triggered the observation.

DESTINATION

The destination IP address and port for the traffic that triggered the observation.

ADDITIONAL INFORMATION

DNS and authentication information related to the traffic that triggered the observation.

Events

This clickable link displays if the observation generated connection, security intelligence, file, or malware events. Click the link to view the events in the Firepower Management Center event table; see About Connection Events.

View Events for a TID Observation

For more information about the Firepower Management Center events that TID observations generate, see TID Observations in Firepower Management Center Events.

The system action logged for TID-related events can vary, depending on the interaction of TID and other Firepower Management Center features. For more information about action prioritization, see TID-Firepower Management Center Action Prioritization.

Before you begin

Procedure


Step 1

Choose Intelligence > Incidents.

Step 2

Click the Incident ID value for the incident.

Step 3

Click the observation in the Indicator section to display the observation box.

Step 4

Expand the observation box by clicking the arrow in the upper-left corner of the box.

Step 5

Click the Events link in the observation information. For more information on the Security Intelligence display, see About Connection Events.


TID Observations in Firepower Management Center Events

If you fully configure your access control policy, TID observations generate the following Firepower Management Center events:

Table 7. Firepower Management Center Events Generated by Observations

Observation Content

Connection Events Table

Security Intelligence Events Table

File Events Table

Malware Events Table

SHA-256

Yes

No

Yes

Yes, if disposition is Malware or Custom Detection.

Domain Name, URL, or IPv4/IPv6

Yes

TID-related connection events are identified with a TID-related Security Intelligence Category value.

Yes

TID-related security intelligence events are identified with a TID-related Security Intelligence Category value.

No

No

Factors That Affect the Action Taken

Many factors determine when the system takes action and what action the system takes when it detects traffic that matches a TID observable.

TID-Firepower Management Center Action Prioritization

If TID observable actions conflict with Firepower Management Center policy actions, the system prioritizes actions as follows:

  • Security Intelligence Do Not Block

  • Security Intelligence Block

  • TID Block

  • Security Intelligence Monitor

  • TID Monitor

Specifically:

Table 8. TID URL Observable Action vs. Security Intelligence Action

Setting: Security Intelligence Action

Setting: TID Observable Action

TID Incidents Field: Action Taken

Security Intelligence Events Fields:

Action

Security Intelligence Category

Reason

Whitelist

Monitor or Block

No TID incident

No Security Intelligence event

Block

Monitor

Blocked

Block

as determined by system analysis; see Security Intelligence Categories

URL Block

Block

No TID incident

Block

as determined by system analysis; see Security Intelligence Categories

URL Block

Monitor

Monitor

No TID incident

Determined by access control rules processed after Security Intelligence and TID.

as determined by system analysis; see Security Intelligence Categories

URL Monitor

Block

Blocked

Block

TID URL Block

URL Block

Table 9. TID IPv4/IPv6 Observable Action vs. Security Intelligence Action

Setting: Security Intelligence Action

Setting: TID Observable Action

TID Incidents Field: Action Taken

Security Intelligence Events Fields:

Action

Security Intelligence Category

Reason

Whitelist

Monitor or Block

No TID incident

No Security Intelligence event

Block

Monitor

Blocked

Block

as determined by system analysis; see Security Intelligence Categories

IP Block

Block

No TID incident

Block

as determined by system analysis; see Security Intelligence Categories

IP Block

Monitor

Monitor

No TID incident

Determined by access control rules processed after Security Intelligence and TID.

as determined by system analysis; see Security Intelligence Categories

IP Monitor

Block

Blocked

Block

TID IPv4 Block

TID IPv6 Block

IP Block

Table 10. TID Domain Name Observable Action vs. DNS Policy Action

Setting: DNS Policy Action

Setting: TID Domain Name Observable Action

TIDIncidents Field: Action Taken

Security Intelligence Events Fields:

Action

Security Intelligence Category

Reason

Whitelist

Monitor or Block

No TID incident

No Security Intelligence event

Drop, Domain Not Found

Sinkhole—Log

Sinkhole—Block and Log

Monitor

Blocked

Block

as determined by system analysis; see Security Intelligence Categories

DNS Block

Block

Blocked

Block

TID Domain Name Block

DNS Block

Monitor

Monitor

Monitored

Determined by access control rules processed after Security Intelligence and TID.

as determined by system analysis; see Security Intelligence Categories

DNS Monitor

Block

Blocked

Block

TID Domain Name Block

DNS Block

Table 11. TID SHA-256 Observable Action vs. Malware Cloud Lookup File Policy

File Disposition

TID SHA-256 Observable Action

Action Taken in TID Incidents

Action in File Events

Action in Malware Events

Clean

Monitor or Block

Monitored

Malware Cloud Lookup

n/a

Malware

Monitor or Block

Monitored

Malware Cloud Lookup

n/a

Custom

Monitor or Block

Monitored

  • Malware Cloud Lookup, if SHA-256 is not in a custom detection list.

  • Custom Detection, if SHA-256 is in a custom detection list.

  • Malware Cloud Lookup, if SHA-256 is not in a custom detection list.

  • Custom Detection, if SHA-256 is in a custom detection list.

Unknown

Monitor or Block

Monitored

Malware Cloud Lookup

n/a


Note


TID matching occurs before the system sends a file for dynamic analysis.
Table 12. TID SHA-256 Observable Action vs. Block Malware File Policy

File Disposition

TID SHA-256 Observable Action

Action Taken in TID Incidents

Action in File Events

Action in Malware Events

Clean or Unknown

Monitor

Monitored

Malware Cloud Lookup

n/a

Block

Blocked

  • TID Block, if SHA-256 is not in a custom detection list.

    Modified file disposition is Custom.

  • Custom Detection Block, if SHA-256 is in a custom detection list.

TID Block

Modified file disposition is Custom.

Malware or Custom

Monitor

Blocked

Block Malware

Block Malware

Block

Blocked

  • TID Block, if SHA-256 is not in a custom detection list.

    Modified file disposition is Custom.

  • Custom Detection Block, if SHA-256 is in a custom detection list.

TID Block

Modified file disposition is Custom.

View and Change Threat Intelligence Director Configurations

Use the following information to review and fine-tune your configuration as needed.

View TID Status of Elements (Managed Devices)

All devices that are registered to the Firepower Management Center as managed devices appear automatically on the Elements page. All properly-configured elements (as specified in Configure Policies to Support TID) will receive all currently-published observables, including those ingested before the element was added.

Procedure


Step 1

Choose Intelligence > Elements.

Step 2

To see whether the element is connected and TID is enabled, hover over the icon beside the element name.


View and Manage Sources

The Sources page displays summary information about all configured sources; see Source Summary Information.

Procedure


Step 1

Choose Intelligence > Sources.

Step 2

View your sources:

  • To filter the sources displayed on the page, click Filter (filter icon). For more information, see Filter TID Data in Table Views.

  • To view detailed ingestion status, hover the cursor over the text in the Status column. For more information, see Source Status Details.

Step 3

Manage your sources:

  • To edit the Action setting, see Edit TID Actions at the Source, Indicator, or Observable Level. If an action is fixed, it is the only supported action for the source Type.

  • To edit the Publish setting, click Slider (slider icon). For more information, see Pause or Publish TID Data at the Source, Indicator, or Observable Level.

  • To pause or resume TID updating the source, click Pause Updates or Resume Updates. If you pause updates, updating is paused but existing indicators and observables remain in TID.

  • To delete the source, click Delete (delete icon). Delete is greyed out if the source is still processing. Deleting a source deletes all indicators associated with that source. Associated observables may also be deleted; they are retained if they are associated with indicators remaining in the system.


Source Summary Information

The Sources page displays summary information for all configured sources. The table below provides brief descriptions of the fields in the summary display. For detailed information on these fields, see descriptions in the relevant configuration topic for the source: See Options for Ingesting Data Sources.

Table 13. Sources Summary Information

Field

Description

Name

The source name.

Type

The data format of the source (STIX or Flat File).

Delivery

The method TID uses to retrieve the source.

Action

The action (Block or Monitor) that the system is configured to perform on traffic matching the data contained within this source.

For more information about TID actions, including availability, inheritance, and overriding inheritance, see Factors That Affect the Action Taken.

Publish

On or Off toggle specifying whether TID publishes data from the source to registered elements (managed devices configured to support TID).

Indicators can inherit Publish settings from a parent source, and observables can inherit Publish settings from a parent indicator. For more information, see Inheritance in TID Configurations.

Last Updated

The date and time TID last updated the source.

Status

The current status of the source:

  • New—The source is newly created.

  • Scheduled—The initial download or subsequent update is scheduled, but not yet in progress.

  • Downloading—TID is performing the initial download or update refresh.

  • Parsing or Processing—TID is ingesting the source.

  • Completed—TID finished ingesting the source.

  • Completed with Errors—TID finished ingesting the source, but some observables are unsupported or invalid.

  • Error—TID experienced a problem. If the source is a TAXII or URL source with an Update Frequency specified, and updates are not paused, TID retries on the next scheduled update.

Refresh the page to update the status.

Edit (edit icon)

Clicking this icon allows you to edit settings for the source.

Delete (delete icon)

Clicking this icon permanently deletes the source.

Source Status Details

When you hover over a source's Status value in the Sources summary page, TID provides the additional details described below.

Data

Description

Status Message

Briefly describes the current status of the source.

Last Updated

Specifies the date and time TID last updated the source.

Next Update

For TAXII and URL sources, this value specifies when TID will update the source next.

Indicators

Specifies indicator counts:

  • Consumed—The number of indicators TID processed during the most recent source update. This number represents all indicators contained in the update, regardless of whether they were ingested or discarded.

  • Discarded—The number of malformed indicators that the system did not add to TID during the most recent update.

    Note


    For TAXII sources, TID provides separate Last Update and Total indicator counts, because TAXII updates add incremental data, rather than replacing existing data. For indicators from other source types, TID provides only the Last Update count, because updates from those sources replace the existing data set entirely.

    If all of an indicator's observables are Invalid, TID discards the indicator.

Observables

Specifies observable counts:

  • Consumed—The number of observables TID processed during the most recent source update. This number represents all observables contained in the update, regardless of whether they were ingested or discarded.

  • Unsupported—The number of unsupported observables that the system did not add to TID during the most recent update.

    For more information about supported observable types, see information about content types in Source Requirements.

  • Invalid—The number of invalid observables that the system did not add to TID during the most recent update.

    An observable is invalid if it is improperly constructed. For example, 10.10.10.10.123 is not a valid IPv4 address.

    Note


    For TAXII sources, TID provides separate Last Update and Total observable counts, because TAXII updates add incremental data, rather than replacing existing data. For observables from other source types, TID provides only the Last Update count, because updates from those sources replace the existing data set entirely.

View and Manage Indicators

Indicators are generated automatically from ingested sources. For more information about information on this page, see Indicator Summary Information.

Procedure


Step 1

Choose Intelligence > Sources.

Step 2

Click Indicators.

Step 3

View your current indicators:

  • To filter the indicators displayed on the page, click Filter (filter icon). For more information, see Filter TID Data in Table Views.

  • To view additional details about an indicator (including associated observables), click the indicator name. For more information, see Indicator Details.

  • In the Incidents column, click the number to view information about incidents associated with an indicator, or hover the cursor over Incidents to view whether the incidents are fully- or partially-realized.

  • To determine whether TID finished ingesting an indicator from the source, view the Status column.

Step 4

Manage your current indicators:


Indicator Summary Information

The Indicators page displays summary information for all indicators associated with configured sources.

Table 14. Indicators Summary Information

Field

Description

Type

  • Indicators that have a single observable list the data type of that observable (URL, SHA-256, etc.)

  • Indicators that have two or more observables are listed as Complex.

Hover over the type to see the specific observable.

Name

The indicator name.

Source

The source that contained the indicator (the parent source).

Incidents

Information about any incidents associated with the indicator:

  • an icon specifying whether the incident is Partially or Fully realized

  • the number of incidents associated with the indicator

Action

The action associated with the indicator. For more information, see Edit TID Actions at the Source, Indicator, or Observable Level.

Indicators can inherit Action settings from a parent source, and observables can inherit Action settings from a parent indicator. For more information, see Inheritance in TID Configurations.

Publish

The publish setting for the indicator. For more information, see Pause or Publish TID Data at the Source, Indicator, or Observable Level.

Indicators can inherit Publish settings from a parent source, and observables can inherit Publish settings from a parent indicator. For more information, see Inheritance in TID Configurations.

Last Updated

The date and time TID last updated the indicator.

Status

The current status of the indicator:

  • Pending—TID is ingesting the indicator's observables.

  • Completed—TID successfully ingested all of the indicator's observables.

  • Completed With Errors—TID finished ingesting the indicator, but some observables are unsupported or invalid.

Indicator Details

The Indicator Details page displays indicator and observable data for an incident.

Table 15. Indicator Details Information

Field

Description

Name

The indicator name.

Description

The indicator description provided by the source.

Source

The source that contained the indicator.

Expires

The date and time the indicator will expire, based on the source's TTL value.

Action

The action associated with the indicator. For more information, see Edit TID Actions at the Source, Indicator, or Observable Level.

Indicators can inherit the Action setting from a parent source, and observables can inherit the Action setting from a parent indicator. For more information, see Inheritance in TID Configurations.

Publish

The publish setting for the indicator. For more information, see Pause or Publish TID Data at the Source, Indicator, or Observable Level.

Indicators can inherit the Publish setting from a parent source, and observables can inherit the Publish setting from a parent indicator. For more information, see Inheritance in TID Configurations.

Indicator Pattern

The observables and operators that form the indicator's pattern. Operators link the observables within the indicator. AND relationships are indicated with the AND operator. OR relationships are indicated with the OR operator or by a close grouping of several observables.

Optionally, click the Whitelist button to add an observable to the Do Not Block list. For more information, see About Adding TID Observables to the Do Not Block List.

View and Manage Observables

The Observables page displays all successfully ingested observables; see Observable Summary Information.

Before you begin

Procedure


Step 1

Choose Intelligence > Sources.

Step 2

Click Observables.

Step 3

View your current observables:

  • To filter the observables displayed on the page, click Filter (filter icon). For more information, see Filter TID Data in Table Views.

  • If the information in the Value column is cut off, hover over the value.

  • To view indicators that contain the observable, click the number in the Indicators column. The Incidents page opens with the observable value as the filter. For more information, see View and Manage Indicators.

Step 4

Manage your current observables:


Observable Summary Information

The Observables page displays summary information for all ingested observables.

Table 16. Observables Summary Information

Field

Description

Type

The type of observable data: SHA-256, Domain, URL, IPv4, or IPv6.

Value

The data that comprises the observable.

Indicators

The number of parent indicators containing the observable.

Action

The action configured for the observable. For more information, see Edit TID Actions at the Source, Indicator, or Observable Level.

Indicators can inherit Action settings from a parent source, and observables can inherit Action settings from a parent indicator. For more information, see Inheritance in TID Configurations.

Publish

The publish setting for the observable; see Pause or Publish TID Data at the Source, Indicator, or Observable Level.

Indicators can inherit Publish settings from a parent source, and observables can inherit Publish settings from a parent indicator. For more information, see Inheritance in TID Configurations.

Updated At

The date and time TID last updated the observable.

Expires

The date that the observable will be automatically purged from TID based on TTL for the parent indicator.

Whitelist button

Clicking this button adds the observable to the Do Not Block list; see About Adding TID Observables to the Do Not Block List.

Filter TID Data in Table Views

Procedure


Step 1

Choose one of the following TID table views:

  • Intelligence > Incidents

  • Intelligence > Sources

  • Intelligence > Sources > Indicators

  • Intelligence > Sources > Observables

Step 2

Click Filter (filter icon) and choose a filter attribute.

Step 3

Choose or enter a value for that filter attribute.

Filters are case-sensitive.

Step 4

(Optional) To filter by multiple attributes, click Filter (filter icon) and repeat Step 2 and Step 3.

Step 5

To cancel the changes you have made since you last applied the filter, click Cancel.

Step 6

Click Apply to refresh the table with the filter applied.

Step 7

To remove a filter attribute individually, click Remove (remove icon) next to the filter attribute and click Apply to refresh the table.


Inheritance in TID Configurations

When TID ingests intelligence data from a source, it creates indicators and observables as child objects of that source. On creation, these child objects inherit Action and Publish settings from the parent configuration.

An indicator inherits these settings from the parent source. An indicator can only have one parent source.

An observable inherits these settings from the parent indicator(s). An observable can have multiple parent indicators.

For more information, see:

Inheritance of TID Settings from Multiple Parents

If an observable has multiple parent indicators, the system compares the inherited settings from all the parents and assigns the most secure option to the observable. Thus:

  • Action: Block is more secure than Monitor

  • Publish: On is more secure than Off

For example, SourceA might contribute IndicatorA and related ObservableA:

Setting

SourceA

IndicatorA

ObservableA

Action

Block

Block

Block

Publish

Off

Off

Off

If SourceB later contributes IndicatorB, which also includes ObservableA, the system modifies ObservableA as follows:

Setting

SourceB

IndicatorB

ObservableA

Action

Monitor

Monitor

Block (inherited from IndicatorA)

Publish

On

On

On (inherited from IndicatorB)

In this example, ObservableA has two parents: one parent for its Action setting and one parent for its Publish setting. If you manually edit the settings for the observable and then revert the settings, the system sets the Action setting to the IndicatorA value and the Publish setting to the IndicatorB value.

About Overriding Inherited TID Settings

To override an inherited setting, change the setting at the child level; see Edit TID Actions at the Source, Indicator, or Observable Level and Pause or Publish TID Data at the Source, Indicator, or Observable Level. After you override an inherited setting, the child object retains that setting despite changes to the parent object(s).

For example, you might start with the following original settings, with no overrides set:

Setting

SourceA

IndicatorA

ObservableA1

ObservableA2

Publish

Off

Off

Off

Off

If you override the setting for IndicatorA, the settings would be the following:

Setting

SourceA

IndicatorA

ObservableA1

ObservableA2

Publish

Off

On

On

On

In this case, any changes to the Publish setting for SourceA no longer cascade automatically to IndicatorA. However, inheritance from IndicatorA to ObservableA1 and ObservableA2 continues, because the observable settings are not currently set to override values.

If you later override the setting for ObservableA1:

Setting

SourceA

IndicatorA

ObservableA1

ObservableA2

Publish

Off

On

Off

On

Any changes to the Publish setting for IndicatorA no longer cascade automatically to ObservableA1. However, those changes continue to cascade to ObservableA2, because it is not set to an override value.

At the observable level, you can revert from an override setting to the inherited setting, and the system resumes cascading setting changes automatically from the parent indicator to that observable.

Edit TID Actions at the Source, Indicator, or Observable Level

Note:

  • Editing the action for a parent sets the action for all children. If you edit the action at the source level, you set the action for all its indicators. If you edit the action at the indicator level, you set the action for all of its observables.

  • Editing the action for a child interrupts inheritance. If you edit the action at the indicator level, and subsequently edit it at the source level, the indicator's action is retained until you edit the action for the individual indicator. If you edit the action at the observable level, and subsequently edit it at the indicator level, the observable's action is retained until you edit the action for the individual observable. At the observable level, you can revert automatically to the parent indicator's action. For more information about inheritance, see Inheritance in TID Configurations.

You may also want to review other Factors That Affect the Action Taken.

Procedure


Step 1

Choose any of the following:

  • Intelligence > Sources

    Note


    TID does not support blocking TAXII sources at the source level. If the TAXII source contains a simple indicator, you can block at the indicator or observable level.

  • Intelligence > Sources > Indicators

    Note


    TID does not support blocking complex indicators. Instead, block individual observables within the complex indicator.

  • Intelligence > Sources > Observables

Step 2

Use the Action dropdown to choose Monitor Monitor (monitor icon) or Block Block (block icon).

Step 3

(Observables only) If you want to resume inheriting the action setting from the parent indicator, click Revert next to the Action setting for the observable.


About Pausing Publishing

  • If you pause publishing at the feature level, the system purges all TID observables stored on your elements. This means that TID cannot detect, monitor or block threats. Other security features on your system are not affected.

  • If you pause publishing at the source, indicator, or observable level, the system removes the paused TID observables from your elements, preventing them from matching traffic.

  • Pausing publication for a parent pauses all children. If you pause publishing at the source level, you pause publishing for all its indicators. If you pause publishing at the indicator level, you pause publishing for all of its observables.

  • Pausing publication for a child interrupts inheritance. If you pause publishing at the indicator level, and subsequently publish at the source level, publishing for the indicator remains paused until you change the individual setting for the indicator. If you pause publishing at the observable level, and subsequently publish at the indicator level, publishing for the observable remains paused until you change the individual setting for the observable. At the observable level, you can revert automatically to the parent indicator's publishing status. For more information about inheritance, see Inheritance in TID Configurations.

  • Publishing for Uploaded sources can only be paused at the indicator level.

  • For a comparison of pausing publishing for an observable vs adding the observable to the Do Not Block list, see About Adding TID Observables to the Do Not Block List.

  • If you have specified a publish/pause setting for an individual observable or indicator, source updates do not change that setting if the update contains the same observable or indicator.

  • Publishing can be disabled on the object management pages. See Modify the Observable Publication Frequency.

  • The option on the Sources page to pause updates is not related to publishing data to elements; it applies to updating sources on the Firepower Management Center from feeds.

Pause TID and Purge TID Data from Elements


Caution


This setting pauses publishing to all elements, purges all TID observables stored on your elements, and stops inspecting traffic using the TID feature.

To disable observables at a more granular level, see Pause or Publish TID Data at the Source, Indicator, or Observable Level.


Data on the management center (existing incidents and configured sources, indicators, and observables, and ingestion of sources) is not affected by this setting.

Procedure


Step 1

Choose Intelligence > Settings.

Step 2

Click Pause.


What to do next

When you are ready to resume synchronizing TID data on your elements and generating observations, manually Resume publishing from this page. Existing observables on the management center are published to all elements.

Pause or Publish TID Data at the Source, Indicator, or Observable Level

If publishing is enabled at the Source level, the system automatically publishes the initial source data and any subsequent changes including:

  • changes from periodic source refreshes

  • changes resulting from system action (for example, TTL expiration)

  • any user-initiated changes (for example, a change in the Action setting for an indicator or observable)


Note


To purge all TID observables at once from your devices (elements), see Pause TID and Purge TID Data from Elements.


Before you begin

Before pausing publishing, understand the ramifications described in About Pausing Publishing.

Procedure


Step 1

Choose any of the following:

  • Intelligence > Sources

  • Intelligence > Sources > Indicators

  • Intelligence > Sources > Observables

Step 2

Locate the Publish Slider (slider icon) and use it to toggle publishing to elements.

Step 3

(Observables only) If you want to resume inheriting the publication setting from the parent indicator, click Revert next to the Publish setting for the observable.


What to do next

  • Wait at least 10 minutes for elements to receive changes. Changes involving large sources will take longer.

  • (Optional) Change the publication frequency for TID data at the observable level; see Modify the Observable Publication Frequency.

Modify the Observable Publication Frequency

By default, the system publishes observables to TID elements every 5 minutes. Use this procedure to set this interval to a different value.

Before you begin

Procedure


Step 1

Choose Objects > Object Management.

Step 2

Choose Security Intelligence > Network Lists and Feeds.

Step 3

Click edit next to the Cisco-TID-Feed.

Step 4

Choose a value from the Update Frequency drop-down list:

  • Choose Disable to stop publication of observable data to elements.
  • Choose any other value to set the interval for observable publication.

Step 5

Click Save.


About Adding TID Observables to the Do Not Block List

If you want to exempt an observable in a simple indicator from the specified Action (let the traffic pass without monitoring or blocking), you can add the observable to a Do Not Block list.

In a complex indicator, TID ignores observables on the Do Not Block list when evaluating traffic, but other observables in that indicator are still evaluated. For example, if an indicator includes Observable 1 and Observable 2 linked by the AND operator, and you add Observable 1 to a Do Not Block list, TID generates a fully realized incident when Observable 2 is seen.

By comparison, in the same complex indicator, if you disable publishing of Observable 1 instead of adding it to the Do Not Block list, TID generates a partially-realized incident when Observable 2 is seen.


Note


If you add an observable to the Do Not Block list, this always takes precedence over the Action setting, whether the setting in the observable is an inherited or override value.


Source updates do not affect the Do Not Block list setting for individual observables if the update contains the same observable.

Add TID Observables to a Do Not Block List

For detailed information about using Do Not Block lists, see About Adding TID Observables to the Do Not Block List.


Tip


An "Add to Do Not Block List" button () can appear in several places in the web interface. You can add an observable to a Do Not Block list in any of those locations by clicking this button.


Procedure

Step 1

Click Intelligence > Sources > Observables.

Step 2

Navigate to the observable that you want to allow.

Step 3

Click (Whitelist) for that observable.


What to do next

(Optional) If you need to remove an observable from the Do Not Block list, click the button again.

View a STIX Source File

Procedure


Step 1

Select Intelligence > Sources > Indicators.

Step 2

Click the indicator name.

Step 3

Click Download STIX.

Step 4

Open the file in a text editor.


Troubleshoot Threat Intelligence Director

The sections below describe possible solutions and mitigations for common TID issues.

Fetching or uploading flat file sources generates an error

If the system fails to fetch or upload a flat file source, check that the data in the flat file matches the Type column on the Intelligence > Sources page.

TAXII or URL source update generates an error

If a TAXII or URL source update generates a source status error, check that your Server Certificate is not expired. If the certificate has expired, enter a new Server Certificate or delete the existing Server Certificate so TID can retrieve a new certificate. For more information, see Configure TLS/SSL Settings for a TID Source.

"Block" action is not available for an indicator or source, only "Monitor"

You can change the action for individual observables in the indicator or source.

TID table views return "No results"

Table views include the Sources, Indicators, Observables, and Incidents pages.

If you do not see data in one of the TID table views:

  • Check your table filter and consider expanding the time window for the Last Updated filter attribute; see Filter TID Data in Table Views.

  • Verify that you correctly configured your sources; see Options for Ingesting Data Sources.

  • Verify that you configured your access control policy and related policies to support TID; see Configure Policies to Support TID. For example, if your SHA-256 observables are not generating observations, verify that your deployed access control policy contains one or more access control rules that invoke a Malware Cloud Lookup or Block Malware file policy.

  • Verify that you deployed the TID-supporting access control policy and related policies to your elements; see Deploy Configuration Changes.

  • Verify that you did not pause TID data publication at the feature level; see Pause TID and Purge TID Data from Elements.

System is experiencing slowness or decreased performance

For more information about performance impact, see Performance Impact of Threat Intelligence Director.

Firepower Management Center table views do not show TID data

If you are publishing observables to your elements but no TID data appears in the connection, security intelligence, file, or malware events tables, check the access control and file policies deployed to your elements. For more information, see Configure Policies to Support TID.

One or more elements are overwhelmed by TID data

If TID data is overwhelming one or more of your devices, consider pausing TID publishing and purging the data stored on your elements. For more information, see Pause TID and Purge TID Data from Elements.

System is performing a Malware Cloud Lookup instead of a TID block

This is by design. For more information, see TID-Firepower Management Center Action Prioritization.

System is performing a Security Intelligence or DNS Policy action instead of a TID action

This is by design. For more information, see TID-Firepower Management Center Action Prioritization.

TID is disabled

  • Add memory to your appliance. Threat Intelligence Director can only be used on appliances with at least 15GB of memory.

  • Enable REST API access for the Firepower Management Center. For more information, see Enabling REST API Access.

The system does not generate the TID incident or take the TID action that you expected

One encounter with a particular threat generates multiple incidents

This can occur if a single indicator is included in multiple sources.

For details, see Handling of Duplicate Indicators.

History for Threat Intelligence Director

Feature

Version

Details

Threat Intelligence Director

6.2.2

Feature introduced: Lets you use threat intelligence from external sources to identify and process threats.

New screens: A new top-level Intelligence menu with multiple tabs.

Supported platforms: Firepower Management Center