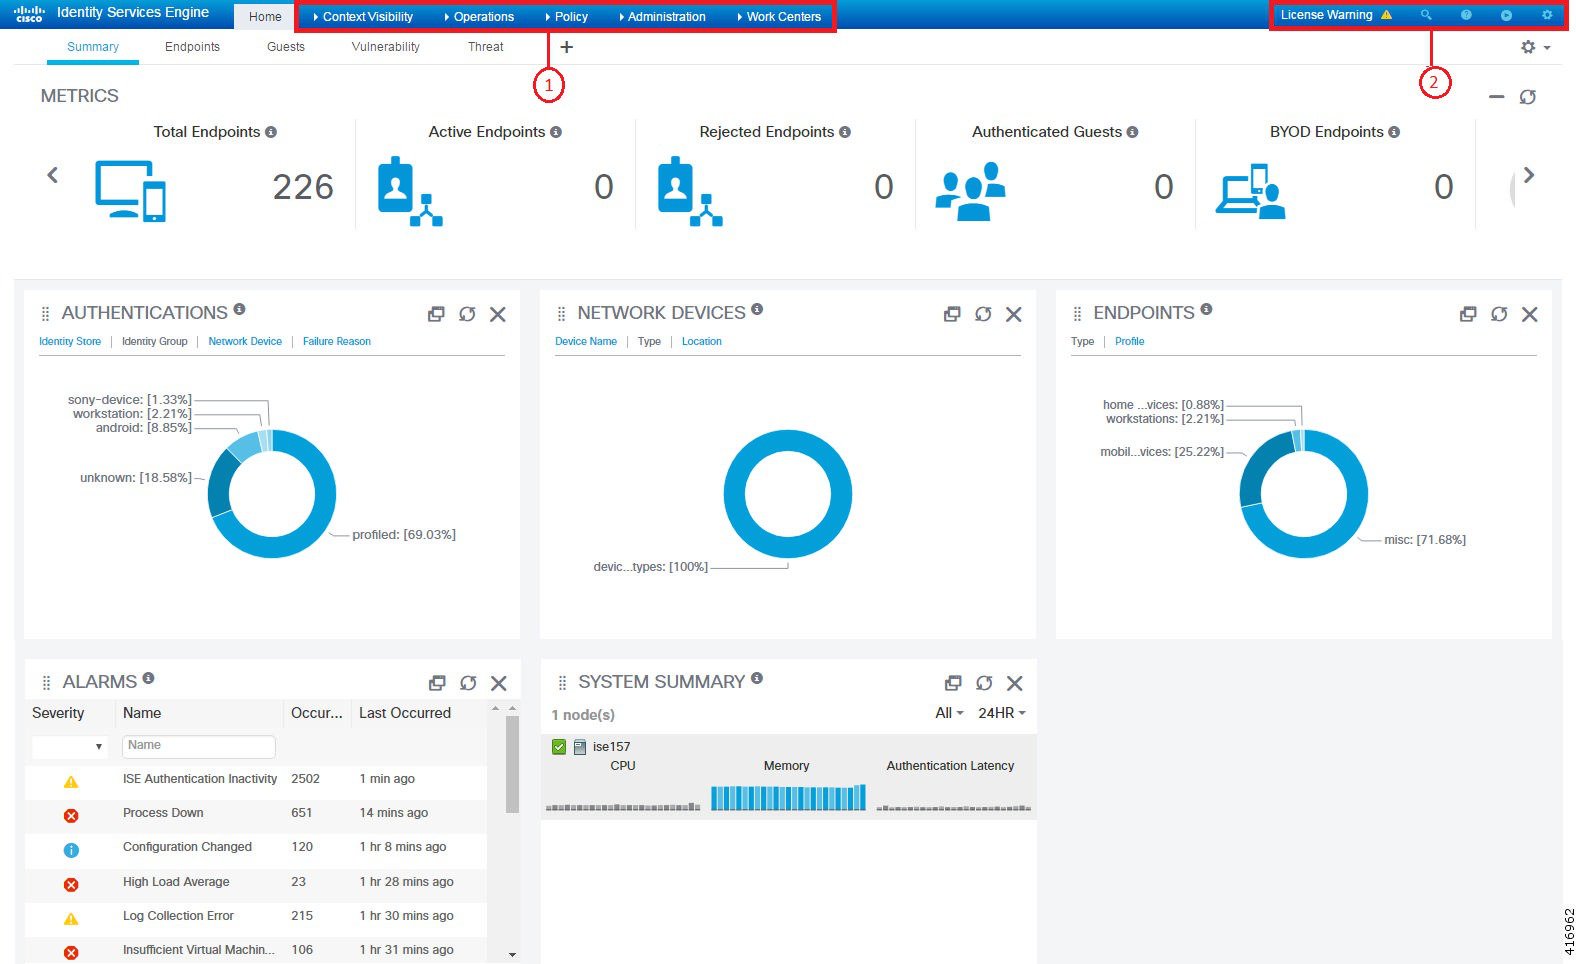
The structure of a Context Visibility window is similar to the home page, except that the Context Visibility windows:
You can view the context visibility data only from the primary PAN.
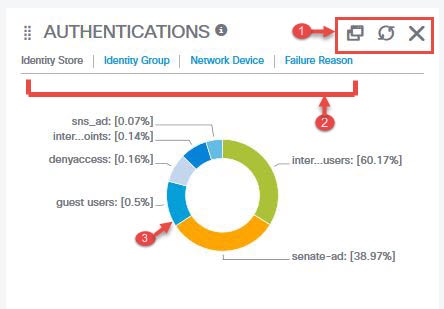
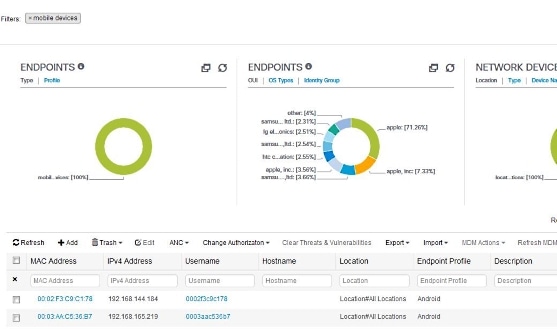
Dashlets on the Context Visibility windows show information about endpoints, and endpoint connections to NADs. The information currently displayed is based
on the content in the list of data below the dashlets on each window. Each window displays endpoint data, based on the name
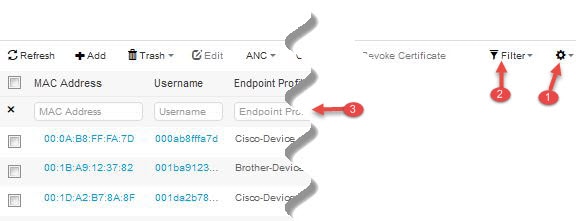
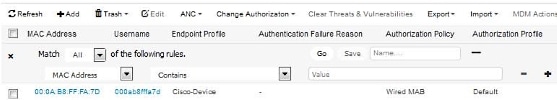
of the tab. As you filter the data, both the list and dashlets update. You can filter the data by clicking on parts of one
or more of the circular graphs, by filtering rows on the table, or any combination those actions. As you select filters, the
effects are additive, also referred to as cascading filter, which allows you to drill down to find the particular data you
are looking for. You can also click an endpoint in the list, and get a detailed view of that endpoint.
We recommend that you enable the accounting settings on the network access devices (NADs) to ensure that the accounting start
and update information is sent to Cisco ISE.
Cisco ISE can collect accounting information, such as the latest IP address, status of the session (Connected, Disconnected,
or Rejected), the number of days an endpoint has been inactive, only if accounting is enabled. This information is displayed
in the Live Logs, Live Sessions and Context Visibility windows in the Cisco ISE administration portal. When accounting is disabled on a NAD, there might be a missing, incorrect,
or mismatched accounting information between the Live Sessions, Live Logs and Context Visibility windows.
There are
four main views under Context Visibility:
-
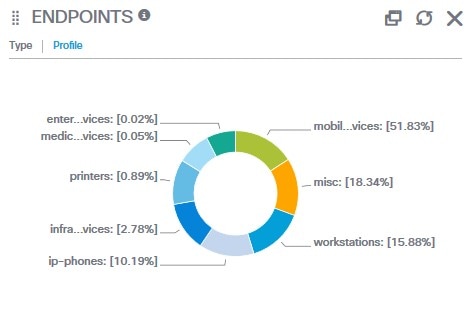
Endpoints: Filter the endpoints you want to view based on types of devices, compliance status, authentication type, hardware inventory, and more. See The Hardware Dashboard for additional information.

Note
|
The Visibility Setup workflow that is available on the Cisco ISE administration portal home page allows you to add a list of IP address ranges
for endpoints discovery. After this workflow is configured, Cisco ISE authenticates the endpoints, but the endpoints that
are not included in the configured IP address ranges are not displayed in the window and the Endpoints listing page ().
|
-
Users: Displays user-based information from user identity sources.
If there is a change in the username or password attribute, it reflects in the Users window when there is a change in the authentication status.
If the username is changed in the Microsoft Active Directory, the updated change is displayed in the Users window immediately after re-authentication.
If any other attributes such as Email, Phone, Department, etc are changed in the Microsoft Active Directory, the updated attributes
are displayed in the Users window 24 hours after re-authentication.
Note
|
Updating User Attributes from AD depends on the interval configured under Active Directory Probe. For more information, see
Active Directory Probe.
|
-
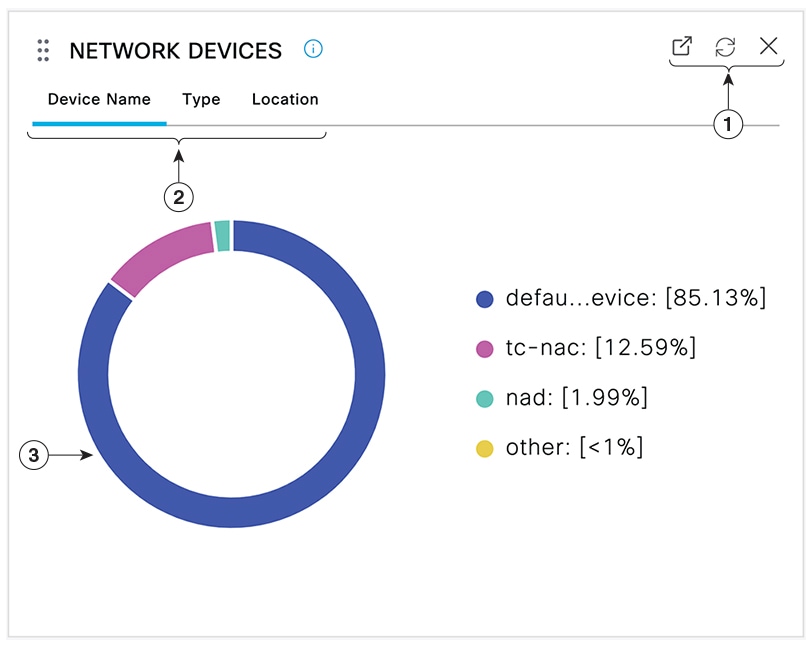
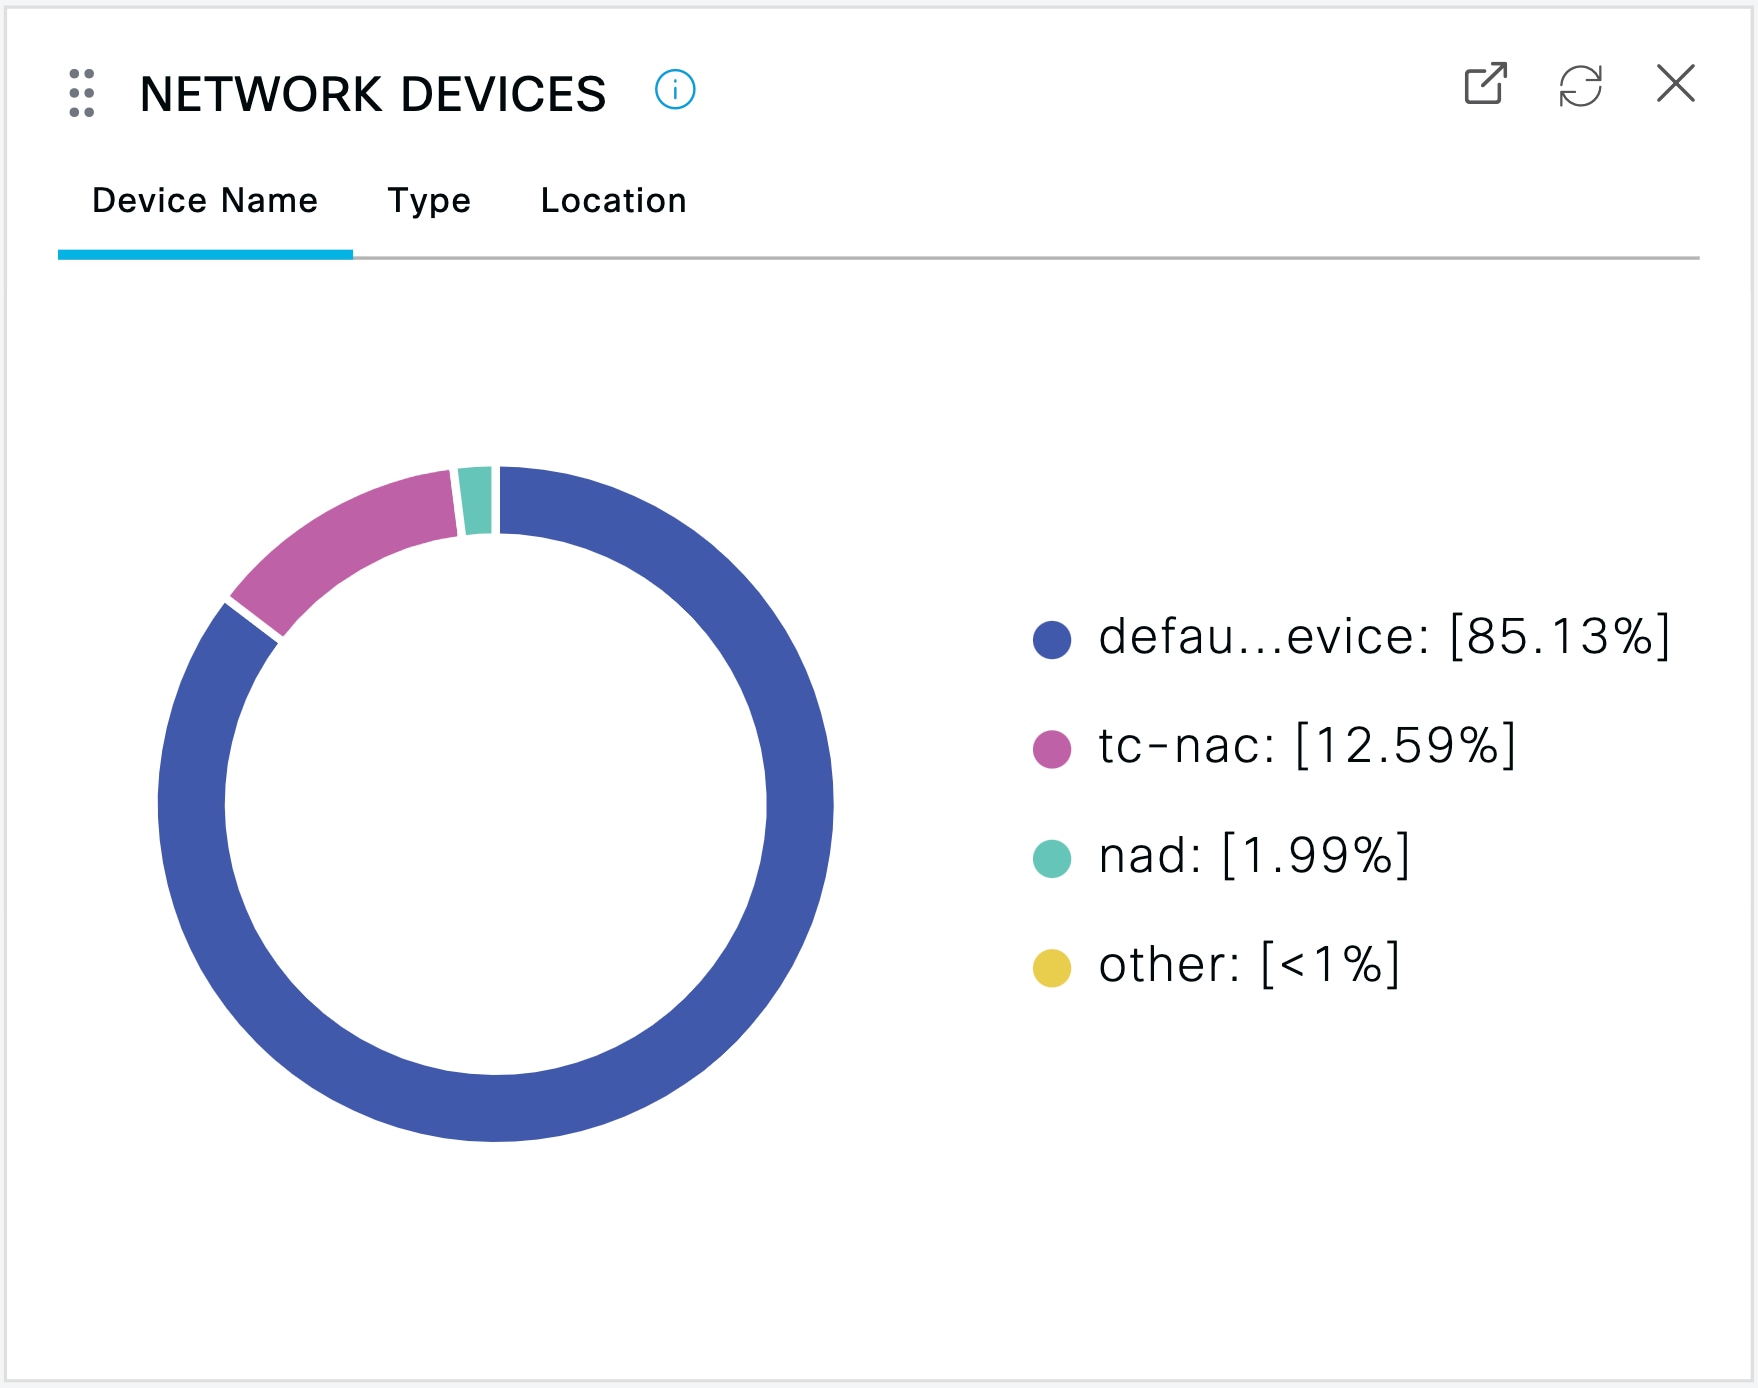
Network Devices: This window displays the list of NADs that have endpoints connected to them. For any NAD, click the number of endpoints
that is displayed in the corresponding # of endpoints column. A window that lists all the devices filtered by that NAD is displayed.
Note
|
If you have configured your network device with SNMPv3 parameters, you cannot generate the Network Device Session Status Summary report that is provided by the Cisco ISE monitoring service (). You can generate this report successfully if your network device is configured with SNMPv1 or SNMPv2c parameters.
|
-
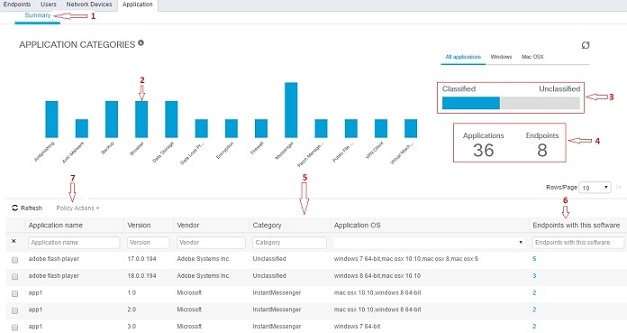
Application: Use this window to identify the number of endpoints that have a specific application installed. The results are displayed
in graphical and table formats. The graphical representation helps you make a comparative analysis. For example, you can find
out the number of endpoints with the Google Chrome software along with their Version, Vendor, and Category (Anti-phishing,
Browser, and so on) in a table as well as a bar chart. For more information, see The Application Tab.
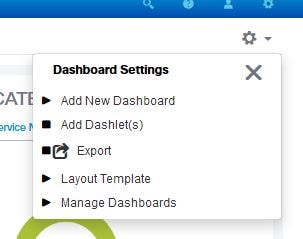
You can create a new tab in the Context Visibility windows and create a custom list for additional filtering. Dashlets are not supported in custom views.
Click a section of a circular graph in a dashlet to view a new window with filtered data from that dashlet in. From this new
window, you can continue to filter the displayed data, as described in Filtering Displayed Data in a View.
For more information about using Context Visibility windows to find endpoint data, see the following Cisco YouTube video https://www.youtube.com/watch?v=HvonGhrydfg.


 Feedback