Introduction

Overview

The new WxCCE Monitoring Dashboard (Logvisualizer Portal or LV portal) allows you to view the log of all the WxCCE components and solutions. The following sections describe how one can access and use the portal. The portal can be used by both tenants and partners.

As a partner or tenant, you can:

  • Access the LV portal and view all the pages.

  • Collect the following logs for Unified CCE Components

  • Call error logs and call detail logs

  • Call Detail Records (CDR) and Call management records (CMR)

  • Agent device status

  • Log for a device or appliance instance within two specific times

  • Log within predefined time ranges

  • View the scheduled maintenance activities.

  • View the Windows event messages

  • Subscribe to receive event notifications via Email

As a customer you can:

  • View the scheduled maintenance activities.

  • View the Windows event messages

  • Subscribe to receive event notifications via Email

Note The LV Portal can only be accessed and used by customers and partners. Users with supervisor or agent roles cannot access this portal.
Access the WxCCE Monitoring Dashboard

To access the WxCCE Monitoring Dashboard (or LV Portal):

Procedure


Step 1

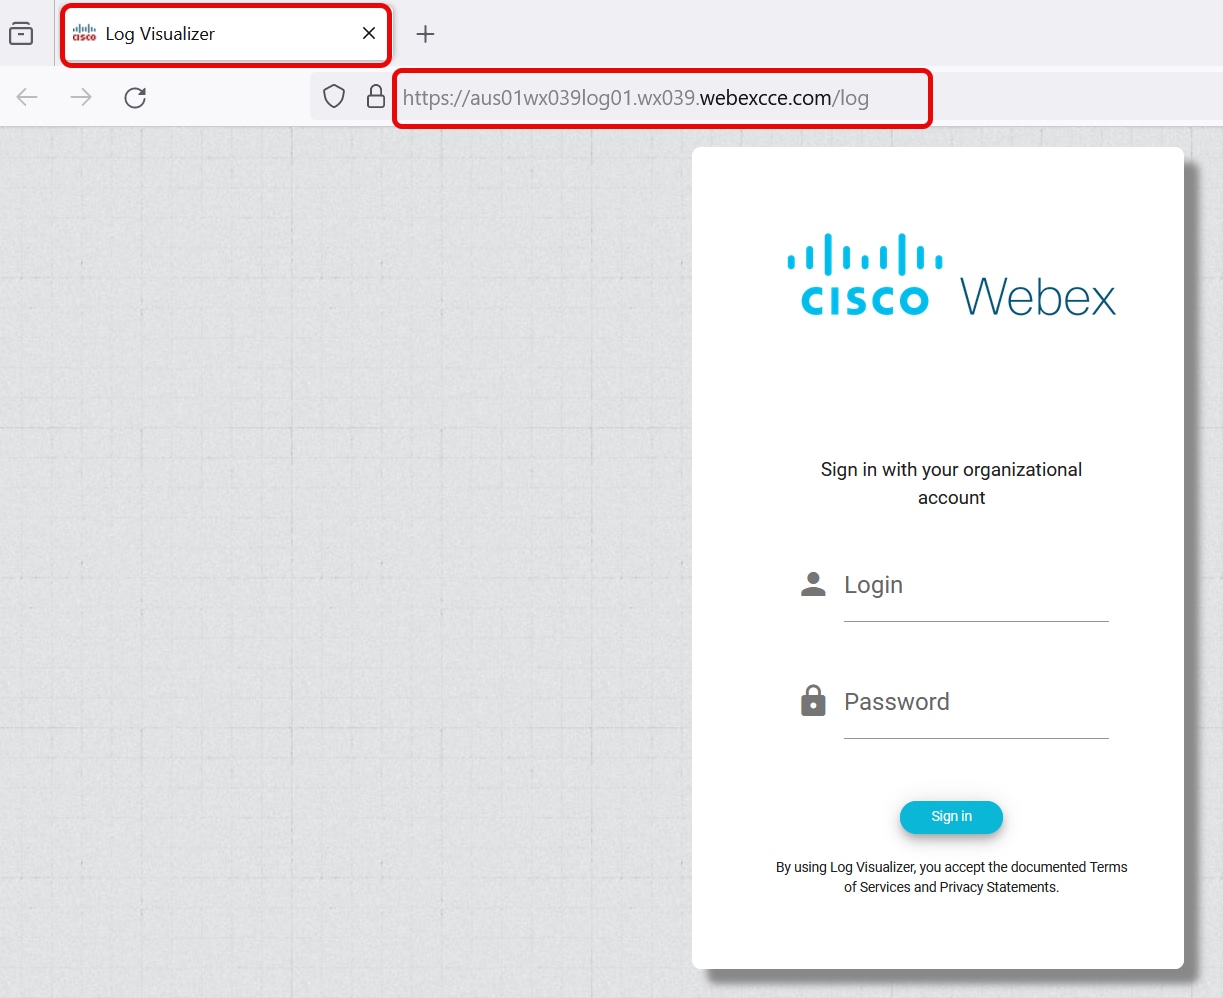
Concoct the LV Portal URL. The format of the URL is as follows:

Example:

https://<xxx>01wx<nnn>log01.wx<nnn>.webexcce.com/

In the preceding URL, replace xxx with the data center site ID. For example, AUS for Austin, DEN for Denver, TYK for Tokyo and so on. Similarly, replace nnn with the three-digit tenant ID (customer tenant number such as wx039).

Examples URLs:

 
https://aus01wx039log01.wx039.webexcce.com/

Step 2

Enter the LV portal in the address bar of your browser.

Step 3

Enter the domain login credentials to log into LV portal.

Figure 1. LV Portal Login Page

Note


You are not required to append the domain name to the username.


Get to Know the Monitoring Dashboard User Interface

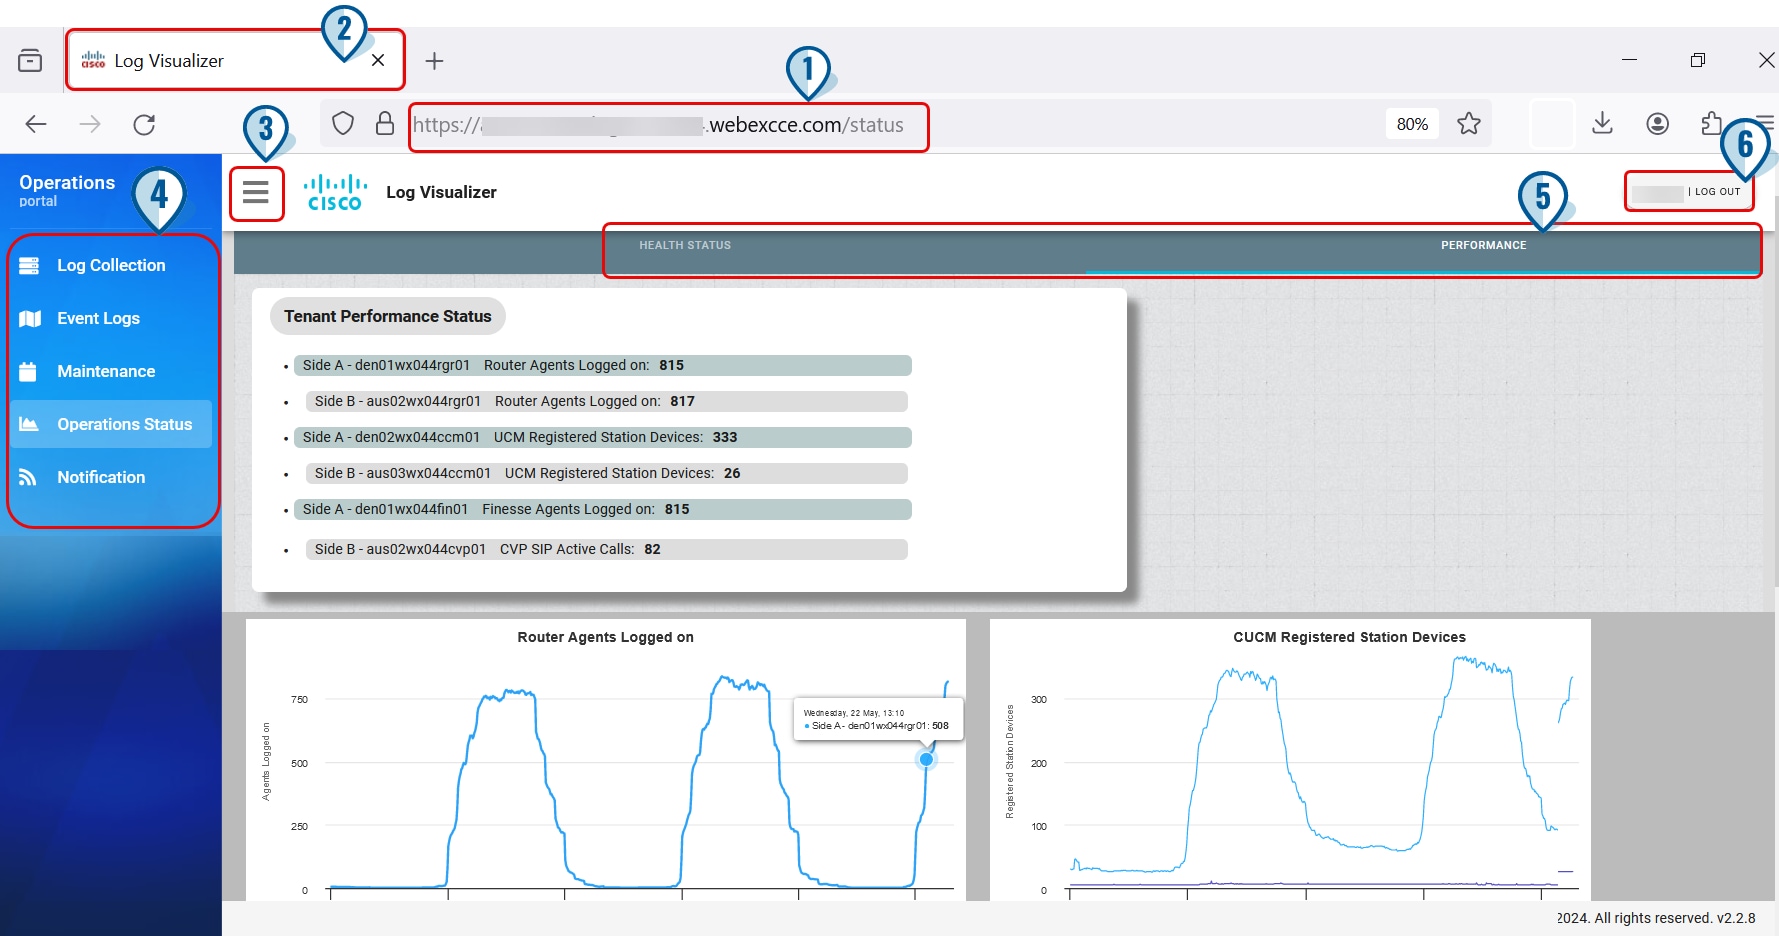
The WxCCE Monitoring Dashboard (or LV Portal) interface provides the following options (each option below is denoted by or corresponds to the number stamps in the below image):

  1. The browser shows the URL of the LV Portal in the address bar.

  2. After a successful login, the LV Portal opens.

  3. On the left side of the LV Portal interface, you will find a menu that is displayed when you click on the Hamburger ( ) icon. This menu lists all the available pages for collecting logs, viewing event logs, scheduling maintenance activities, checking operation status, and subscribing to receive event notifications via email.

  4. Each page features tabs that vary depending on your menu selection. The selected tab is highlighted with a blue line at the bottom to indicate the active section.

  5. In the upper right corner of the LV portal, you will find your username and the logout option.

Figure 2. Monitoring Dashboard Interface