Monitoring Dashboard API Endpoints
To log into the Monitoring Dashboard (Logvisualizer or LV) API portal:
Before you begin
Create a Cisco Webex CCE service request to get the service account credentials for API access.
Procedure
|
Step 1 |
Form the Monitoring Dashboard (LV Portal) URL. The format of the URL is as follows: Example:In the preceding URL, replace xxx with the data center site ID. For example, AUS for Austin. Similarly, replace nnn with the three-digit tenant ID. The port number is always 8445. |
|
Step 2 |
Enter the LV portal in the address bar of your browser. |
|
Step 3 |
When prompted to enter the credentials, enter the API service account credential to access the specific API endpoint. The LV API Portal is displayed as shown in the below image: 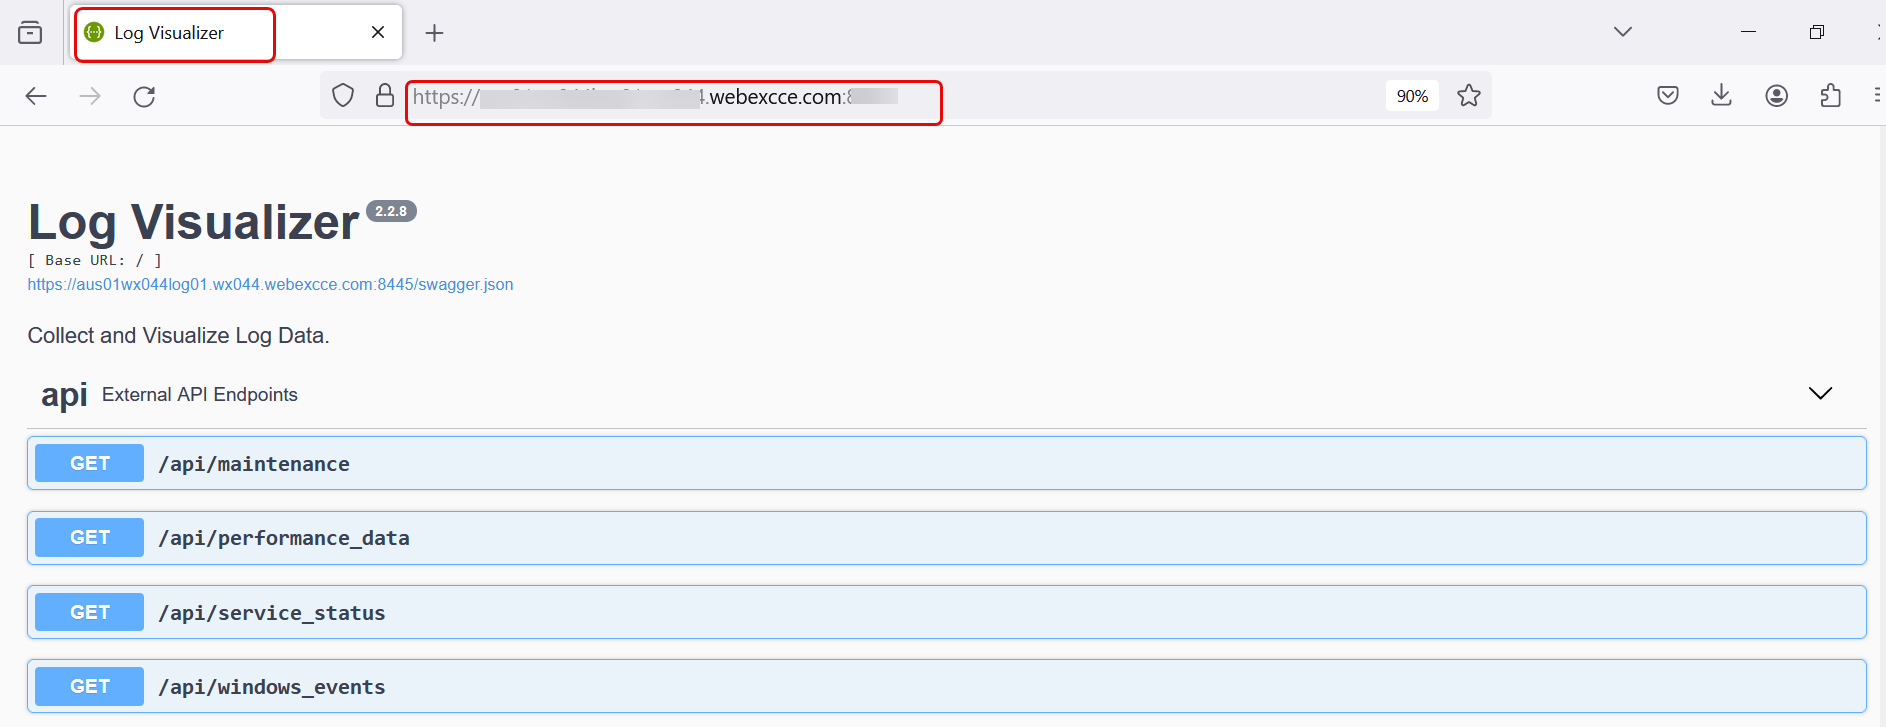
|
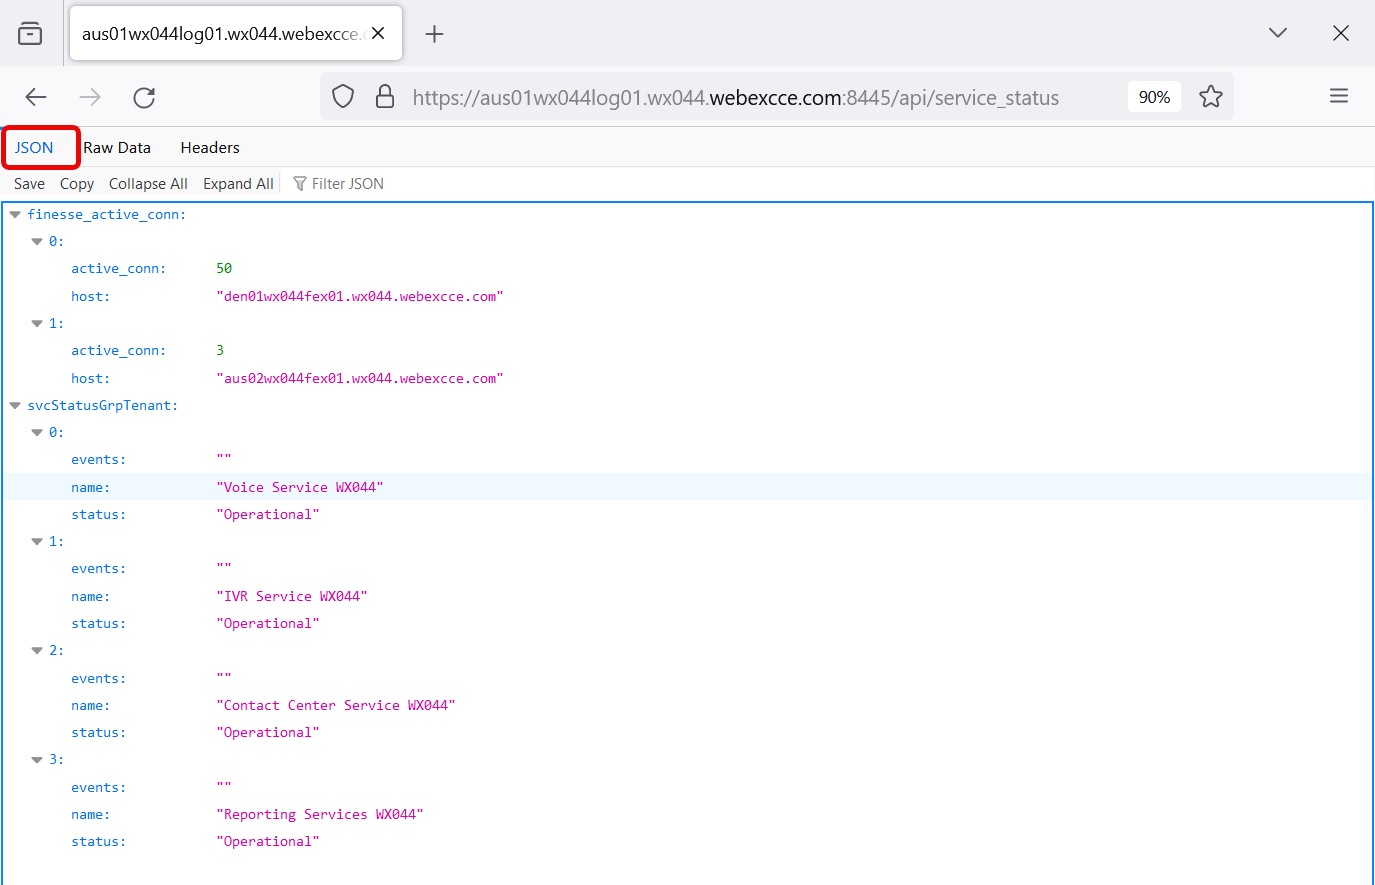
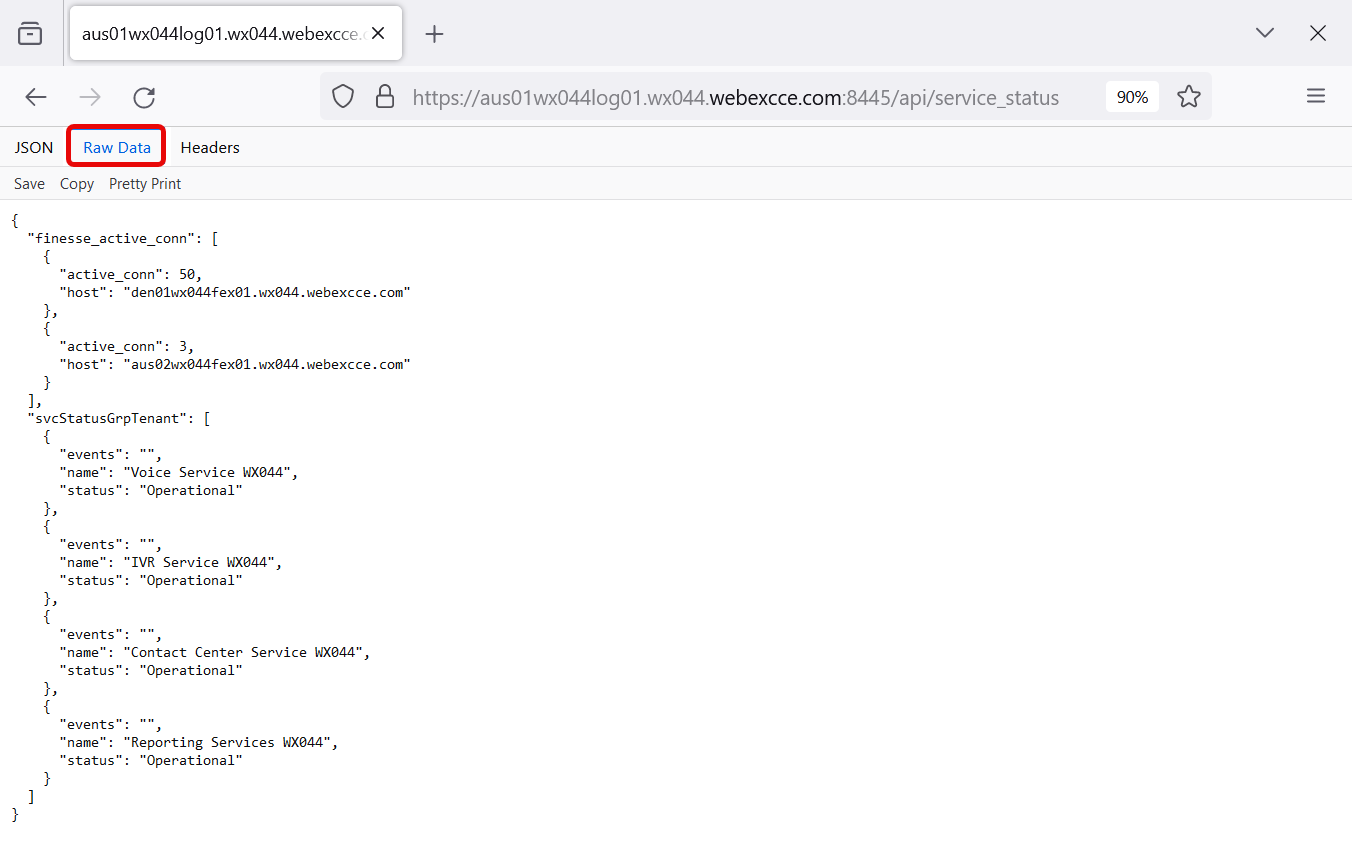
The following images show sample payload results of the following GET API call: https://aus01wx038log1a.wx038.webexcce.com:8445/api/service_statusThe results contain data on svcStatusGrpTenant and finesse_active_conn (if applicable).
 Feedback