- Preface
- Overview
- Adding and Deleting Location Servers
- Synchronizing Location Servers with Cisco Wireless LAN Controllers and Cisco WCS
- Editing Location Server Properties
- Managing Location Server Users and Groups
- Configuring Event Notifications
- Location Planning and Verification
- Monitoring Location Servers and Site
- Performing Maintenance Operations
- Index
- Deployment Planning for Data, Voice, and Location
- Creating and Applying Calibration Models
- Inspecting Location Readiness and Quality
- Verifying Location Accuracy
- Using Chokepoints to Enhance Tag Location Reporting
- Using Location Optimized Monitor Mode to Enhance Tag Location Reporting
- Enabling Location Presence on a Location Server
Location Planning and Verification
This chapter describes how to plan access point deployment based on applications employed.
You can check the ability of an existing access point deployment to estimate the true location of an element within 10 meters at least 90% of the time using a location readiness calculation based on the number and placement of access points.
Details on using calibration data to examine location quality, as an alternative to using the location readiness calculation, are also described.
Additionally, details on analyzing the location accuracy of non-rogue and rogue clients and asset tags using testpoints on an area or floor map; and, using chokepoints to enhance location accuracy for tags are described.
This chapter contains the following sections:
•![]() "Deployment Planning for Data, Voice, and Location" section
"Deployment Planning for Data, Voice, and Location" section
•![]() "Creating and Applying Calibration Models" section
"Creating and Applying Calibration Models" section
•![]() "Inspecting Location Readiness and Quality" section
"Inspecting Location Readiness and Quality" section
•![]() "Verifying Location Accuracy" section
"Verifying Location Accuracy" section
•![]() "Using Chokepoints to Enhance Tag Location Reporting" section
"Using Chokepoints to Enhance Tag Location Reporting" section
•![]() "Using Location Optimized Monitor Mode to Enhance Tag Location Reporting" section
"Using Location Optimized Monitor Mode to Enhance Tag Location Reporting" section
•![]() "Enabling Location Presence on a Location Server" section
"Enabling Location Presence on a Location Server" section
Deployment Planning for Data, Voice, and Location
You can calculate the recommended number and location of access points based on whether data and/or voice traffic and/or location will be active.
To calculate recommended number and placement of access points for a given deployment, follow these steps:
Step 1 ![]() In Cisco WCS, choose Monitor > Maps.
In Cisco WCS, choose Monitor > Maps.
Step 2 ![]() Click on the appropriate location link from the list that displays.
Click on the appropriate location link from the list that displays.
A map appears showing placement of all installed elements (access points, clients, tags) and their relative signal strength.
Step 3 ![]() Select Planning Mode from the Select a command menu found at the top-right of the window. Click GO.
Select Planning Mode from the Select a command menu found at the top-right of the window. Click GO.
A color-coded map summarizing contributing access points appears.
Step 4 ![]() Click Add APs to open a window to enter data necessary to calculate the recommended number of access points.
Click Add APs to open a window to enter data necessary to calculate the recommended number of access points.
Step 5 ![]() In the window that appears, drag the dashed rectangle over the map location for which you want to calculate the recommended access points.
In the window that appears, drag the dashed rectangle over the map location for which you want to calculate the recommended access points.

Note ![]() Adjust the size or placement of the rectangle by selecting the edge of the rectangle and holding down the Ctrl key. Move the mouse as necessary to outline the targeted location.
Adjust the size or placement of the rectangle by selecting the edge of the rectangle and holding down the Ctrl key. Move the mouse as necessary to outline the targeted location.
Step 6 ![]() Check the check box next to the service that will be used on the floor. Options are Data/Coverage (default), Voice, Location and Location with Monitor Mode APs. Click Calculate.
Check the check box next to the service that will be used on the floor. Options are Data/Coverage (default), Voice, Location and Location with Monitor Mode APs. Click Calculate.
The recommended number of access points given the services requested appears.

Note ![]() Each service option is inclusive of all services that are listed above it. For example, if you check the Location box, the calculation will consider data/coverage, voice and location in determining the optimum number of access points required.
Each service option is inclusive of all services that are listed above it. For example, if you check the Location box, the calculation will consider data/coverage, voice and location in determining the optimum number of access points required.

Note ![]() Recommended calculations assume the need for consistently strong signals. In some cases, fewer access points may be required than recommended.
Recommended calculations assume the need for consistently strong signals. In some cases, fewer access points may be required than recommended.
Step 7 ![]() Click Apply to generate a map based on the recommendations to see recommended placement of the access points in the selected area.
Click Apply to generate a map based on the recommendations to see recommended placement of the access points in the selected area.

Note ![]() Check the Location services option to ensure that the recommended access points will provide the true location of an element within 10 meters at least 90% of the time.
Check the Location services option to ensure that the recommended access points will provide the true location of an element within 10 meters at least 90% of the time.
Creating and Applying Calibration Models
If the provided RF models do not sufficiently characterize the floor layout, you can create a calibration model that is applied to the floor and better represents the attenuation characteristics of that floor. In environments in which many floors share common attenuation characteristics (such as in a library), one calibration model can be created and then applied to floors with the same physical layout and same deployment.
The calibration models are used as RF overlays with measured RF signal characteristics that can be applied to different floor areas. This enables the Cisco WLAN solution installation team to lay out one floor in a multi-floor area, use the RF calibration tool to measure, save the RF characteristics of that floor as a new calibration model, and apply that calibration model to all the other floors with the same physical layout.
You can collect data for a calibration using one of two methods:
•![]() Data point collection-Calibration points are selected and their coverage area is calculated one location at a time.
Data point collection-Calibration points are selected and their coverage area is calculated one location at a time.
•![]() Linear point collection-A series of linear paths are selected and then calculated as you traverse the path. This approach is generally faster than the data point collection. You can also employ data point collection to augment data collection for locations missed by the linear paths.
Linear point collection-A series of linear paths are selected and then calculated as you traverse the path. This approach is generally faster than the data point collection. You can also employ data point collection to augment data collection for locations missed by the linear paths.

Note ![]() A client device that supports both 802.11a/n and 802.11b/g/n radios is recommended to expedite the calibration process for both spectrums.
A client device that supports both 802.11a/n and 802.11b/g/n radios is recommended to expedite the calibration process for both spectrums.
Use a laptop or other wireless device to open a browser to the WCS server and perform the calibration process.
To create and apply calibration models, follow these steps:
Step 1 ![]() Navigate to Monitor > Maps and choose RF Calibration Models from the Select a command drop-down menu. Click GO.
Navigate to Monitor > Maps and choose RF Calibration Models from the Select a command drop-down menu. Click GO.
Step 2 ![]() Choose Create New Model from the Select a command drop-down menu in the upper right. Click GO.
Choose Create New Model from the Select a command drop-down menu in the upper right. Click GO.
Step 3 ![]() Assign a name to the model and click OK.
Assign a name to the model and click OK.
Step 4 ![]() The new model appears along with the other RF calibration models, but its status is listed as Not Yet Calibrated. To start the calibration process, click on the hyperlink associated with the new model name. A new window appears which indicates the details of the new model. In the upper right-hand corner, choose Add Data Points from the Select a command drop-down menu and click GO.
The new model appears along with the other RF calibration models, but its status is listed as Not Yet Calibrated. To start the calibration process, click on the hyperlink associated with the new model name. A new window appears which indicates the details of the new model. In the upper right-hand corner, choose Add Data Points from the Select a command drop-down menu and click GO.
Step 5 ![]() If this process is being performed from a mobile device connected to WCS through the Cisco Centralized architecture, the MAC address field is automatically populated with the device's address. Otherwise, you can manually enter the MAC address of the device being used to perform the calibration. MAC addresses that are manually entered must be delimited with colons (such as FF:FF:FF:FF:FF:FF).
If this process is being performed from a mobile device connected to WCS through the Cisco Centralized architecture, the MAC address field is automatically populated with the device's address. Otherwise, you can manually enter the MAC address of the device being used to perform the calibration. MAC addresses that are manually entered must be delimited with colons (such as FF:FF:FF:FF:FF:FF).
Step 6 ![]() Choose the appropriate campus, building, and floor where the calibration is performed (see Figure 7-1). Click Next.
Choose the appropriate campus, building, and floor where the calibration is performed (see Figure 7-1). Click Next.
Figure 7-1 Starting to Calibrate

Step 7 ![]() When the chosen floor map and access point locations display, a grid of plus marks (+) indicates the locations where data collection for calibration is performed.
When the chosen floor map and access point locations display, a grid of plus marks (+) indicates the locations where data collection for calibration is performed.
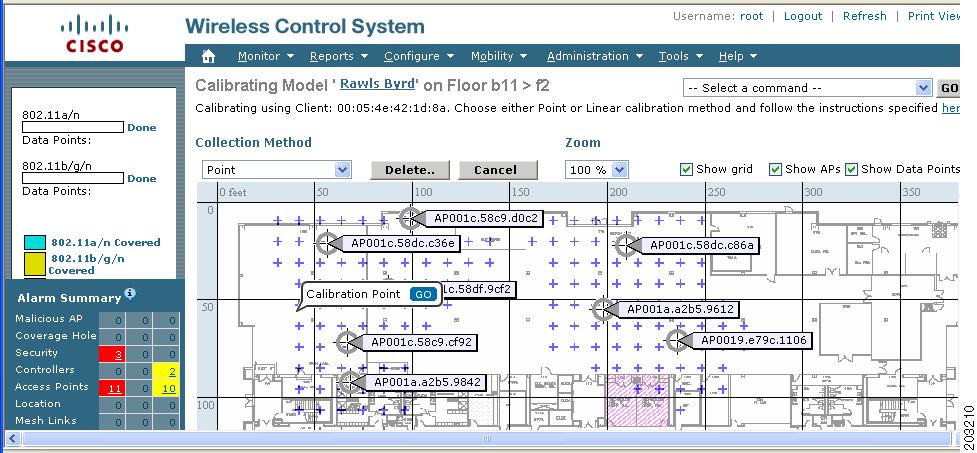
Using these locations as guidelines, you can perform either a point or linear collection of data by appropriate placement of either the Calibration Point pop-up (point) or the Start and Finish pop-ups (linear) that display on the map when the respective options are displayed. Figure 7-2 shows the starting window for a point calibration.
Figure 7-2 Positioning Calibration Points
a. ![]() If you want to do a point collection of data for the calibration, do the following:
If you want to do a point collection of data for the calibration, do the following:
1. ![]() Select Point from the Collection Method drop-down menu and check the Show Data points check box if not already checked. A calibration point pop-up displays on the map.
Select Point from the Collection Method drop-down menu and check the Show Data points check box if not already checked. A calibration point pop-up displays on the map.
2. ![]() Position the tip of the calibration point pop-up at a data point (+) and click GO. A panel appears showing the progress of the data collection.
Position the tip of the calibration point pop-up at a data point (+) and click GO. A panel appears showing the progress of the data collection.

Note ![]() Rotate the calibrating client laptop during data collection so that the client is heard evenly by all access points in the vicinity.
Rotate the calibrating client laptop during data collection so that the client is heard evenly by all access points in the vicinity.
3. ![]() When the data collection is complete for a selected data point and the coverage area is plotted on the map, move the calibration point pop-up to another data point and click GO.
When the data collection is complete for a selected data point and the coverage area is plotted on the map, move the calibration point pop-up to another data point and click GO.

Note ![]() The coverage area plotted on the map is color-coded and corresponds with the specific wireless LAN standard used to collect that data. Information on color-coding is provided in legend on the left-hand side of the window. Additionally, the progress of the calibration process is indicated by two status bars above the legend, one for 802.11a/n and one for 802.11b/g/n.
The coverage area plotted on the map is color-coded and corresponds with the specific wireless LAN standard used to collect that data. Information on color-coding is provided in legend on the left-hand side of the window. Additionally, the progress of the calibration process is indicated by two status bars above the legend, one for 802.11a/n and one for 802.11b/g/n.

Note ![]() To delete data points for locations selected in error, click Delete and move the black square that appears over the appropriate data points. Resize the square as necessary by pressing Ctrl and moving the mouse.
To delete data points for locations selected in error, click Delete and move the black square that appears over the appropriate data points. Resize the square as necessary by pressing Ctrl and moving the mouse.
4. ![]() Repeat steps a1 to a3 until the calibrations status bar of the relevant spectrums (802.11a/n, 802.11b/g/n) display as `done.' b/g/n) display as `done.'
Repeat steps a1 to a3 until the calibrations status bar of the relevant spectrums (802.11a/n, 802.11b/g/n) display as `done.' b/g/n) display as `done.'

Note ![]() The calibration status bar indicates data collection for the calibration as done, after roughly 50 distinct locations and 150 measurements have been gathered. For every location point saved in the calibration process, more than one data point is gathered. The progress of the calibration process is indicated by two status bars above the legend, one for 802.11b/g/n and one for 802.11a/n.
The calibration status bar indicates data collection for the calibration as done, after roughly 50 distinct locations and 150 measurements have been gathered. For every location point saved in the calibration process, more than one data point is gathered. The progress of the calibration process is indicated by two status bars above the legend, one for 802.11b/g/n and one for 802.11a/n.
b. ![]() If you want to do a linear collection of data for the calibration, do the following:
If you want to do a linear collection of data for the calibration, do the following:
1. ![]() Select Linear from the Collection Method drop-down menu and check the Show Data points check box if not already checked. A line appears on the map with both Start and Finish pop-ups.
Select Linear from the Collection Method drop-down menu and check the Show Data points check box if not already checked. A line appears on the map with both Start and Finish pop-ups.
2. ![]() Position the tip of the Start pop-up at the starting data point.
Position the tip of the Start pop-up at the starting data point.
3. ![]() Position the Finish pop-up at the ending data point.
Position the Finish pop-up at the ending data point.
4. ![]() Position yourself with your laptop at the starting data point and click GO. Walk steadily towards the end point along the defined path. A panel displays to show that data collection is in process.
Position yourself with your laptop at the starting data point and click GO. Walk steadily towards the end point along the defined path. A panel displays to show that data collection is in process.

Note ![]() Do not stop data collection until you reach the end point even if the data collection bar indicates completion.
Do not stop data collection until you reach the end point even if the data collection bar indicates completion.
5. ![]() Press the space bar (or Done on the data collection panel) when you reach the end point. The collection panel displays the number of samples taken before it closes to reveal the map. The map displays all the coverage areas where data was collected. (see Figure 7-3).
Press the space bar (or Done on the data collection panel) when you reach the end point. The collection panel displays the number of samples taken before it closes to reveal the map. The map displays all the coverage areas where data was collected. (see Figure 7-3).

Note ![]() To delete data points for locations selected in error, click Delete and move the black square that appears over the appropriate data points. Resize the square as necessary by pressing the Ctrl and moving the mouse.
To delete data points for locations selected in error, click Delete and move the black square that appears over the appropriate data points. Resize the square as necessary by pressing the Ctrl and moving the mouse.
Figure 7-3 Linear Data Collection
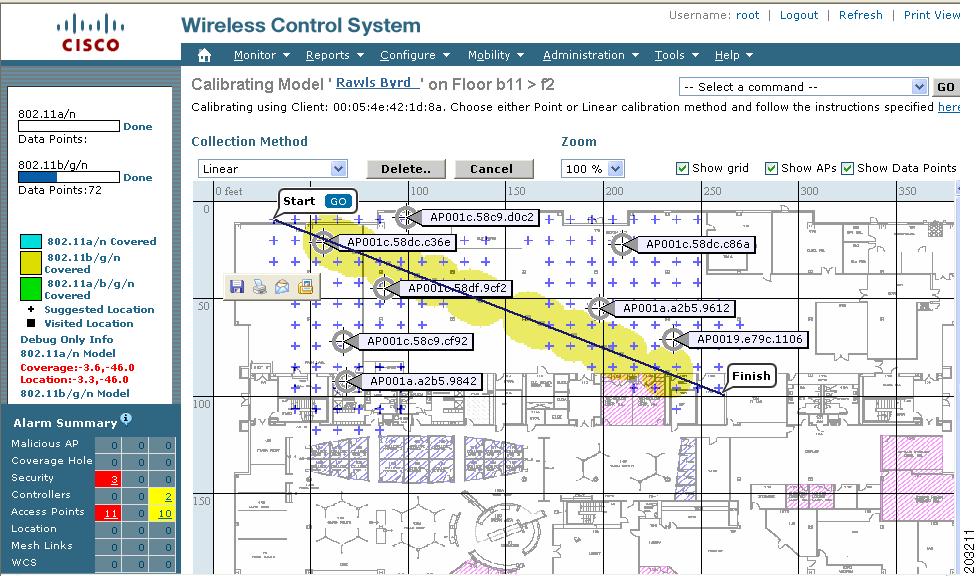

Note ![]() The coverage area is color-coded and corresponds with the specific wireless LAN standard used to collect that data. Information on color-coding is provided in legend on the left-hand side of the window.
The coverage area is color-coded and corresponds with the specific wireless LAN standard used to collect that data. Information on color-coding is provided in legend on the left-hand side of the window.
6. ![]() Repeat steps b2 to b5 until the status bar for the respective spectrum is filled in (done).
Repeat steps b2 to b5 until the status bar for the respective spectrum is filled in (done).

Note ![]() You can augment linear collection with data point collection to address missed coverage areas.
You can augment linear collection with data point collection to address missed coverage areas.
Step 8 ![]() Click on the name of the calibration model at the top of the window to return to the main screen for that model to calibrate the data points.
Click on the name of the calibration model at the top of the window to return to the main screen for that model to calibrate the data points.
Step 9 ![]() Select Calibrate from the Select a command drop-down menu and click GO.
Select Calibrate from the Select a command drop-down menu and click GO.
Step 10 ![]() Click the Inspect Location Quality link when calibration completes. A map displays showing RSSI readings displays.
Click the Inspect Location Quality link when calibration completes. A map displays showing RSSI readings displays.
Step 11 ![]() To use the newly created calibration model, you must apply the model to the floor on which it was created (and on any other floors with similar attenuation characteristics as well). Navigate to Monitor > Maps and find the specific floor to which the model is applied. At the floor map interface, choose Edit Floor Area from the drop-down menu and click GO.
To use the newly created calibration model, you must apply the model to the floor on which it was created (and on any other floors with similar attenuation characteristics as well). Navigate to Monitor > Maps and find the specific floor to which the model is applied. At the floor map interface, choose Edit Floor Area from the drop-down menu and click GO.
Step 12 ![]() From the Floor Type (RF Model) drop-down menu, choose the newly created calibration model. Click OK to apply the model to the floor.
From the Floor Type (RF Model) drop-down menu, choose the newly created calibration model. Click OK to apply the model to the floor.

Note ![]() This process can be repeated for as many models and floors as needed. After a model is applied to a floor, all location determination performed on that floor is done using the specific collected attenuation data from the calibration model.
This process can be repeated for as many models and floors as needed. After a model is applied to a floor, all location determination performed on that floor is done using the specific collected attenuation data from the calibration model.
Inspecting Location Readiness and Quality
You can configure Cisco WCS to verify the ability of the existing access point deployment to estimate the true location of an element within 10 meters at least 90% of the time. The location readiness calculation is based on the number and placement of access points.
You can also check the location quality and the ability of a given location to meet the location specification (10 m, 90%) based on data points gathered during a physical inspection and calibration.
Inspecting Location Readiness Using Access Point Data
To inspect location readiness using access point data, follow these steps:
Step 1 ![]() In Cisco WCS, choose Monitor > Maps.
In Cisco WCS, choose Monitor > Maps.
Step 2 ![]() Click on the appropriate floor location link from the list that displays.
Click on the appropriate floor location link from the list that displays.
A map displays showing placement of all installed elements (access points, clients, tags) and their relative signal strength.

Note ![]() If RSSI is not displayed, you can enable AP Heatmaps under the Layer menu (top-left).
If RSSI is not displayed, you can enable AP Heatmaps under the Layer menu (top-left).
Step 3 ![]() Select Inspect Location Readiness from the Select a command menu found at the top-right of the window. Click GO.
Select Inspect Location Readiness from the Select a command menu found at the top-right of the window. Click GO.
A color-coded map appears showing those areas that do (Yes) and do not (No) meet the 10 meter, 90% location specification.
Inspecting Location Quality Using Calibration Data
After completing a calibration model based on data points generated during a physical tour of the area, you can inspect the location quality of the access points. To inspect location quality based on calibration, follow these steps:
Step 1 ![]() In Cisco WCS, choose Monitor > Maps.
In Cisco WCS, choose Monitor > Maps.
Step 2 ![]() Choose RF Calibration Model from the menu found at the top-right of the window. Click GO.
Choose RF Calibration Model from the menu found at the top-right of the window. Click GO.
A list of calibration models appears.
Step 3 ![]() Click the appropriate calibration model.
Click the appropriate calibration model.
Details on the calibration including date of last calibration, number of data points by signal type (802.11a, 802.11 b/g) used in the calibration, location, and coverage are displayed.
Step 4 ![]() At the same window, click the Inspect Location Quality link found under the Calibration Floors heading.
At the same window, click the Inspect Location Quality link found under the Calibration Floors heading.
A color-coded map noting percentage of location errors appears.

Note ![]() You can modify the distance selected to see the effect on the location errors.
You can modify the distance selected to see the effect on the location errors.
Verifying Location Accuracy
By checking for location accuracy, you are checking the ability of the existing access point deployment to estimate the true location of an element within 10 meters at least 90% of the time.
You can analyze the location accuracy of non-rogue and rogue clients and asset tags by two methods:
•![]() Accuracy Tool-Enables the user to run either scheduled or on-demand location accuracy test. Both tests are configured and executed through a single window. This feature, introduced in release 4.0, provides expanded functionality and reporting beyond the testpoint method. Refer to "Using the Accuracy Tool to Conduct Accuracy Testing" section for configuration steps and reporting capabilities.
Accuracy Tool-Enables the user to run either scheduled or on-demand location accuracy test. Both tests are configured and executed through a single window. This feature, introduced in release 4.0, provides expanded functionality and reporting beyond the testpoint method. Refer to "Using the Accuracy Tool to Conduct Accuracy Testing" section for configuration steps and reporting capabilities.
•![]() Testpoints-Enables the user to run on-demand location accuracy tests. Refer to "Using Testpoints to Analyze Location Accuracy" section.
Testpoints-Enables the user to run on-demand location accuracy tests. Refer to "Using Testpoints to Analyze Location Accuracy" section.
Using the Accuracy Tool to Conduct Accuracy Testing
There are two methods of conducting location accuracy testing:
•![]() Scheduled Accuracy Testing-Employed when clients and tags are already deployed and associated to the wireless LAN infrastructure. Scheduled tests can be configured and saved when clients and tags are already pre-positioned so that the test can be run on a regularly, scheduled basis.
Scheduled Accuracy Testing-Employed when clients and tags are already deployed and associated to the wireless LAN infrastructure. Scheduled tests can be configured and saved when clients and tags are already pre-positioned so that the test can be run on a regularly, scheduled basis.
•![]() On demand Accuracy Testing-Employed when elements are associated but not pre-positioned. On demand testing allows you to test the location accuracy of clients and tags at a number of different locations. It is generally used to test the location accuracy for a small number of clients and tags.
On demand Accuracy Testing-Employed when elements are associated but not pre-positioned. On demand testing allows you to test the location accuracy of clients and tags at a number of different locations. It is generally used to test the location accuracy for a small number of clients and tags.
Both are configured and executed through a single window.

Note ![]() The Advanced Debug option must be enabled in Cisco WCS to allow use of both the Scheduled and On-demand location accuracy testing features.
The Advanced Debug option must be enabled in Cisco WCS to allow use of both the Scheduled and On-demand location accuracy testing features.
Follow these steps to enable the advanced debug option in Cisco WCS.
Step 1 ![]() In Cisco WCS, click Monitor > Maps.
In Cisco WCS, click Monitor > Maps.
Step 2 ![]() Select Properties from the Select a command drop-down menu and click GO.
Select Properties from the Select a command drop-down menu and click GO.
Step 3 ![]() Select Enabled from the Advanced Debug drop-down menu. Click OK.
Select Enabled from the Advanced Debug drop-down menu. Click OK.

Note ![]() If Advanced Debug is already enabled, you do not need to do anything further. Click Cancel.
If Advanced Debug is already enabled, you do not need to do anything further. Click Cancel.
You can now run location accuracy tests on the location appliance using the Accuracy Tool.
Using Scheduled Accuracy Testing to Verify Accuracy of Current Location
To configure a scheduled accuracy test, do the following:
Step 1 ![]() Click Tools > Accuracy Tool.
Click Tools > Accuracy Tool.
Step 2 ![]() Select New Scheduled Accuracy Test from the Select a command drop-down menu.
Select New Scheduled Accuracy Test from the Select a command drop-down menu.
Step 3 ![]() Enter a Test Name.
Enter a Test Name.
Step 4 ![]() Select the Area Type from the drop-down menu.
Select the Area Type from the drop-down menu.
Step 5 ![]() Campus is configured as Root Area, by default. There is no need to change this setting.
Campus is configured as Root Area, by default. There is no need to change this setting.
Step 6 ![]() Select the Building from the drop-down menu.
Select the Building from the drop-down menu.
Step 7 ![]() Select the Floor from the drop-down menu.
Select the Floor from the drop-down menu.
Step 8 ![]() Select the begin and end time of the test by entering the days, hours and minutes. Hours are entered using a 24-hour clock.
Select the begin and end time of the test by entering the days, hours and minutes. Hours are entered using a 24-hour clock.

Note ![]() When entering the test start time, be sure to allow enough time prior to the test start to position testpoints on the map.
When entering the test start time, be sure to allow enough time prior to the test start to position testpoints on the map.
Step 9 ![]() Select the Destination point for the test results. You can have the report emailed to you or download the test results from the Accuracy Tests > Results window. Reports are in PDF format.
Select the Destination point for the test results. You can have the report emailed to you or download the test results from the Accuracy Tests > Results window. Reports are in PDF format.

Note ![]() If you select the email option, a SMTP Mail Server must first be defined for the target email address. Click Administrator > Settings > Mail Server to enter the appropriate information.
If you select the email option, a SMTP Mail Server must first be defined for the target email address. Click Administrator > Settings > Mail Server to enter the appropriate information.
Step 10 ![]() Click Position Testpoints. The floor map appears with a list of all clients and tags on that floor with their MAC addresses.
Click Position Testpoints. The floor map appears with a list of all clients and tags on that floor with their MAC addresses.
Step 11 ![]() Click the check box next to each client and tag for which you want to check the location accuracy.
Click the check box next to each client and tag for which you want to check the location accuracy.
When you check a MAC address check box, two icons which overlay each other appear on the map.
One icon represents the actual location and the other the reported location.

Note ![]() To enter a MAC address for a client or tag that is not listed, check the Add New MAC check box and enter the MAC address and click Go. An icon for the element appears on the map.If the newly added element is on the location server but on a different floor, the icon displays in the left-most corner (0,0 position).
To enter a MAC address for a client or tag that is not listed, check the Add New MAC check box and enter the MAC address and click Go. An icon for the element appears on the map.If the newly added element is on the location server but on a different floor, the icon displays in the left-most corner (0,0 position).
Step 12 ![]() If the actual location for an element is not the same as the reported location, drag the actual location icon for that element to the correct position on the map. Only the actual location icon can be dragged.
If the actual location for an element is not the same as the reported location, drag the actual location icon for that element to the correct position on the map. Only the actual location icon can be dragged.
Step 13 ![]() Click Save when all elements are positioned. A panel appears confirming successful accuracy testing.
Click Save when all elements are positioned. A panel appears confirming successful accuracy testing.
Step 14 ![]() Click OK to close the confirmation panel. You are returned to the Accuracy Tests summary window.
Click OK to close the confirmation panel. You are returned to the Accuracy Tests summary window.

Note ![]() The accuracy test status displays as Scheduled when the test is about to execute. A status of Running displays when the test is in process and Idle when the test is complete. A Failure status appears when the test is not successful.
The accuracy test status displays as Scheduled when the test is about to execute. A status of Running displays when the test is in process and Idle when the test is complete. A Failure status appears when the test is not successful.
Step 15 ![]() To view the results of the location accuracy test, click the test name and then select the Results tab on the page that displays.
To view the results of the location accuracy test, click the test name and then select the Results tab on the page that displays.
Step 16 ![]() At the Results panel, click the Download link under the Saved Report heading to view the report.
At the Results panel, click the Download link under the Saved Report heading to view the report.
The Scheduled Location Accuracy Report includes the following information:
•![]() A summary location accuracy report that details the percentage of elements that fell within various error ranges.
A summary location accuracy report that details the percentage of elements that fell within various error ranges.
•![]() An error distance histogram
An error distance histogram
•![]() A cumulative error distribution graph
A cumulative error distribution graph
•![]() An error distance over time graph
An error distance over time graph
•![]() A summary by each MAC address whose location accuracy was tested noting its actual location, error distance and a map showing its spatial accuracy (actual vs. calculated location) and error distance over time for each MAC.
A summary by each MAC address whose location accuracy was tested noting its actual location, error distance and a map showing its spatial accuracy (actual vs. calculated location) and error distance over time for each MAC.
Using On-demand Accuracy Testing to Test Location Accuracy
An On demand Accuracy Test is run when elements are associated but not pre-positioned. On demand testing allows you to test the location accuracy of clients and tags at a number of different locations. It is generally used to test the location accuracy for a small number of clients and tags.
To run an On-demand Accuracy Test, do the following:
Step 1 ![]() Click Tools > Accuracy Tool.
Click Tools > Accuracy Tool.
Step 2 ![]() Select New On demand Accuracy Test from the Select a command drop-down menu.
Select New On demand Accuracy Test from the Select a command drop-down menu.
Step 3 ![]() Enter a Test Name.
Enter a Test Name.
Step 4 ![]() Select the Area Type from the drop-down menu.
Select the Area Type from the drop-down menu.
Step 5 ![]() Campus is configured as Root Area, by default. There is no need to change this setting.
Campus is configured as Root Area, by default. There is no need to change this setting.
Step 6 ![]() Select the Building from the drop-down menu.
Select the Building from the drop-down menu.
Step 7 ![]() Select the Floor from the drop-down menu.
Select the Floor from the drop-down menu.
Step 8 ![]() Tests results are viewed at the Accuracy Tests > Results window. Reports are in PDF format.
Tests results are viewed at the Accuracy Tests > Results window. Reports are in PDF format.
Step 9 ![]() Click Position Testpoints. The floor map appears with a red cross hair at the (0,0) coordinate.
Click Position Testpoints. The floor map appears with a red cross hair at the (0,0) coordinate.
Step 10 ![]() To test the location accuracy and RSSI of a particular location, select either client or tag from the drop-down menu on the left. A list of all MAC addresses for the selected option (client or tag) displays in a drop-down menu to its right.
To test the location accuracy and RSSI of a particular location, select either client or tag from the drop-down menu on the left. A list of all MAC addresses for the selected option (client or tag) displays in a drop-down menu to its right.
Step 11 ![]() Select a MAC address from the drop-down menu and move the red cross hair to a map location and click the mouse to place it.
Select a MAC address from the drop-down menu and move the red cross hair to a map location and click the mouse to place it.
Step 12 ![]() Click Start to begin collection of accuracy data.
Click Start to begin collection of accuracy data.
Step 13 ![]() Click Stop to finish collection. You should allow the test to run for at least two minutes before clicking Stop.
Click Stop to finish collection. You should allow the test to run for at least two minutes before clicking Stop.
Step 14 ![]() Repeat Step 10 to Step 13 for each testpoint that you want to plot on the map.
Repeat Step 10 to Step 13 for each testpoint that you want to plot on the map.
Step 15 ![]() Click Analyze when you are finished mapping the testpoints.
Click Analyze when you are finished mapping the testpoints.
Step 16 ![]() Select the Results tab on the panel that appears.
Select the Results tab on the panel that appears.
The On-demand Accuracy Report includes the following information:
•![]() A summary location accuracy report that details the percentage of elements that fell within various error ranges.
A summary location accuracy report that details the percentage of elements that fell within various error ranges.
•![]() An error distance histogram
An error distance histogram
•![]() A cumulative error distribution graph
A cumulative error distribution graph

Note ![]() You can download logs for accuracy tests from the Accuracy Tests summary page.
You can download logs for accuracy tests from the Accuracy Tests summary page.
•![]() To do so, check the listed test check box and select either Download Logs or Download Logs for Last Run from the Select a command menu and click GO.
To do so, check the listed test check box and select either Download Logs or Download Logs for Last Run from the Select a command menu and click GO.
•![]() The Download Logs option downloads the logs for all accuracy tests for the selected test(s).
The Download Logs option downloads the logs for all accuracy tests for the selected test(s).
•![]() The Download Logs for Last Run option downloads logs for only the most recent test run for the selected test(s).
The Download Logs for Last Run option downloads logs for only the most recent test run for the selected test(s).
Using Testpoints to Analyze Location Accuracy
You can analyze the location accuracy of non-rogue and rogue clients and asset tags by entering testpoints on an area or floor map. You can use this feature to validate location information generated either automatically by access points or manually by calibration.

Note ![]() By checking for location accuracy, you are checking the ability of the existing access point deployment to estimate the true location of an element within 10 meters at least 90% of the time.
By checking for location accuracy, you are checking the ability of the existing access point deployment to estimate the true location of an element within 10 meters at least 90% of the time.

Note ![]() Before starting this process, be sure to have the MAC addresses and locations for all elements within the area or floor to be analyzed. You need this information when placing the testpoints on the map. If analyzing location after calibration, you should analyze the location accuracy of at least as many elements entered during calibration.
Before starting this process, be sure to have the MAC addresses and locations for all elements within the area or floor to be analyzed. You need this information when placing the testpoints on the map. If analyzing location after calibration, you should analyze the location accuracy of at least as many elements entered during calibration.

Note ![]() The Advanced Debug option must be enabled on both the location appliance and WCS to allow use of the location accuracy testpoint feature.
The Advanced Debug option must be enabled on both the location appliance and WCS to allow use of the location accuracy testpoint feature.
To enable the advanced debug option and to assign testpoints to a floor map to check location accuracy, follow these steps:
Step 1 ![]() Choose Location > Location Servers.
Choose Location > Location Servers.
Step 2 ![]() Select a location server from the All Location Servers window that appears.
Select a location server from the All Location Servers window that appears.
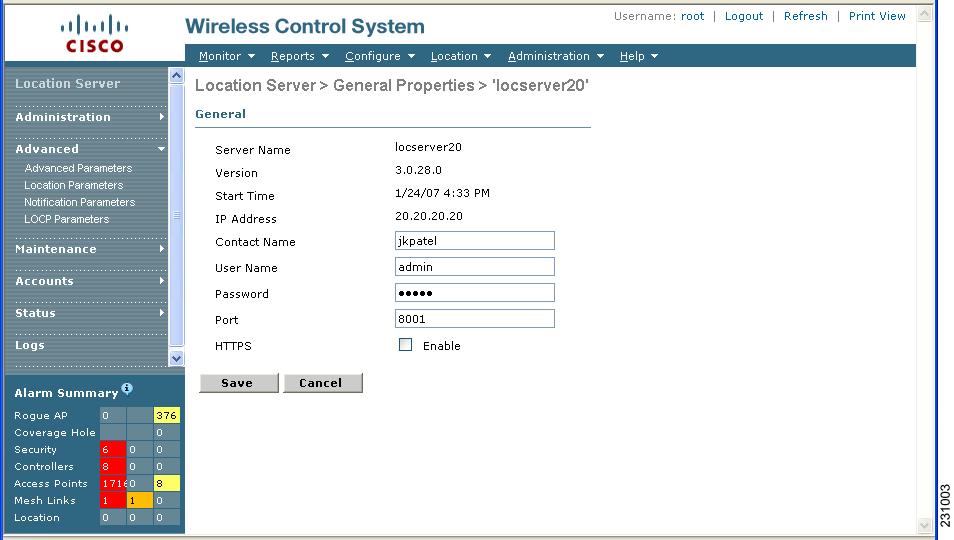
Step 3 ![]() Select Advanced Parameters from the Advanced menu of the Location Server General Properties window (Figure 7-4).
Select Advanced Parameters from the Advanced menu of the Location Server General Properties window (Figure 7-4).
Figure 7-4 Location Server General Properties Window
Step 4 ![]() At the window that appears, scroll down to the Advanced Parameters section (Figure 7-5).
At the window that appears, scroll down to the Advanced Parameters section (Figure 7-5).
Figure 7-5 Location Server > Advanced Parameters Window
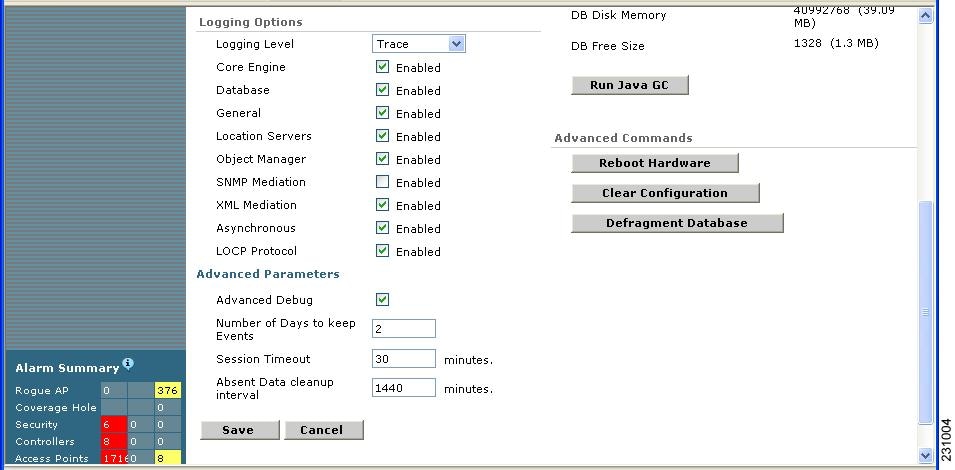
Step 5 ![]() Check the Advanced Debug box to enable the feature. Click Save.
Check the Advanced Debug box to enable the feature. Click Save.

Note ![]() If the Advanced Debug check box is already checked, you do not need to do anything further. Click Cancel.
If the Advanced Debug check box is already checked, you do not need to do anything further. Click Cancel.
You now must enable the Advanced debug level at the Maps level.
Step 6 ![]() Choose Monitor > Maps (Figure 7-6)
Choose Monitor > Maps (Figure 7-6)
Figure 7-6 Monitor > Maps Window
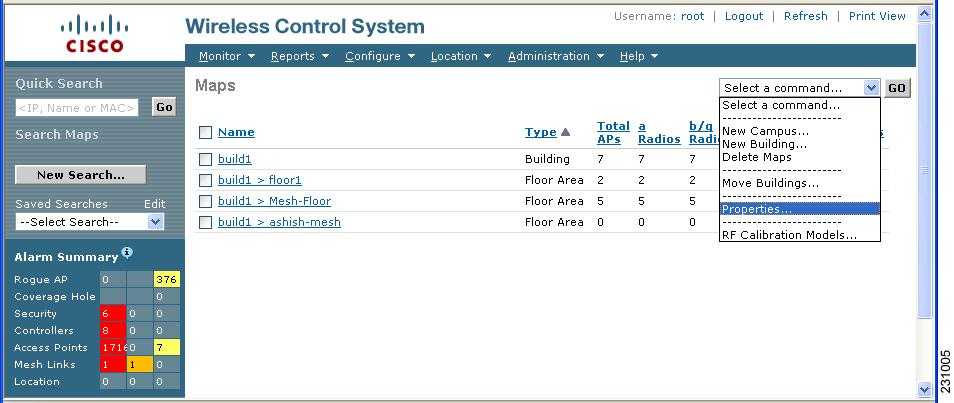
Step 7 ![]() Select Properties from the Select a command drop-down menu. Click GO.
Select Properties from the Select a command drop-down menu. Click GO.
The Maps > Properties window appears (Figure 7-7).
Figure 7-7 Maps > Properties Window
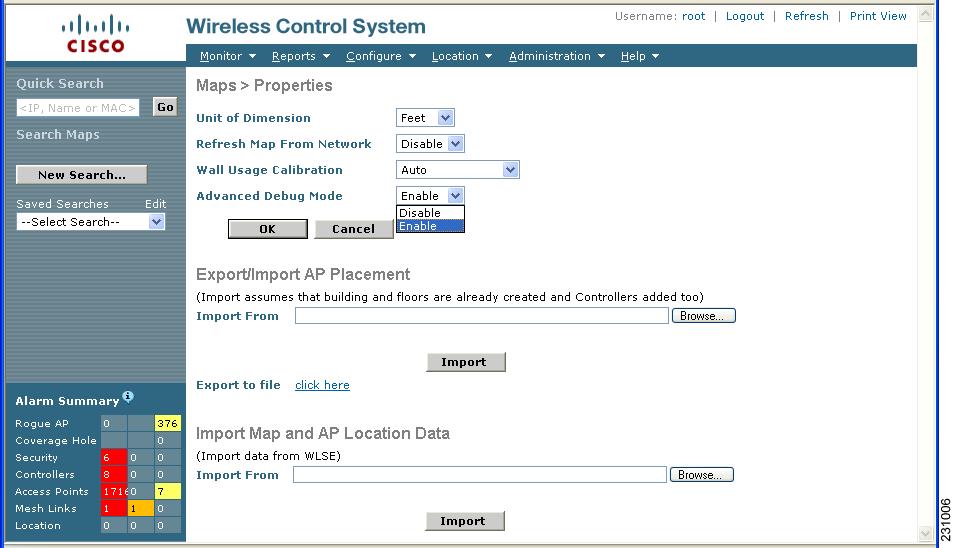
Step 8 ![]() Select Enable from the Advanced Debug drop-down menu. Click OK.
Select Enable from the Advanced Debug drop-down menu. Click OK.
You are returned to the Maps summary window. You are now ready to assign testpoints to a selected area or map.
Step 9 ![]() Choose Monitor > Maps. Select the area or floor you want to analyze from the map summary that appears.
Choose Monitor > Maps. Select the area or floor you want to analyze from the map summary that appears.
The selected area or floor appears (Figure 7-8).
Figure 7-8 Selected Area or Floor Map Chosen at Monitor > Maps Window
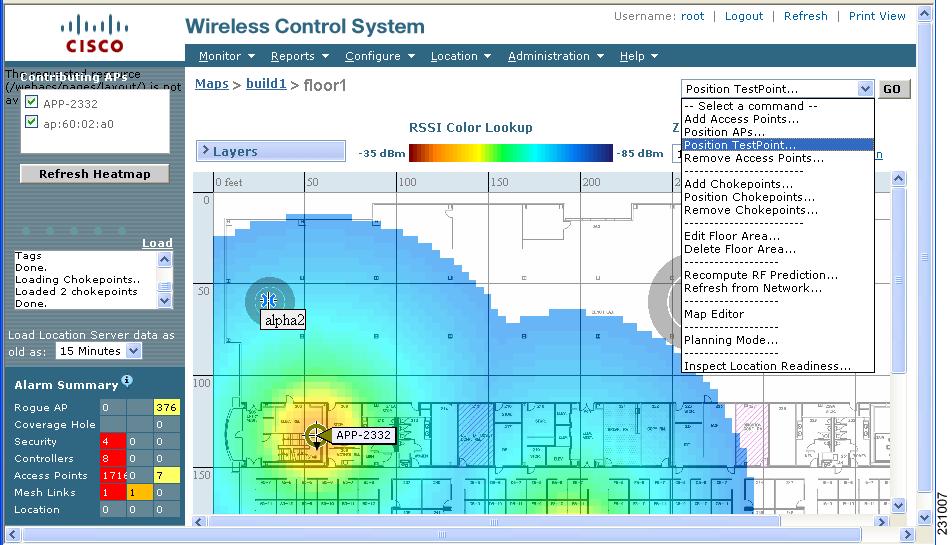
Step 10 ![]() Select Position TestPoint from the Select a command drop-down menu (top-right). Click GO.
Select Position TestPoint from the Select a command drop-down menu (top-right). Click GO.
A blank map of the selected area or floor appears for testpoint assignment (Figure 7-9).
Figure 7-9 Position TestPoint Assignment Window
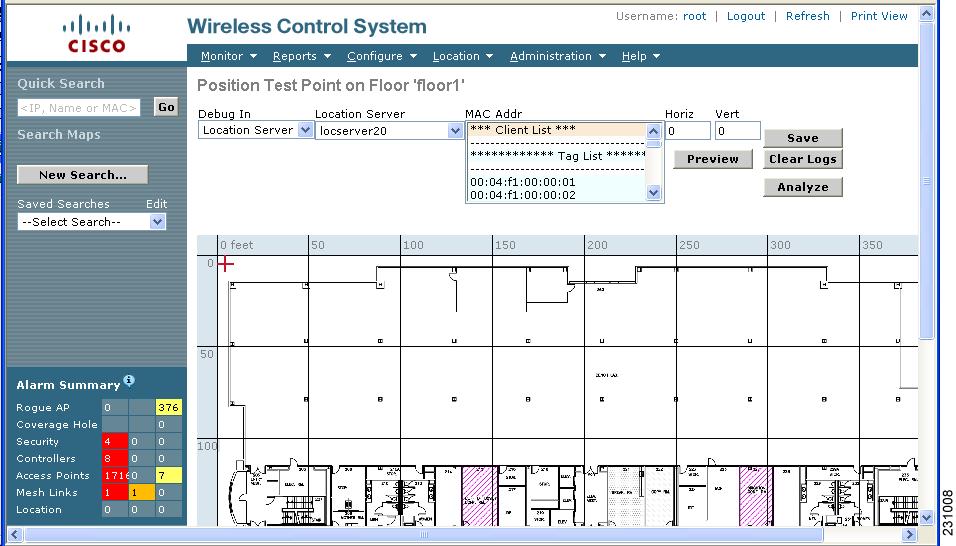
Step 11 ![]() Move the red cross hair cursor (top-left) to the map location that corresponds to the element.
Move the red cross hair cursor (top-left) to the map location that corresponds to the element.

Note ![]() Instead of using the cursor, you can enter the horizontal (Horz) and vertical (Vert) coordinates of the asset tag or client to mark its location.
Instead of using the cursor, you can enter the horizontal (Horz) and vertical (Vert) coordinates of the asset tag or client to mark its location.
Step 12 ![]() Select the MAC Address (MAC Addr) associated with that element from the drop-down menu. Click Preview to verify location. Click Save to finalize placement.
Select the MAC Address (MAC Addr) associated with that element from the drop-down menu. Click Preview to verify location. Click Save to finalize placement.
A pop up box appears confirming addition of the testpoint.
The red cross hair cursor returns to the upper left hand corner after placement is confirmed. You are ready to mark additional testpoints.
Step 13 ![]() Repeat steps 11 and 12 for each client or asset tag testpoint you want to add to the map.
Repeat steps 11 and 12 for each client or asset tag testpoint you want to add to the map.
Step 14 ![]() Click Analyze to determine location accuracy of the entered testpoints.
Click Analyze to determine location accuracy of the entered testpoints.
A pop up window appears providing accuracy information.
Using Chokepoints to Enhance Tag Location Reporting
Installing chokepoints provides enhanced location information for active RFID tags. When an active CCX version 1 compliant RFID tag enters the range of a chokepoint, it is stimulated by the chokepoint. The MAC address of this chokepoint is then included in the next beacon sent by the stimulated tag. All access points that detect this tag beacon then forward the information to the controller and location appliance.
Using chokepoints in conjunction with active CCX compliant tags provides immediate location information on a tag and its asset. When a CCX tag moves out of the range of a chokepoint, its subsequent beacon frames do not contain any identifying chokepoint information. Location determination of the tag defaults to the standard calculation methods based on RSSIs reported by access point associated with the tag.
Adding Chokepoints to the WCS Database and Map
Chokepoints are installed and configured as recommended by the Chokepoint vendor. When the chokepoint is installed and operational, you can add the chokepoint to the location database and positioned on a Cisco WCS map.

Note ![]() Chokepoints are managed by the chokepoint vendor's application.
Chokepoints are managed by the chokepoint vendor's application.
To add a chokepoint to the WCS database and appropriate map, follow these steps:
Step 1 ![]() Choose Configure > Chokepoints from the main menu (top).
Choose Configure > Chokepoints from the main menu (top).
The All Chokepoints summary window appears (Figure 7-10).
Figure 7-10 All Chokepoints Summary Window
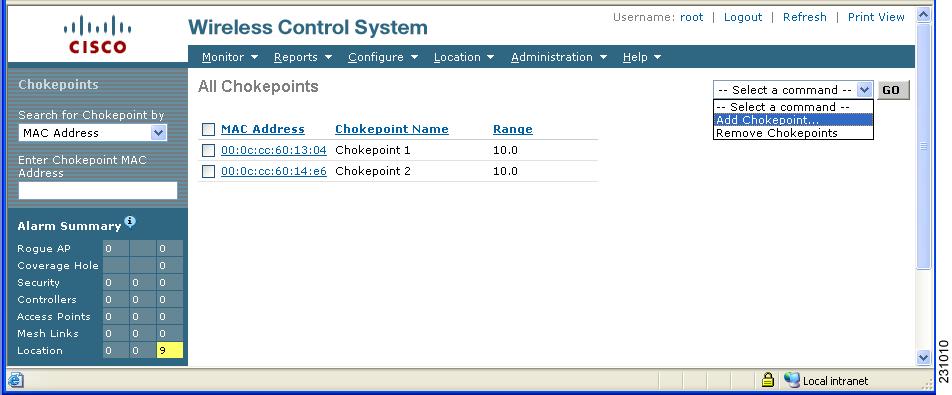
Step 2 ![]() Select Add Chokepoint from the Select a command menu (Figure 7-11). Click GO.
Select Add Chokepoint from the Select a command menu (Figure 7-11). Click GO.
The Add Chokepoint entry screen appears.
Figure 7-11 Add Chokepoint Window
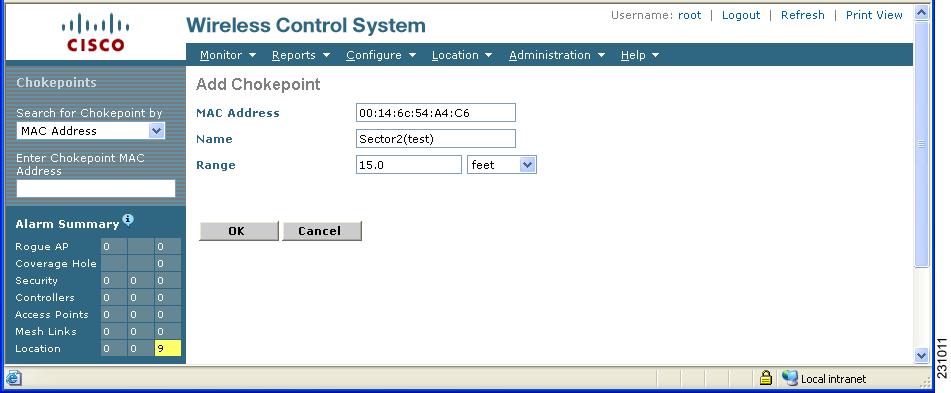
Step 3 ![]() Enter the MAC address, name, and coverage range for the chokepoint.
Enter the MAC address, name, and coverage range for the chokepoint.

Note ![]() The chokepoint range is product-specific and is supplied by the chokepoint vendor.
The chokepoint range is product-specific and is supplied by the chokepoint vendor.
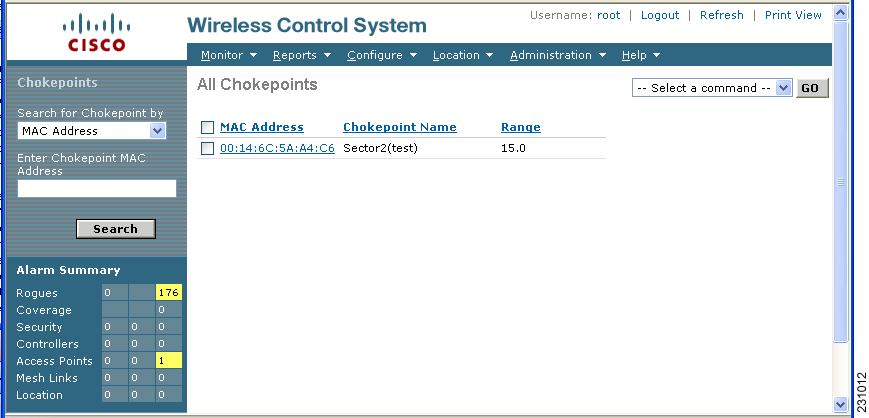
Step 4 ![]() Click OK to save the chokepoint entry to the database.
Click OK to save the chokepoint entry to the database.
The All Chokepoints summary window appears with the new chokepoint entry listed (Figure 7-12).
Figure 7-12 All Chokepoints Summary Window

Note ![]() After you add the chokepoint to the database, you can place the chokepoint on the appropriate WCS floor map.
After you add the chokepoint to the database, you can place the chokepoint on the appropriate WCS floor map.
Step 5 ![]() To add the chokepoint to a map, choose Monitor > Maps (Figure 7-13).
To add the chokepoint to a map, choose Monitor > Maps (Figure 7-13).
Figure 7-13 Monitor > Maps Window
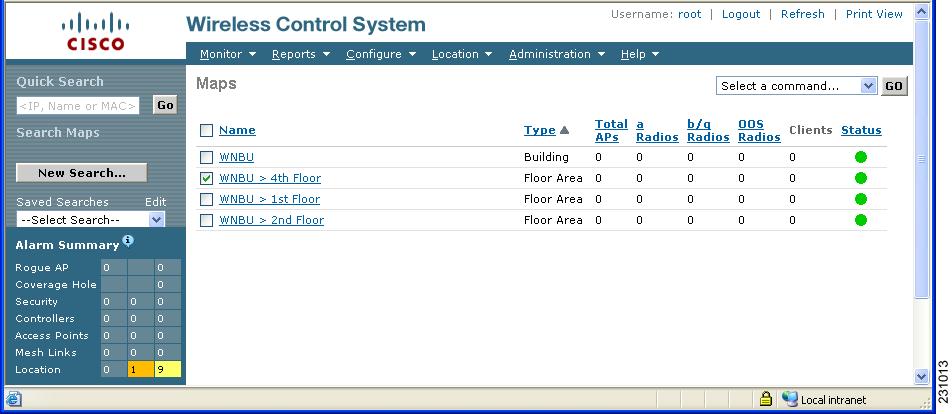
Step 6 ![]() At the Maps window, select the link that corresponds to the floor location of the chokepoint. The floor map appears (Figure 7-14).
At the Maps window, select the link that corresponds to the floor location of the chokepoint. The floor map appears (Figure 7-14).
Figure 7-14 Selected Floor Map
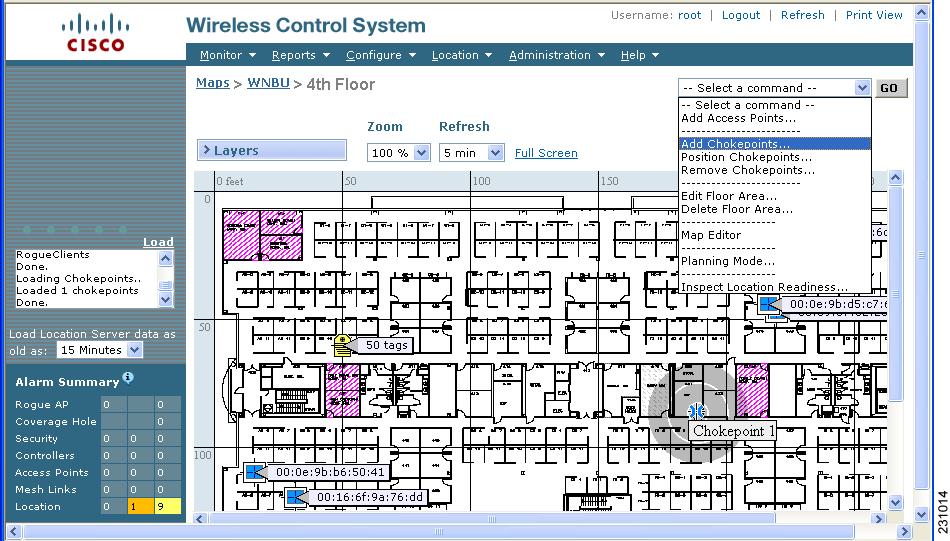
Step 7 ![]() Select Add Chokepoints from the Select a command menu. Click GO.
Select Add Chokepoints from the Select a command menu. Click GO.
The Add Chokepoints summary window appears (Figure 7-15).

Note ![]() The Add Chokepoints summary window lists all recently-added chokepoints that are in the database but not yet mapped.
The Add Chokepoints summary window lists all recently-added chokepoints that are in the database but not yet mapped.
Figure 7-15 Add Chokepoints Summary Window
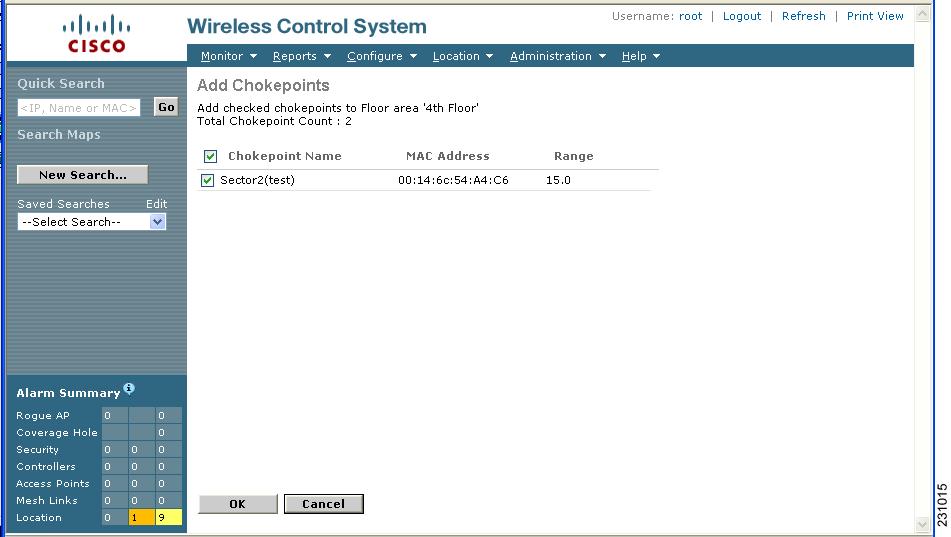
Step 8 ![]() Check the box next to the chokepoint to be added to the map. Click OK.
Check the box next to the chokepoint to be added to the map. Click OK.
A map appears with a chokepoint icon located in the top-left hand corner (Figure 7-16). You are now ready to place the chokepoint on the map.
Figure 7-16 Map for Positioning Chokepoint
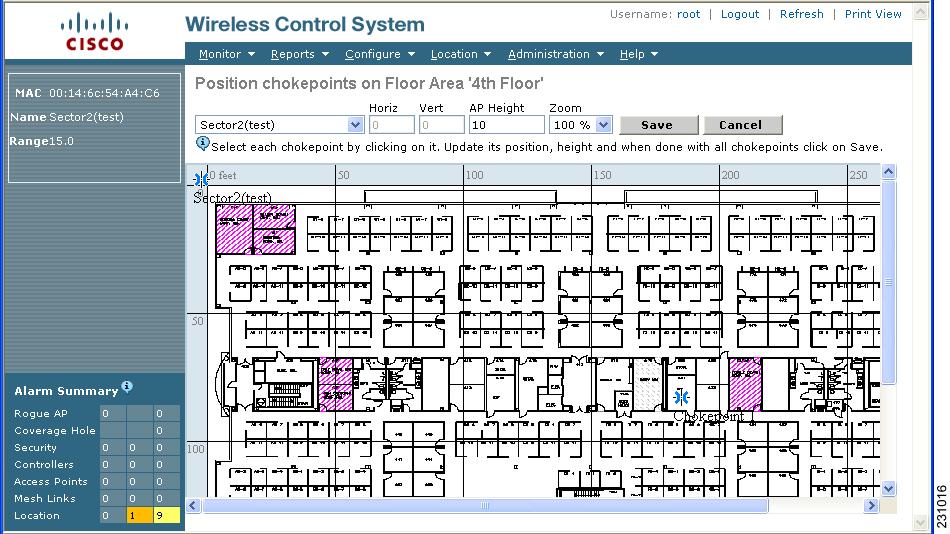
Step 9 ![]() Left click on the chokepoint icon and drag and place it in the proper location (Figure 7-17).
Left click on the chokepoint icon and drag and place it in the proper location (Figure 7-17).
Figure 7-17 Chokepoint Icon is Positioned on the Floor Map
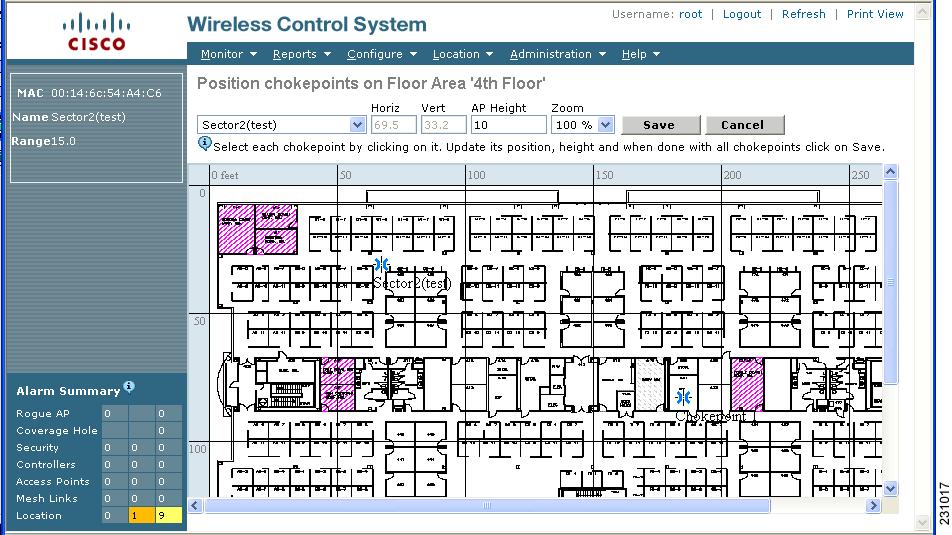

Note ![]() The MAC address, name, and coverage range of the chokepoint appear in the left panel when you click on the chokepoint icon for placement.
The MAC address, name, and coverage range of the chokepoint appear in the left panel when you click on the chokepoint icon for placement.
Step 10 ![]() Click Save when icon is correctly placed on the map.
Click Save when icon is correctly placed on the map.
You are returned to the floor map and the added chokepoint appears on the map (Figure 7-18).

Note ![]() The icon for the newly added chokepoint may or may not appear on the map depending on the display settings for that floor. If the icon did not appear, proceed with Step 11.
The icon for the newly added chokepoint may or may not appear on the map depending on the display settings for that floor. If the icon did not appear, proceed with Step 11.
Figure 7-18 New Chokepoint Displayed on Floor Map
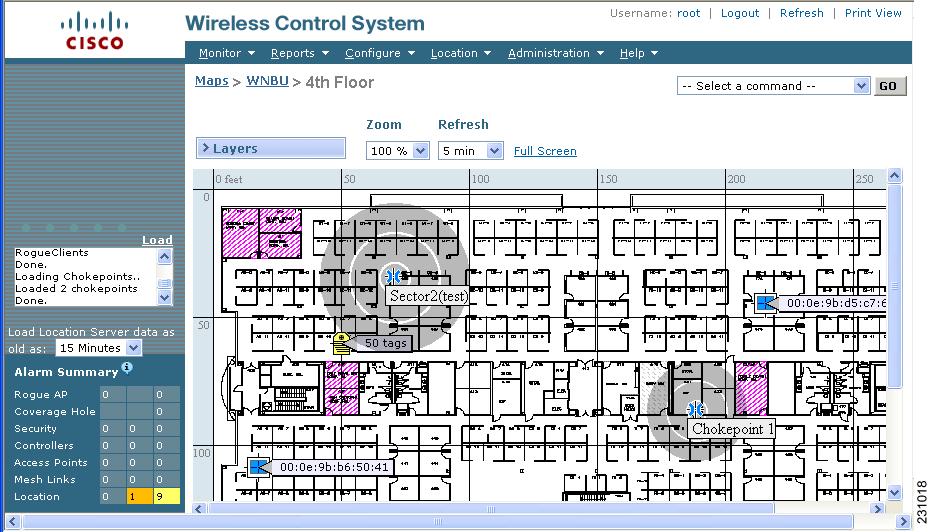

Note ![]() The rings around the chokepoint icon indicate the coverage area. When a CCX tag and its asset passes within the coverage area, location details are broadcast and the tag is automatically mapped on the chokepoint coverage circle. When the tag moves out of the chokepoint range, its location is calculated as before and it is no longer mapped on the chokepoint rings. In Figure 7-18, the tag is currently out of range of the chokepoint.
The rings around the chokepoint icon indicate the coverage area. When a CCX tag and its asset passes within the coverage area, location details are broadcast and the tag is automatically mapped on the chokepoint coverage circle. When the tag moves out of the chokepoint range, its location is calculated as before and it is no longer mapped on the chokepoint rings. In Figure 7-18, the tag is currently out of range of the chokepoint.

Note ![]() MAC address, name, and range of a chokepoint display when you pass a mouse over its map icon
MAC address, name, and range of a chokepoint display when you pass a mouse over its map icon
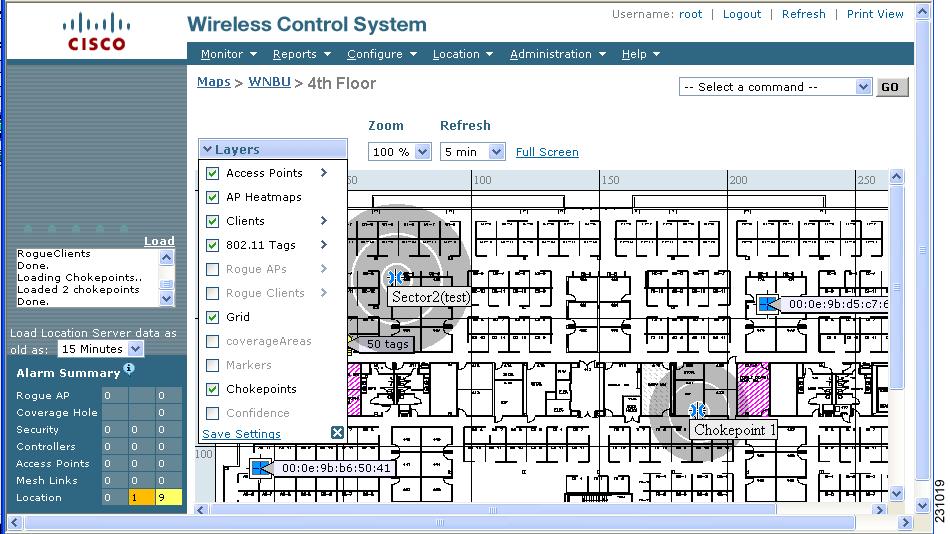
Step 11 ![]() If the chokepoint does not appear on the map, click Layers to collapse a selection menu of possible elements to display on the map. Click the Chokepoints check box.
If the chokepoint does not appear on the map, click Layers to collapse a selection menu of possible elements to display on the map. Click the Chokepoints check box.
The chokepoint appears on the map (Figure 7-19).
Figure 7-19 Chokepoints Displayed on Map
Step 12 ![]() Click X to close the Layers window.
Click X to close the Layers window.

Note ![]() Do not select Save Settings unless you want to save this display criteria for all maps.
Do not select Save Settings unless you want to save this display criteria for all maps.
Removing Chokepoints from the WCS Database and Map
You can remove one or multiple chokepoints at a time.
Follow these steps to delete a chokepoint.
Step 1 ![]() Choose Configure > Chokepoints. The All Chokepoints window appears.
Choose Configure > Chokepoints. The All Chokepoints window appears.
Step 2 ![]() Check the box(es) next to the chokepoint(s) to be deleted.
Check the box(es) next to the chokepoint(s) to be deleted.
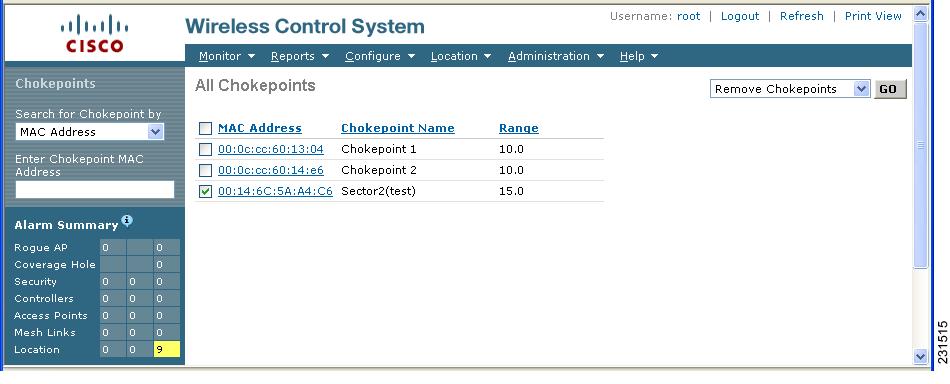
Step 3 ![]() Select Remove Chokepoints from the Select a command drop-down menu. Click GO (Figure 7-20).
Select Remove Chokepoints from the Select a command drop-down menu. Click GO (Figure 7-20).
Figure 7-20 Removing a Chokepoint
Step 4 ![]() To confirm chokepoint deletion, click OK in the pop-up window that appears.
To confirm chokepoint deletion, click OK in the pop-up window that appears.
You are returned to the All Chokepoints window. A message confirming deletion of the chokepoint appears. The deleted chokepoint(s) is no longer listed in the window.
Using Location Optimized Monitor Mode to Enhance Tag Location Reporting
To optimize monitoring and location calculation of tags, you can enable LOMM on up to four channels within the 2.4GHz band (802.11b/g radio) of an access point. This allows you to focus channel scans only on those channels on which tags are usually programmed to operate (such as channels 1, 6 and 11).
After enabling Monitor Mode at the access point level, you must then enable LOMM and assign monitoring channels on the 802.11 b/g radio of the access point.

Note ![]() For details on enabling Monitor Mode on an access point, refer to Step 5 in the "Configuring Access Points" section in Chapter 9 of the Cisco Wireless Control System Configuration Guide, Release 5.0.
For details on enabling Monitor Mode on an access point, refer to Step 5 in the "Configuring Access Points" section in Chapter 9 of the Cisco Wireless Control System Configuration Guide, Release 5.0.
Follow the steps below to set enable LOMM and assign monitoring channels on the access point radio.
Step 1 ![]() After enabling Monitor Mode at the access point level, choose Configure > Access Points.
After enabling Monitor Mode at the access point level, choose Configure > Access Points.
Step 2 ![]() At the All Access Points Summary window, select the 802.11 b/g Radio link for the appropriate access
At the All Access Points Summary window, select the 802.11 b/g Radio link for the appropriate access
Step 3 ![]() At the Radio parameters window, disable Admin Status by unchecking the check box. This disables the radio.
At the Radio parameters window, disable Admin Status by unchecking the check box. This disables the radio.
Step 4 ![]() Check the Location Optimized Channel Assignment check box. Drop-down menus for each of the four configurable channels display.
Check the Location Optimized Channel Assignment check box. Drop-down menus for each of the four configurable channels display.
Step 5 ![]() Select the four channels on which you want the access point to monitor tags.
Select the four channels on which you want the access point to monitor tags.

Note ![]() You can configure fewer than four channels for monitoring. To eliminate a monitoring channel, select None from the channel drop-down menu.
You can configure fewer than four channels for monitoring. To eliminate a monitoring channel, select None from the channel drop-down menu.
Step 6 ![]() Click Save. Channel selection is saved.
Click Save. Channel selection is saved.
Step 7 ![]() At the Radio parameters window, re-enable the radio by checking the Admin Status check box.
At the Radio parameters window, re-enable the radio by checking the Admin Status check box.
Step 8 ![]() Click Save. The access point is now configured as a LOMM access point.
Click Save. The access point is now configured as a LOMM access point.
The AP Mode display as Monitor/LOMM on the Monitor > Access Points window.
Enabling Location Presence on a Location Server
You can enable location presence by location server to provide expanded Civic (city, state, postal code, country) and GEO (longitude, latitude) location information beyond the Cisco default setting (campus, building, floor, and X, Y coordinates). This information can then be requested by clients on a demand basis for use by location-based services and applications.
Location Presence can be configured when a new Campus, Building, Floor or Outdoor Area is being added or configured at a later date.

Note ![]() For details on configuring location presence when adding a new Campus, Building, Floor or Outdoor Area, refer to the "Creating Maps" section in Chapter 5 of the Cisco Wireless Control System Configuration Guide, release 5.0 and greater.
For details on configuring location presence when adding a new Campus, Building, Floor or Outdoor Area, refer to the "Creating Maps" section in Chapter 5 of the Cisco Wireless Control System Configuration Guide, release 5.0 and greater.
Follow these steps to enable and configure location presence on a location server. Once enabled, the location server is capable of providing any requesting Cisco CX v5 client its location.

Note ![]() Before enabling this feature, synchronize the location server.
Before enabling this feature, synchronize the location server.
Step 1 ![]() Click Location > Location Servers > Server Name. Select the location server to which the campus or building is assigned.
Click Location > Location Servers > Server Name. Select the location server to which the campus or building is assigned.
Step 2 ![]() Select Presence Parameters from the Administration menu. The Location Presence window displays.
Select Presence Parameters from the Administration menu. The Location Presence window displays.
Step 3 ![]() Check the On Demand check box to enable location presence for Cisco CX clients v5.
Check the On Demand check box to enable location presence for Cisco CX clients v5.
Step 4 ![]() Select one of the Location Resolution options.
Select one of the Location Resolution options.
a. ![]() When Building is selected, the location server can provide any requesting client, its location by building.
When Building is selected, the location server can provide any requesting client, its location by building.
–![]() For example, if a client requests its location and the client is located in Building A, the location server returns the client address as Building A.
For example, if a client requests its location and the client is located in Building A, the location server returns the client address as Building A.
b. ![]() When AP is selected, the location server can provide any requesting client, its location by its associated access point. The MAC address of the access point displays.
When AP is selected, the location server can provide any requesting client, its location by its associated access point. The MAC address of the access point displays.
–![]() For example, if a client requests its location and the client is associated with an access point with a MAC address of 3034:00hh:0adg, the location server returns the client address of 3034:00hh:0adg.
For example, if a client requests its location and the client is associated with an access point with a MAC address of 3034:00hh:0adg, the location server returns the client address of 3034:00hh:0adg.
c. ![]() When X,Y is selected, the location server can provide any requesting client, its location by its X and Y coordinates.
When X,Y is selected, the location server can provide any requesting client, its location by its X and Y coordinates.
–![]() For example, if a client requests its location and the client is located at (50, 200) the location server returns the client address of 50, 200.
For example, if a client requests its location and the client is located at (50, 200) the location server returns the client address of 50, 200.
Step 5 ![]() Check any or all of the location formats.
Check any or all of the location formats.
a. ![]() Check the Cisco check box to provide location by campus, building and floor and X and Y coordinates. Default setting.
Check the Cisco check box to provide location by campus, building and floor and X and Y coordinates. Default setting.
b. ![]() Check the Civic check box to provide the name and address (street, city, state, postal code, country) of a campus, building, floor or outdoor area. Expanded location details can also be entered in the Advanced panel.
Check the Civic check box to provide the name and address (street, city, state, postal code, country) of a campus, building, floor or outdoor area. Expanded location details can also be entered in the Advanced panel.
c. ![]() Check the GEO check box to provide the longitude and latitude coordinates.
Check the GEO check box to provide the longitude and latitude coordinates.
Step 6 ![]() By default the Text check box for Location Response Encoding is checked. It indicates the format of the information when received by the client. There is no need to change this setting.
By default the Text check box for Location Response Encoding is checked. It indicates the format of the information when received by the client. There is no need to change this setting.
Step 7 ![]() Check the Retransmission Rule Enable check box to allow the receiving client to retransmit the received information to another party.
Check the Retransmission Rule Enable check box to allow the receiving client to retransmit the received information to another party.
Step 8 ![]() Enter a Retention Expiration value in minutes. This determines how long the received information is stored by the client before it is overwritten. Default value is 24 hours (1440 minutes).
Enter a Retention Expiration value in minutes. This determines how long the received information is stored by the client before it is overwritten. Default value is 24 hours (1440 minutes).
Step 9 ![]() Click Save.
Click Save.
 Feedback