Dashboard

The intent of the Dashboard is to enable network and storage administrators to focus on particular areas of concern around the health and performance of data center switching. This information is provided as 24-hour snapshots.

The various scopes that are available on the Cisco SAN Controller Web UI are:

Overview

By default, a subset of the available dashlets are automatically displayed in the Overview of dashboard.

From the left menu bar, choose Dashboard > Overview. The Overview window displays the default dashlets.

The following are the default dashlets that appear in the Overview window:

Dashlet

Description

Fabrics

Displays details of Fabrics such as name, state, and health status of the fabric.

To view more information about the fabric, click the fabric name (link) to open the Fabric slide-in pane. Click the Launch icon. Alternatively, double-click the fabric name.

The Fabric Overview window appears.

Event Analytics

Displays events with Critical, Major, Minor, and Warning severity.

Click the severity level or the sectors on the pie chart to view more information about the severity of events and alarms in the Event Analytics window.

Links

Displays a diagram of Inter-Switch Link (ISL) and NPV Links for transmitting and receiving in the data center. Click the sectors on the pie chart to view more information in the SAN Links window.

Switches

Switch Health - Displays the switch's health status in the form of chart with colors and health condition names with total number of switches in the brackets.

The colors and what they indicate are described in the following list:

  • Green: Indicates that the element is in good health and functioning as intended.

  • Yellow: Indicates that the element is in warning state and requires attention to prevent any further problems.

  • Red: Indicates that the element is in critical state and requires immediate attention.

  • Gray: Indicates lack of information to identify the element or the element has been discovered.

Switch Status - Displays the status of the switch.

Switch Release Versions - Displays the switch release versions.

Switch Models - Displays the models of switches.

Click the sectors on the pie chart, the severity, status, versions, or the models to view more information in the Switches window.

Modules

Displays the switches on which the modules are discovered, the models name and the count.

Port Usage

Displays the ports inventory summary information.

Performance Collector

Displays the performance collection information.

  • Click Stop collector to stop performance collection information.

  • Click Start collector to restart the performance collection information.

Top ISL

Displays data for top 10 performing ISLs. Each entry shows device name, specifies the average of Rx traffic and Tx traffic in percentage.

Click the chart icon next to the device name to view more details.

Top SAN End Ports

Displays the performance data for the top ten performing SAN host and storage ports. Each entry shows the current receive and transmit percentage, with a graph depicting the percentage of time each trunk spent exceeding the currently configured thresholds.

Click the chart icon next to the device name to view more details.

TOP FICON End Ports

Displays data for top 10 performing FICON host and control unit ports. Each entry shows port traffic of switch interface, specifies the device to which the FICON port is connected, specifies the average of Rx traffic and Tx traffic, and exceeded percentage value.

Click the chart icon next to the device name to view more details.

TOP FCIP ISL

Displays data for top 10 performing FCIP ISLs. Each entry shows device name, specifies the average of Rx traffic and Tx traffic, and exceeded percentage value.

Click the chart icon to view more details.

TOP Optics

Displays data for top 10 optics. You can sort optics by hotest SPFs, coldest SPFs, lowers Rx Power, and lowest Tx Power.

Click the chart icon next to the switch interfaces view more details.

TOP CPU/Temperature

Displays the data for top CPU and temperature details of switches.

Click the chart icon next to the switch to view more details.

TOP Error And Discard

Displays the top error packets that are discarded for the selected interface.

Click the chart icon to view more details.

Host

UI Path: Dashboard > Host

Host dashboard provides information that is related to the discovered SAN and LAN hosts. It provides detailed information that is related to the network, such as I/O traffic, disk latency, CPU, memory statistics, topology, and events about each individual host and virtual machines that are configured on top of the virtual host. The Hosts dashboard consists of four panels:

  • Enclosures panel - Lists the hosts and their network attributes and associated Virtual Machines (VMs). Click on VM number to view SAN Host VM screen.

    • Host Name column lists all the hosts.

      Click i icon for relevant host enclosure to view SAN Insights Monitor page. See Monitor Metrics for more information.

      Click the Host Name to view summary information of host.

      An icon next to the host name displays the type of discovery. It displays if the enclosure is from a vCenter or storage or FC discovery.

    • WWM displays the World-Wide Name of this fabric element. It's a 64-bit identifier and is unique worldwide.

    • #VMs displays SAN host VM details. Click #VMs to view SAN Host VM Screen and Enclosures information.

  • Traffic Chart - Provides the I/O statistics, CPU and memory information, and disk latency of individual hosts or virtual machines.

  • Events Table tab—Provides information about events of all the switch ports that are configured within a specific host enclosure.

  • Topology panel - Provides an end-to-end topology layout and path information between host enclosures and storage enclosures. The discovered virtual machines are displayed and when you select the virtual machine, the path to the SAN data source is displayed. You can toggle this view to list all data paths.

  • Click Host Name, a slide-in panel is displayed. You can view the following fields.

The following table describes the fields that appear on this page.

Field

Description

IP Address

Displays the IP address of the switch.

Mac Address

Displays the MAC addresses.

WWN

Displays the port WWN.

FCIDs

Specifies the associated FCID.

OS

Displays the OS details.

#VMs

Displays the number of VMs.

VHost Name

Displays the name of the virtual host.

VHost IP

Displays the name of the virtual host IP Address.

VCluster

Displays the name of the virtual cluster.

Multipath

Displays the multipath details.

Protocol

Specifies if the Host is streaming SCSI protocol traffic or NVMe protocol traffic.

This column displays data only for the Hosts for which data is streamed to NDFC using SAN Insights.


Note


Collection level in the vCenter settings determines the amount of data that is gathered and displayed in charts. Level 1 is the default Collection Level for all collection intervals. Change the vCenter statistics settings to Level 2 or higher to collect disk I/O history data.


Viewing Host Enclosures

To view the host enclosures from the SAN Controller Web UI, perform the following steps:

Procedure


Step 1

Choose Dashboard > Hosts.

The list of hosts in the host enclosures table is displayed.

Step 2

Click on i icon of host enclosure.

The SAN Insights Monitor window appears.

Step 3

On SAN Insights Monitor window, click on required host name.

The Host enclosure slide-in pane appears.

Step 4

Click on Launch icon to view Host Enclosure page.

The Host Enclosure window appears.

host-enclosure

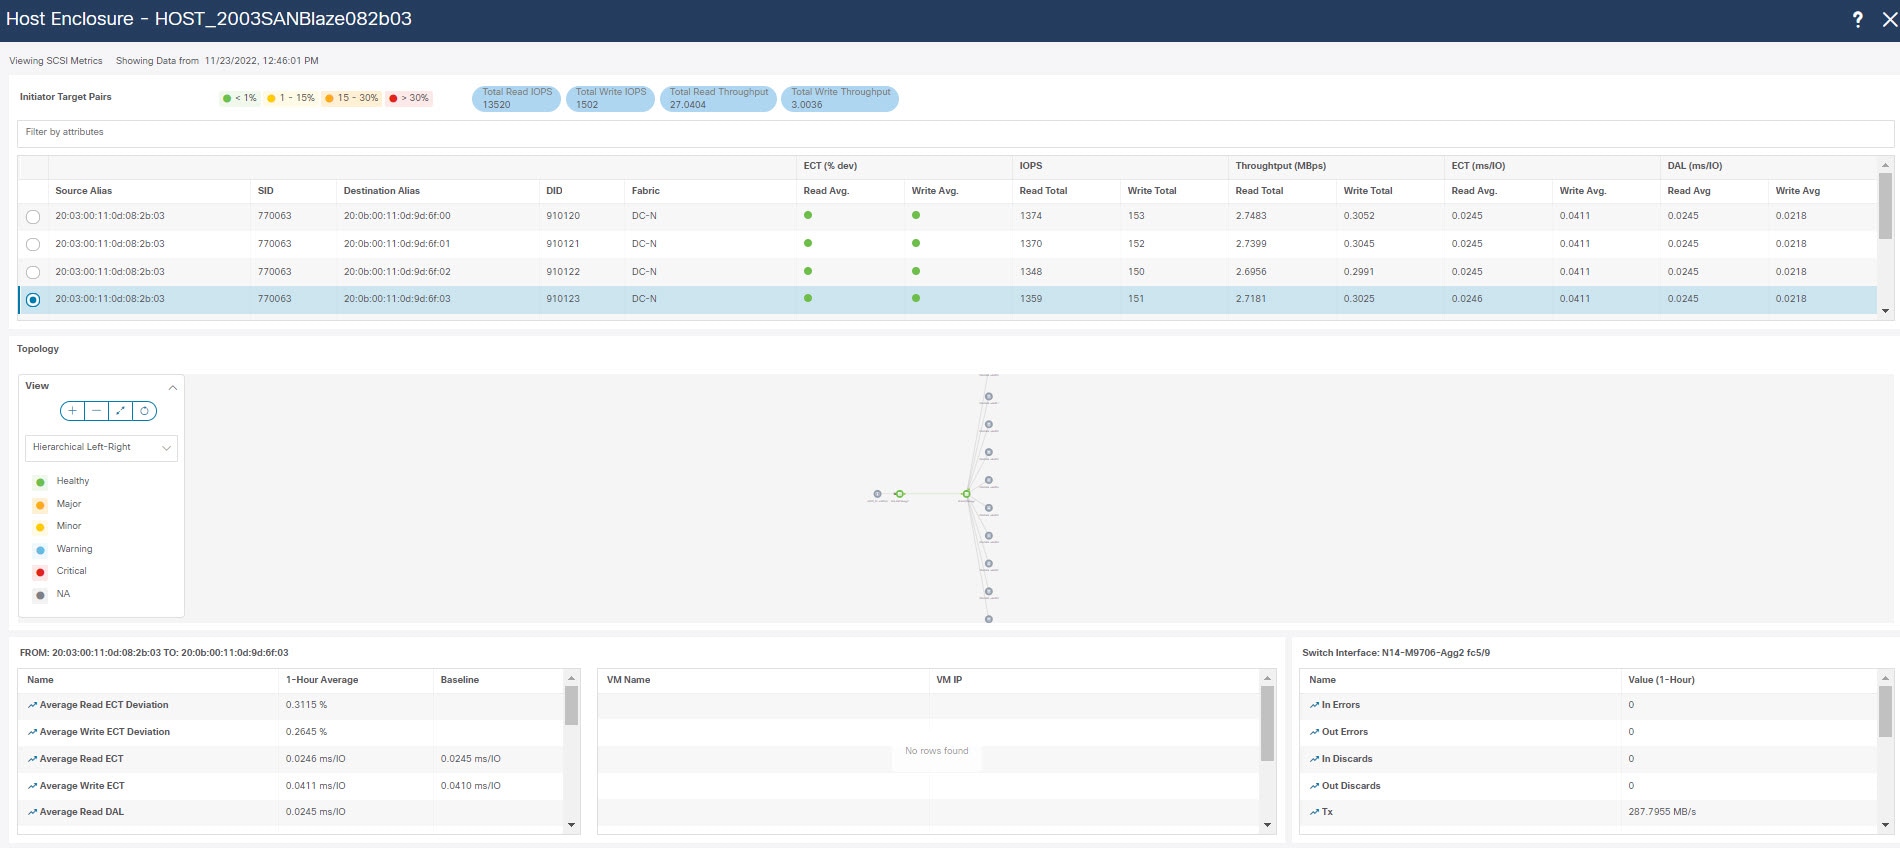
The Host Enclosure window displays the Initiator-Target (IT) pairs, Topology, average and total ECT/DAL/IOPS/Throughput/read/write times, and Switch Interface for the selected host.

You can view total read/write IOPS/Throughput value for selected host enclosure.

  • Initiator Target Pairs - This table lists all the initiator-target pairs for the selected host. The flow table shows the details of all metrics on ECT/DAL/ IOPS/ Throughput/read/write times, Source Alias, SID, Destination Alias, DID, and Fabric along with their 1-hour average and the baseline information.

  • Topology - Provides an end-to-end topology layout and path information between host enclosures. On View card click + or - to zoom-in and zoom-out. Similarly, you can use the mouse scroll wheel to zoom-in and zoom-out. Click Refresh icon to refresh the topology view. Choose Select layout drop-down list to view topology. This can be either Hierachical or Hierachical Left-Right view or Circular or Random.

  • The first table in below row shows the details of all metrics on ECT/DAL/read/write times, active I/Os, IOPS, Throughput, etc. along with their 1-hour average and the baseline information.

  • The middle table in below row displays VM Name and IP address for the IT pair selected in the above table.

  • Switch Interface - Click on topology to view associated switch name and the interface name in the last row in table.


Viewing CPU & Memory and Disk I/O Charts

To view the SAN host enclosures from the NDFC SAN Controller Web UI, perform the following steps:

Before you begin

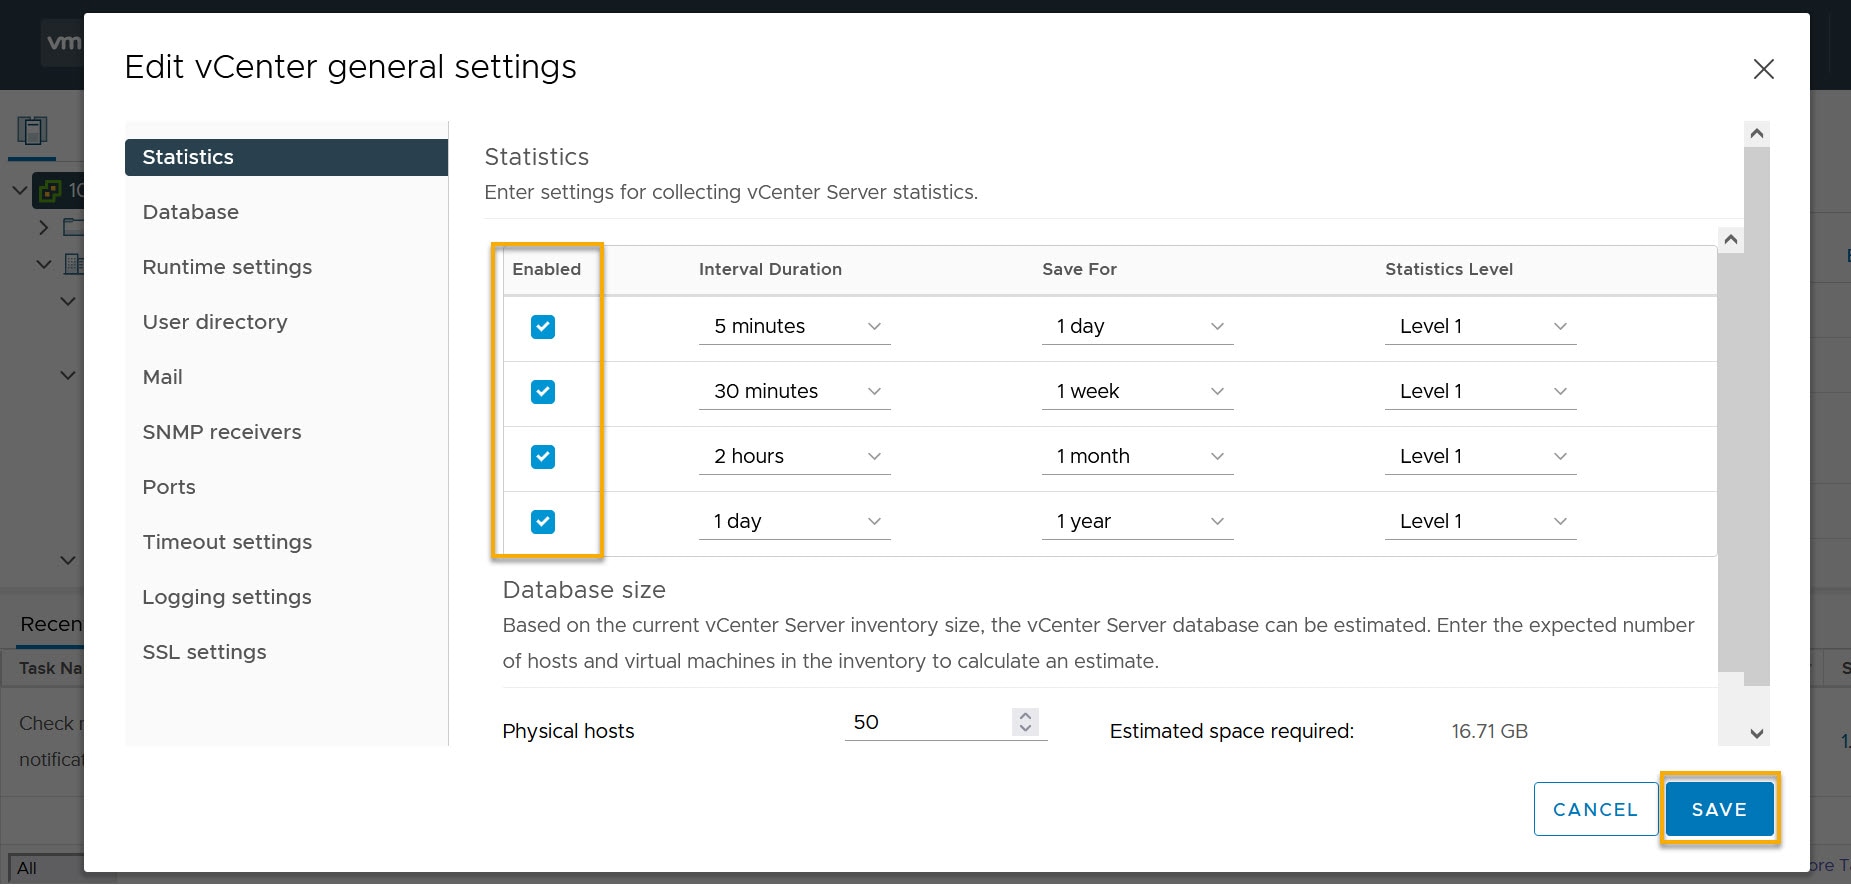
To view VM charts for CPU & Memory and Disk I/O, and VM Flow,you must edit vCenter settings on the vSphere vCenter and enable statistics manually.

To enable statistics manually on the vSphere vCenter, perform the following steps:

  1. Login to vSphere vCenter. (Click on the appropriate Host.)

  2. Click Configure > EDIT. The Edit vCenter general settings screen appears.

  3. On Statistics tab, check all the check boxes and click SAVE.

Procedure


Step 1

Choose Dashboard > Hosts.

The list of hosts in the Enclosures table is displayed.

Step 2

Click the host name.

The Host slide-in pane displays general information.

Step 3

Click on #VMs to view the required virtual machine (VM) details.

The SAN Host VM Screen is displayed.

san-host-vm

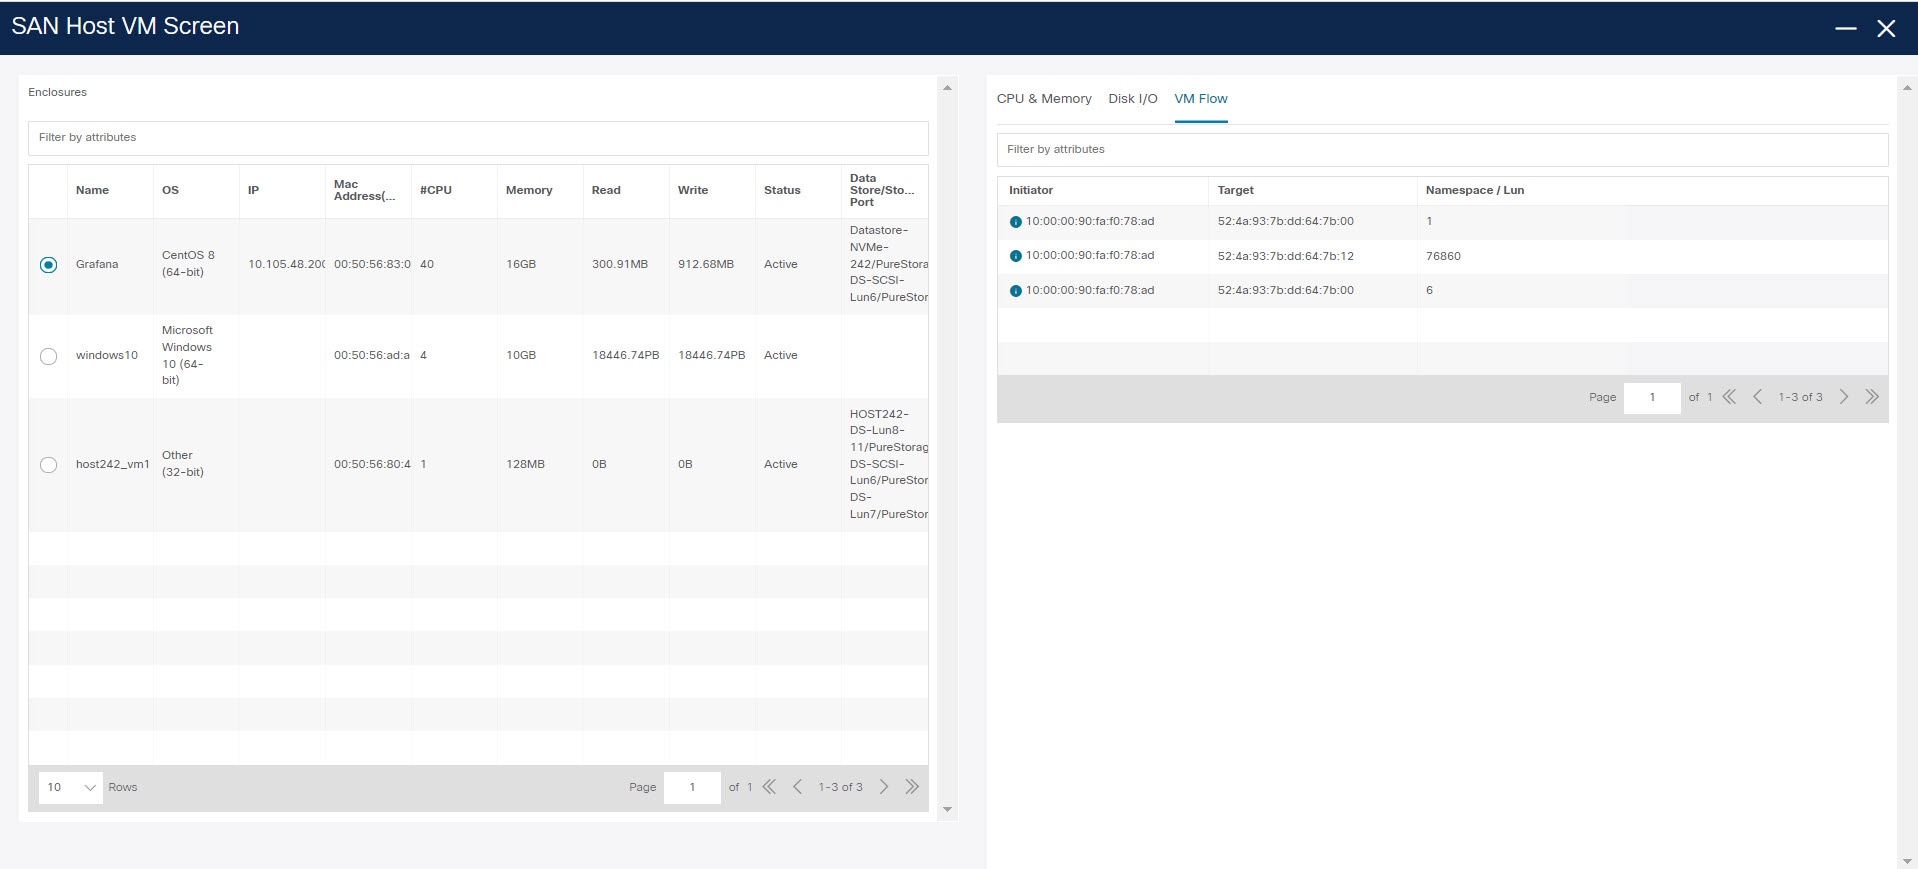
The SAN Host VM Screen consists of two panels.

Enclosures – It consists of host name and its network attributes such as operating system, IP Address, MAC Address, number of CPU, Memory size, Read/Write value, Status of host, Data storage, and port value.

Select an Enclosure to view:

  • CPU & Memory – Graph plotted displays percentage corresponding to time.

  • Disk I/O – Graph plotted displays kilobyte/sec corresponding to time.

  • VM Flow – This screen displays Initiator, Target, and Namespace/LUN of selected host.

    Click information (i) icon to view related Initiator-Target flow in SAN Insights Metrics Custom Graphing window.


Storage

To access the Storage dashboard, choose Dashboard > Storage.

The Storage dashboard consists of four panels:

  • Enclosures panel - Lists the storage and their network attributes.

    • Storage Name column lists all the hosts.

      Click i icon for relevant host enclosure to view SAN Insights Monitor page. See Monitor Metrics for more information.

      An icon next to the host name displays the type of discovery. It displays if the enclosure is from a vCenter or storage or FC discovery.

    • WWM displays the World-Wide Name of this fabric element. It's a 64-bit identifier and is unique worldwide.

  • Topology area—Provides end-to-end topology layout and path information of storage enclosures. The discovered virtual machines are displayed and when you select the virtual machine, the path to the SAN data source is displayed. You can toggle this view to list all data paths.

  • Traffic Chart area—Provides the I/O statistics, CPU and memory information, and disk latency of individual hosts or virtual machines.

  • Events Table area—Provides information about the events of all the switch ports that are configured within a specific host enclosure.

  • Click Storage Name, a slide-in panel is displayed. You can view below fields.

The following table describes the fields that appear on this screen.

Field

Description

IP Address

Displays the IP address of the switch.

Mac Addresses

Displays the MAC addresses.

WWN

Displays the port WWN.

FCIDs

Specifies the associated FCID.

OS

Displays the OS details.

#VMs

Displays the number of VMs.

VHost Name

Displays the name of the virtual host.

VHost IP

Displays the name of the virtual host IP Address.

VCluster

Displays the name of the virtual cluster.

Multipath

Displays the multipath details.

Protocol

Specifies if the Host is streaming SCSI protocol traffic or NVMe protocol traffic.

This column displays data only for the Hosts for which data is streamed to the SAN Controller using SAN Insights.

Viewing Storage Enclosure

SAN Controller allows you to view SAN Insights metrics based on two protocols, SCSI and NVMe. By default, the SCSI protocol is selected. However, you can change this setting from the Settings > Server Settings > Insights. Ensure that you restart the SAN Insights service to use the new properties.

To view the storage enclosure from the SAN Controller Web UI, perform the following steps:

Procedure


Step 1

Choose Dashboard > Storage.

The list of storage in the storage enclosures table is displayed.

Step 2

Click i icon to view SAN Insights Monitor page. On SAN Insights Monitor window, click on required storage name. Refer to Monitor Metrics for more information.

Step 3

Click on Launch icon to view Storage Enclosure window.

The Storage Enclosure window appears.

The Storage Enclosure window displays the Initiator-Target (IT) pairs, Topology, average ECT/DAL/read/write times, and Switch Interface for the selected host.

  • Initiator Target Pairs - This table lists all the initiator-target pairs for the selected storage. The flow table shows the details of all metrics on ECT/DAL/read/write times, active I/Os, aborts, failures etc. along with their 1-hour average and the baseline information.

  • Topology - Provides an end-to-end topology layout and path information between host enclosures. On View card click + or - to zoom-in and zoom-out. Similarly, you can use the mouse scroll wheel to zoom-in and zoom-out. Click Refresh icon to Refresh the topology view. Choose Select layout drop-down list to view topology. This can be either Hierachical or Hierachical Left-Right view.

  • The flow table shows the details of all metrics on ECT/DAL/read/write times, active I/Os, IOPS, Throughput etc. along with their 1-hour average and the baseline information.

  • The table displays VM Name and IP address for the IT pair that is selected in the above table.

  • Switch Interface - This table displays data for the last hour period that is selected for the interface. The switch name and the interface name are displayed on top of the switch interface table.


SAN Insights

SAN Insights visually displays fabric-level information in a holistic view from end-to-end.

On the SAN Insights dashboard page, you can select protocol, fabric, and switches from protocol, fabric, and switches drop-down lists. The dashlets display insight data based on the selected scope.

The dashboard displays the data over the last 72 hours. However, the Flow Summary and the Enclosure Summary donuts display the last 15 minutes from the latest updated time.


Note


You can increase the default dashlets display value. It is recommended to retain the default value of dashlets.


SAN Controller allows you to view SAN Insights metrics based on fabrics, switches, and two protocols namely SCSI and NVMe.

Ensure that you have enabled SAN Insights feature for SAN Controller. Choose Settings > Feature Management, choose check box SAN Insights.

Ensure that you have configured SAN Insights, to view information on Dashboard. See Configuring SAN Insights.

Viewing SAN Insights

To view the SAN Insights Dashboard, choose Dashboard > SAN Insights. The SAN Insights Dashboard provides visibility for overall read/write IO operations/latency.

Table 1. SAN Insights Dashboard

Field

Description

Fabric

Click Fabric, to select required fabric, and click Save.

Switch

Click Switch, to select required switch.

Protocol

Choose SCSI or NVMe check box to select required protocol.

By default, SCSI protocol is selected,

Active ITL

Displays total active ITL values.

Total ITL

Displays total ITL value for selected options.

Active ITN

Displays total active ITN values.

Total ITN

Displays total ITN value for selected options.

Last Record Time

Displays last record time for selected options.

Custom Graphing

Click Custom Graphing, SAN Insights Metrics Custom Graphing window is displayed. For more information, see Custom Graphing.

Monitor Metrics

Click Monitor Metrics, SAN Insights Monitor window is displayed. For more information, see Monitor Metrics.

Refresh

Click Refresh icon to Refresh and load screen.

san-insights-monitor

Ensure that you restart the SAN Insights service to use the new properties.

The active and total distinct ITL and ITN counts from the trained baseline is displayed at top center of dashboard. The total ITL and ITN count, however, shows the count of all the ITLs and ITN for the scope selected.

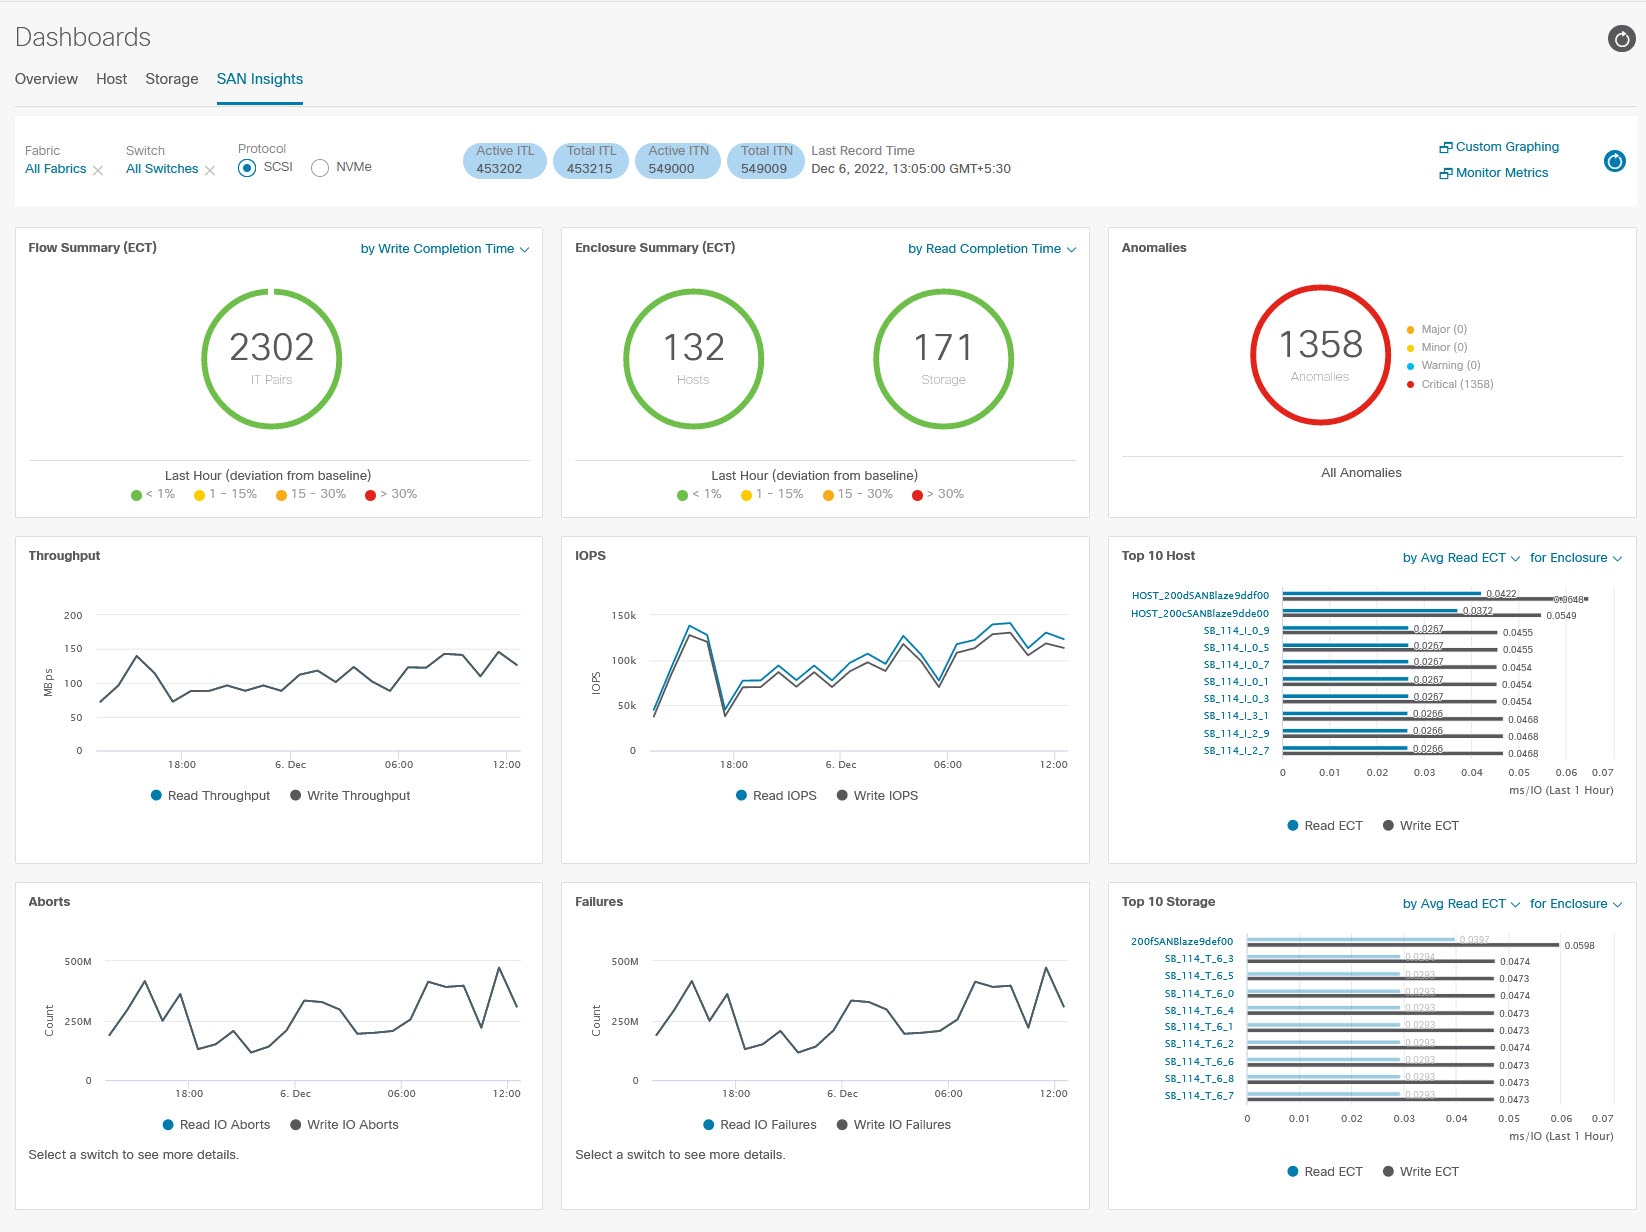
The SAN Insights dashboard contains the following dashlets.

  • Flow Summary (ECT)

    From the drop-down list, select Read Completion Time or Write Completion Time, based on which the donuts show IT Pairs . These data-points are computed based on the last available hourly roll updata in the Elasticsearch.

  • Enclosure Summary (ECT)

    From the drop-down list, select Read Completion Time or Write Completion Time, based on which the donuts display Storage and Hosts. These data-points are computed based on the last available hourly roll up data in the Elasticsearch.

  • Anomalies

    Displays the number of anomalies policy and their severity levels in pie-chart and list. The pie chart displays the severity levels in different color modes and the list next to the chart displays the severity level and the number of anomaly policies in that level.

    Click on Anomalies dashlet to navigate to Alarms window. You can edit, manage, view, acknowledge, and clear these anomalies. Choose Operations > Event Analytics > Alarms.

  • Throughput

    Displays the Read and Write throughput rate. Hover the mouse on the graph to view the value at that instance. The metrics in these line charts are computed based on the data during the last 72 hours.

  • IOPS

    Displays the Read and Write IOPs trend. The metrics in these line charts are computed based on the data during the last 72 hours.

  • Aborts

    Displays the Read and Write Aborts trend. The metrics in these line charts are computed based on the data during the last 72 hours. This metric is computed based on the read_io_aborts and write_io_aborts metric reported by the Cisco MDS SAN Analytics infrastructure.

    Select a switch to see more details, to view the custom graphing for READ IO Aborts/Failures for the switch IP address that is selected on the Dashboard page.

  • Failures

    Displays the Read and Write Failures trend. The metrics in these line charts are computed based on the data during the last 72 hours. This metric is computed based on the read_io_failures and write_io_failures metric reported by the Cisco MDS SAN Analytics infrastructure.

    Select a switch to see more details, to view the custom graphing for READ IO Aborts/Failures for the switch IP address that is selected on the Dashboard page.

  • Top 10 Hosts

    Represents the top 10 Host Enclosures/WWN/Device Alias in the selected Protocol/Fabric/Switch scope based on the metric that is selected in the drop-down list. The data can be sorted by Read/Write IOPS, Throughput, Exchange Completion Time or Data Access Latency. These metrics computed for the last one hour. By default, data is displayed for Avg. Read ECT value.

  • Top 10 Storage

    Represents the top 10 Storage Enclosures/WWN/Device Alias in the selected Protocol/Fabric/Switch scope based on the metric that is selected in the drop-down list. The data can be sorted by Read/Write IOPS, Throughput, Exchange Completion Time or Data Access Latency. These metrics computed for the last one hour. By default, data is displayed for Avg. Read ECT value.


Note


  • The Top 10 Host and Top 10 Storage are computed over the last 72 hours, based on hourly data collected for the selected protocol, fabric(s), and switch(es). If you change the enclosure names for specific WWPNs, the names of the old enclosures names are visible until the data ages out after 72Hours.

  • In the Top 10 Host and Top 10 Storage dashlets, the bars for the write metrics do not display the value always due to restricted space. To view all the values on the graph, you can either hover the mouse over the bar or hide the read or the write bar using the legend at the bottom of the dashlet.


A warning message appears as HIGH NPU LOAD Detected on top of the Dashboard > SAN Insights window. The warning implies that one or more switches has an unacknowledged Syslog event during the previous week. The event may affect the availability of the analytics data stored or displayed. You must acknowledge these events to remove the warning.

A warning appears as HIGH ITL LOAD Detected on top of the Dashboard > SAN Insights window.

Ensure that you have configured Syslog on the SAN Controller Device Manager, to capture NPU and ITL Loads. Choose SAN > Switches. Click on the switch, a slide-panel is displayed, click Launch icon to view switch information, click Device Manager. On the Device Manager tab, click on Logs > Syslog > Setup. Click Create. Enter the required parameters. Ensure that you choose the syslog radio button in the Facility area. Click Create to enable Syslog on the SAN Controller server.

To resolve the high NPU and high ITL loads, click on the HIGH NPU LOAD Detected or HIGH ITL LOAD Detected link. The Monitor > Switch > Events page appears. The list of events is filtered for Type: HIGH_NPU_LOAD and Type: HIGH_ITL_LOAD. Select all the switches and click Acknowledge. This removes the HIGH NPU LOAD Detected and HIGH ITL LOAD Detected warnings.

Viewing Custom Graphing

To view the SAN Insights metrics, choose Dashboard > SAN Insights. The SAN Insights Dashboard page appears. Click View Custom Graphing to view SAN Insights Metrics Custom Graphing window.

The dashboard displays the data over the last 72 hours. However, the Flow Summary and the Enclosure Summary donuts display the last hour aggregation from the latest updated time. The top 10 hosts/storage, throughput, IOPS, Aborts, Failures, graph display respective data.


Note


The refresh interval for Custom Graphing page is 5 minutes. Click on the Play icon to refresh every 5 minutes automatically.


Cisco SAN Controller allows you to view SAN Insights metrics based on two protocols, SCSI and NVMe. By default, the SCSI protocol is selected. However, you can change this setting from on the Web UI > Settings > Server Settings > Insights.

Ensure that you restart the SAN Insights service to use the new properties.

Viewing Custom Graph and Table

This is a freestyle dashboard where multiple metrics can be selected and the real-time data for the selected metrics is shown in multiline graph which is configured to Refresh every 5 minutes and corresponding raw data will be shown in the data table.

You can also add multiple graphs for comparison by clicking on the Add Graph the top right.


Note


The Auto Refresh option is disabled by default. You must click the Play icon to enable the Auto Refresh feature.


SAN Insights Metrics has two tabs.

  • Graph

  • Table

Graph

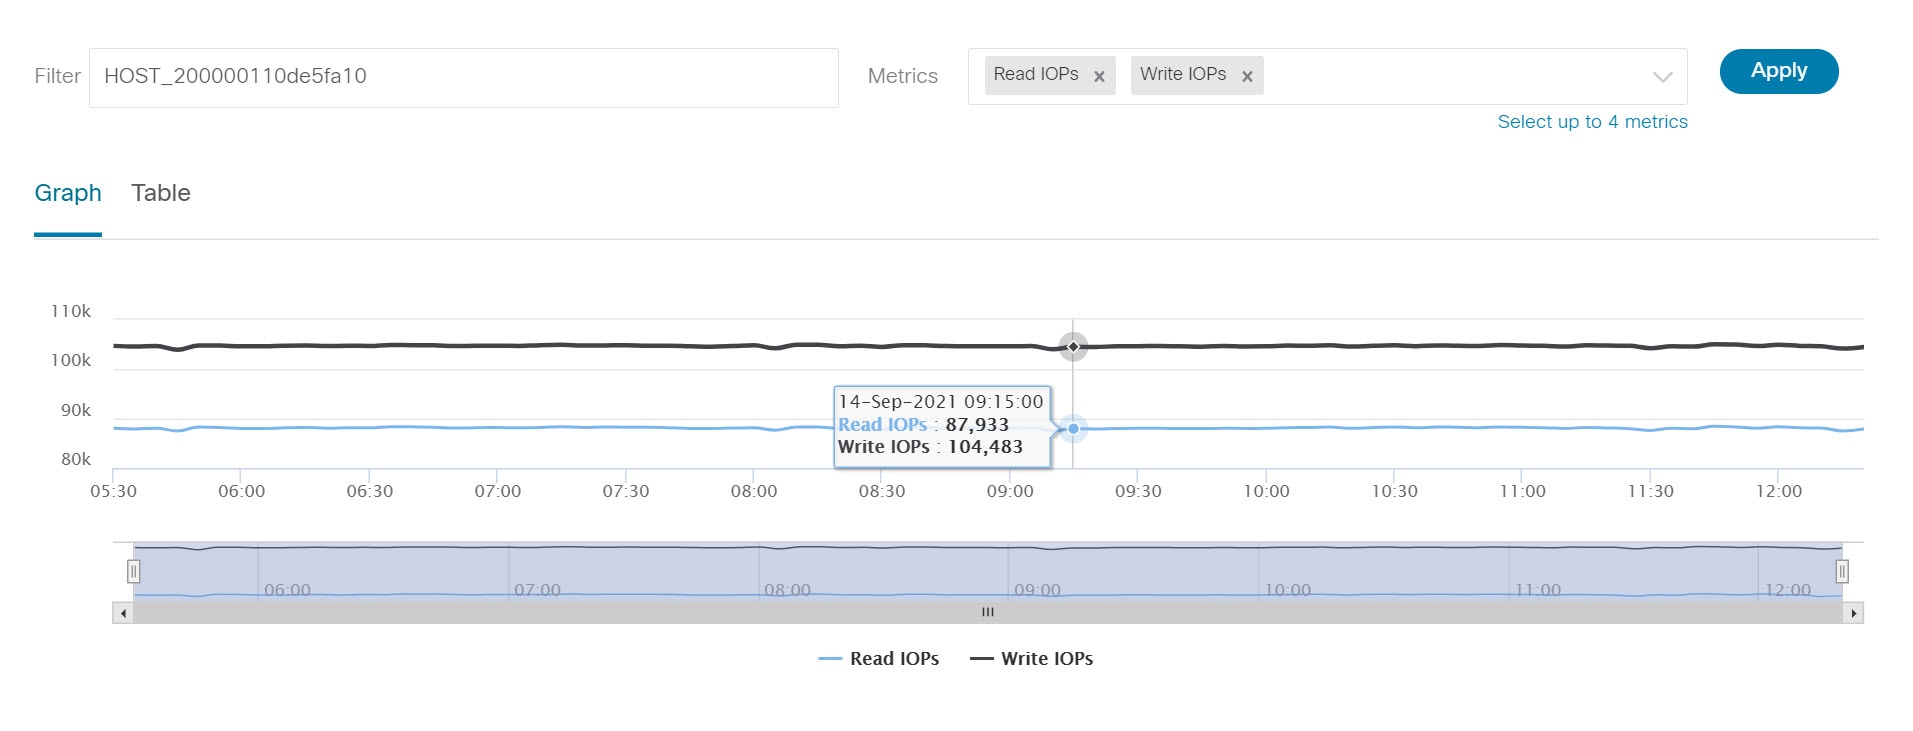
san-insight-graph

The graph is plotted with corresponding metrics with from and to date selected. It’s dynamic in nature as the data can be refreshed every 5 minutes and can be converted into a static graph using the pause button. Click Add Graph to create graph. You can add maximum of three graphs at a time on this page.

SAN Controller allows the user to view data for more than two weeks’ timeframe (up to a default maximum of 90 days. You can configure this timeframe in the server properties. Click drop down button next to Time Range and select date.

The Custom graphing metrics are enhanced to include the Write IO Failures, Read IO Failures, Write IO Aborts and Read IO Aborts to the drop-down metrics list.

ECT Baseline for each ITL Flow (Reads and Writes) is calculated using weighted average learned continuously over a training period:

  • The ECT Baseline computation consists of two parts: the training period and the recalibration time.

  • The training period for ECT Baseline is seven days by default (configurable).

  • After the training is completed, the ECT Baseline remains the same until the recalibration is triggered after 7 days by default (configurable).

  • By default every 14 days training runs for seven days (cyclic).

  • The percentage (%) deviation shows the deviation of the current normalized ECT compared to the ECT Baseline.

Table

When you select a failure or abort from Metrics drop-down list, the table list is filtered to show only the rows that have at least one of the selected failure or abort metrics as a nonzero entry. The table displays only 100 records. However, to help find their nonzero failures that you can filter the table to show the last 100 records with an Abort or Failure that is nonzero. When you select failure or aborts, the table label changes to depict this behavior.

To view, input any of the seven dimensions (Initiator Enc, Initiator, Target Enc, Target, LUN, Switch IP Address, Port, Timestamp, Read IOPs, Write IOPs) in the filter by attributes field (separated by comma), and select an associated metric.

Click Download button to download the table in .csv format. You can download the table of maximum 100 rows.

Hover the mouse on information (i)icon in the Initiator column. The Show Flow VMs text displayed. Click the icon Flow VMs window is displayed. You can view related VM Names and IP addresses.

Monitoring Metrics

UI Path: Dashboard > SAN Insights > Monitor Metrics

The SAN Insights Monitor page displays the health-related indicators in the interface so that you can quickly identify issues in your environment. You can use health indicators to understand where problems are in your fabrics.

SAN Controller allows you to view SAN Insights monitor based on two protocols, SCSI and NVMe. By default, the SCSI protocol is selected. However, you can change this setting from the Settings > Server Settings > Insights.

From Release 12.0.1a, you can view SAN Insights Monitor on dashboard. From SAN Controller Web UI, perform the following steps:

Procedure


Step 1

Choose Dashboard > SAN Insights .

Step 2

Click Monitor Metrics.

The SAN Insights Monitor window is displayed.

The color of the status is as an hourly average of Read and Write deviation for the respective Initiator Target Pairs.

Step 3

Choose SCSI or NVMe metrics using Viewing drop-down list to view to select the data type.

Step 4

Choose Host Enclosure, Storage Enclosure, or IT Pairs using On drop-down list to view required data.

Step 5

Click Refresh icon, to view current time.

The system time is displayed at the right corner of the window.

Specify a time interval using the time setting icon. Click Setting icon, enter appropriate time in hours and click Apply to view data of selected time.

The switch interface counters display when you choose green circle icon on the switch on the topology page.

Step 6

Click on the required name to view details.

A slide-in panel is displayed with the associated I-T pairs.

Step 7

Click Launch icon to view the window.

Similarly, you can click thrice on the name to navigate to the detailed view.

The SAN Insights Monitor page displays the initiator-target pairs for the selected enclosure or IT Pairs. The flow table shows the details of all metrics on ECT/DAL/read/write times, ECT (%dev) information.

Similarly, you can view SAN Insights Monitor, from host and storage tabs on dashboard.

  • Choose Dashboard > Host, click i icon on required host name. For more information on host enclosure, refer to Viewing Host Enclosures section.

  • Choose Dashboard > Storage, click i icon on required storage name. For more information on storage enclosure, refer to Viewing Storage Enclosures section.

For more information on Initiator-Target (IT) Pairs, refer to Viewing IT Pairs section.


Viewing IT Pairs

Cisco Nexus Dashboard Fabric Controller allows you to view SAN Insights metrics based on two protocols, SCSI and NVMe. By default, the SCSI protocol is selected. However, you can change this setting from the Settings > Server Settings > Insights. Ensure that you restart the SAN Insights service to use the new properties

To view the IT Pair from the Cisco Nexus Dashboard Fabric Controller Web UI, perform the following steps:

Before you begin

UI Path: Dashboard > SAN Insights > Monitor Metrics

Procedure

Step 1

Choose Dashboard > SAN Insights > Monitor Metrics

The SAN Insights Monitor page appears. Refer to Monitor Metrics for more information.

Step 2

Choose SCSI or NVMe metrics using Viewing drop-down list to view to select the data type.

Step 3

Choose IT Pairs using On drop-down list to view data.

Step 4

Click on required IT pair name.

The IT pair slide-in panel appears.

Step 5

Click on Launch icon to view IT pairs window.

The IT pairs window appears.

The IT pair window displays the Initiator-Target (IT) pairs, Topology, average ECT/DAL/read/write times, and Switch Interface for the selected IT pair.

  • Initiator Target Pairs - This table lists all the IT pairs for the selected IT pair name. The flow table shows the details of all metrics on ECT/DAL/read/write times, active I/Os, aborts, failures etc. along with their 1-hour average and the baseline information.

  • Topology - Provides an end-to-end topology layout and path information between IT pairs. On View card click + or - to zoom-in and zoom-out. Similarly, you can use the mouse scroll wheel to zoom-in and zoom-out. Click Refresh icon to refresh the topology view. Choose Select layout drop-down list to view topology. This can be either Hierachical or Hierachical Left-Right view.

  • The flow table shows the details of all metrics on ECT/DAL/read/write times, active I/Os, IOPS, Throughput etc. along with their 1-hour average and the baseline information.

  • Switch Interface - This table displays data for the last hour period selected for the selected interface. The switch name and the interface name are displayed on top of the switch interface table.