Health Insights Overview
Health Insights is a network health application that performs real-time key performance indicator (KPI) monitoring, analytics, and alerting and aids in troubleshooting.
It builds dynamic detection and analytics modules that allow operators to monitor and alert network events with user-defined logic.
It also provides prebuilt KPIs that are based on Model-Driven Telemetry (MDT), SNMP-based telemetry, or GNMI/Openconfig based telemetry collection. The Health Insights Recommendation Engine uses data mining to analyze your network and recommends which telemetry paths you should enable and monitor.
 Note |
For MDT-based KPIs, crossword pushes the KPI configuration down to the device. For SNMP, CLI, and GNMI-based KPIs, the operator must have the device configured to respond to a request for telemetry data. |
Important |
Due to the additional data collection tasks required, Health Insights requires the use of Extended Cisco Crosswork Data Gateways. |
The following high-level example gives a basic view of how Health Insights interacts with the other Cisco Crosswork Network Controller components:
-
Health Insights detects an anomaly: The optical bit error rate that you are monitoring on each of the links in your network suddenly increases.
-
Change Automation Playbooks automate remediation: Switch to the backup link immediately. Restore service. Open a ticket (manually initiated by the user). Alert the network engineer.
Health Insights is configured to gather the link bandwidth usage data for device links. After a time period, it establishes a performance baseline for each link. If a link deviates from its baseline causing an alert to be generated, Health Insights detects it and you can then go and run the Playbook to reconfigure the network to resolve the issue.
The complexity of the interaction will depend on the type of anomaly, how it is detected, and the Playbooks you choose to use to remediate it. You can orchestrate any form of network remediation using Change Automation Playbooks, helping you to close the loop on problem resolution and maximize network performance.
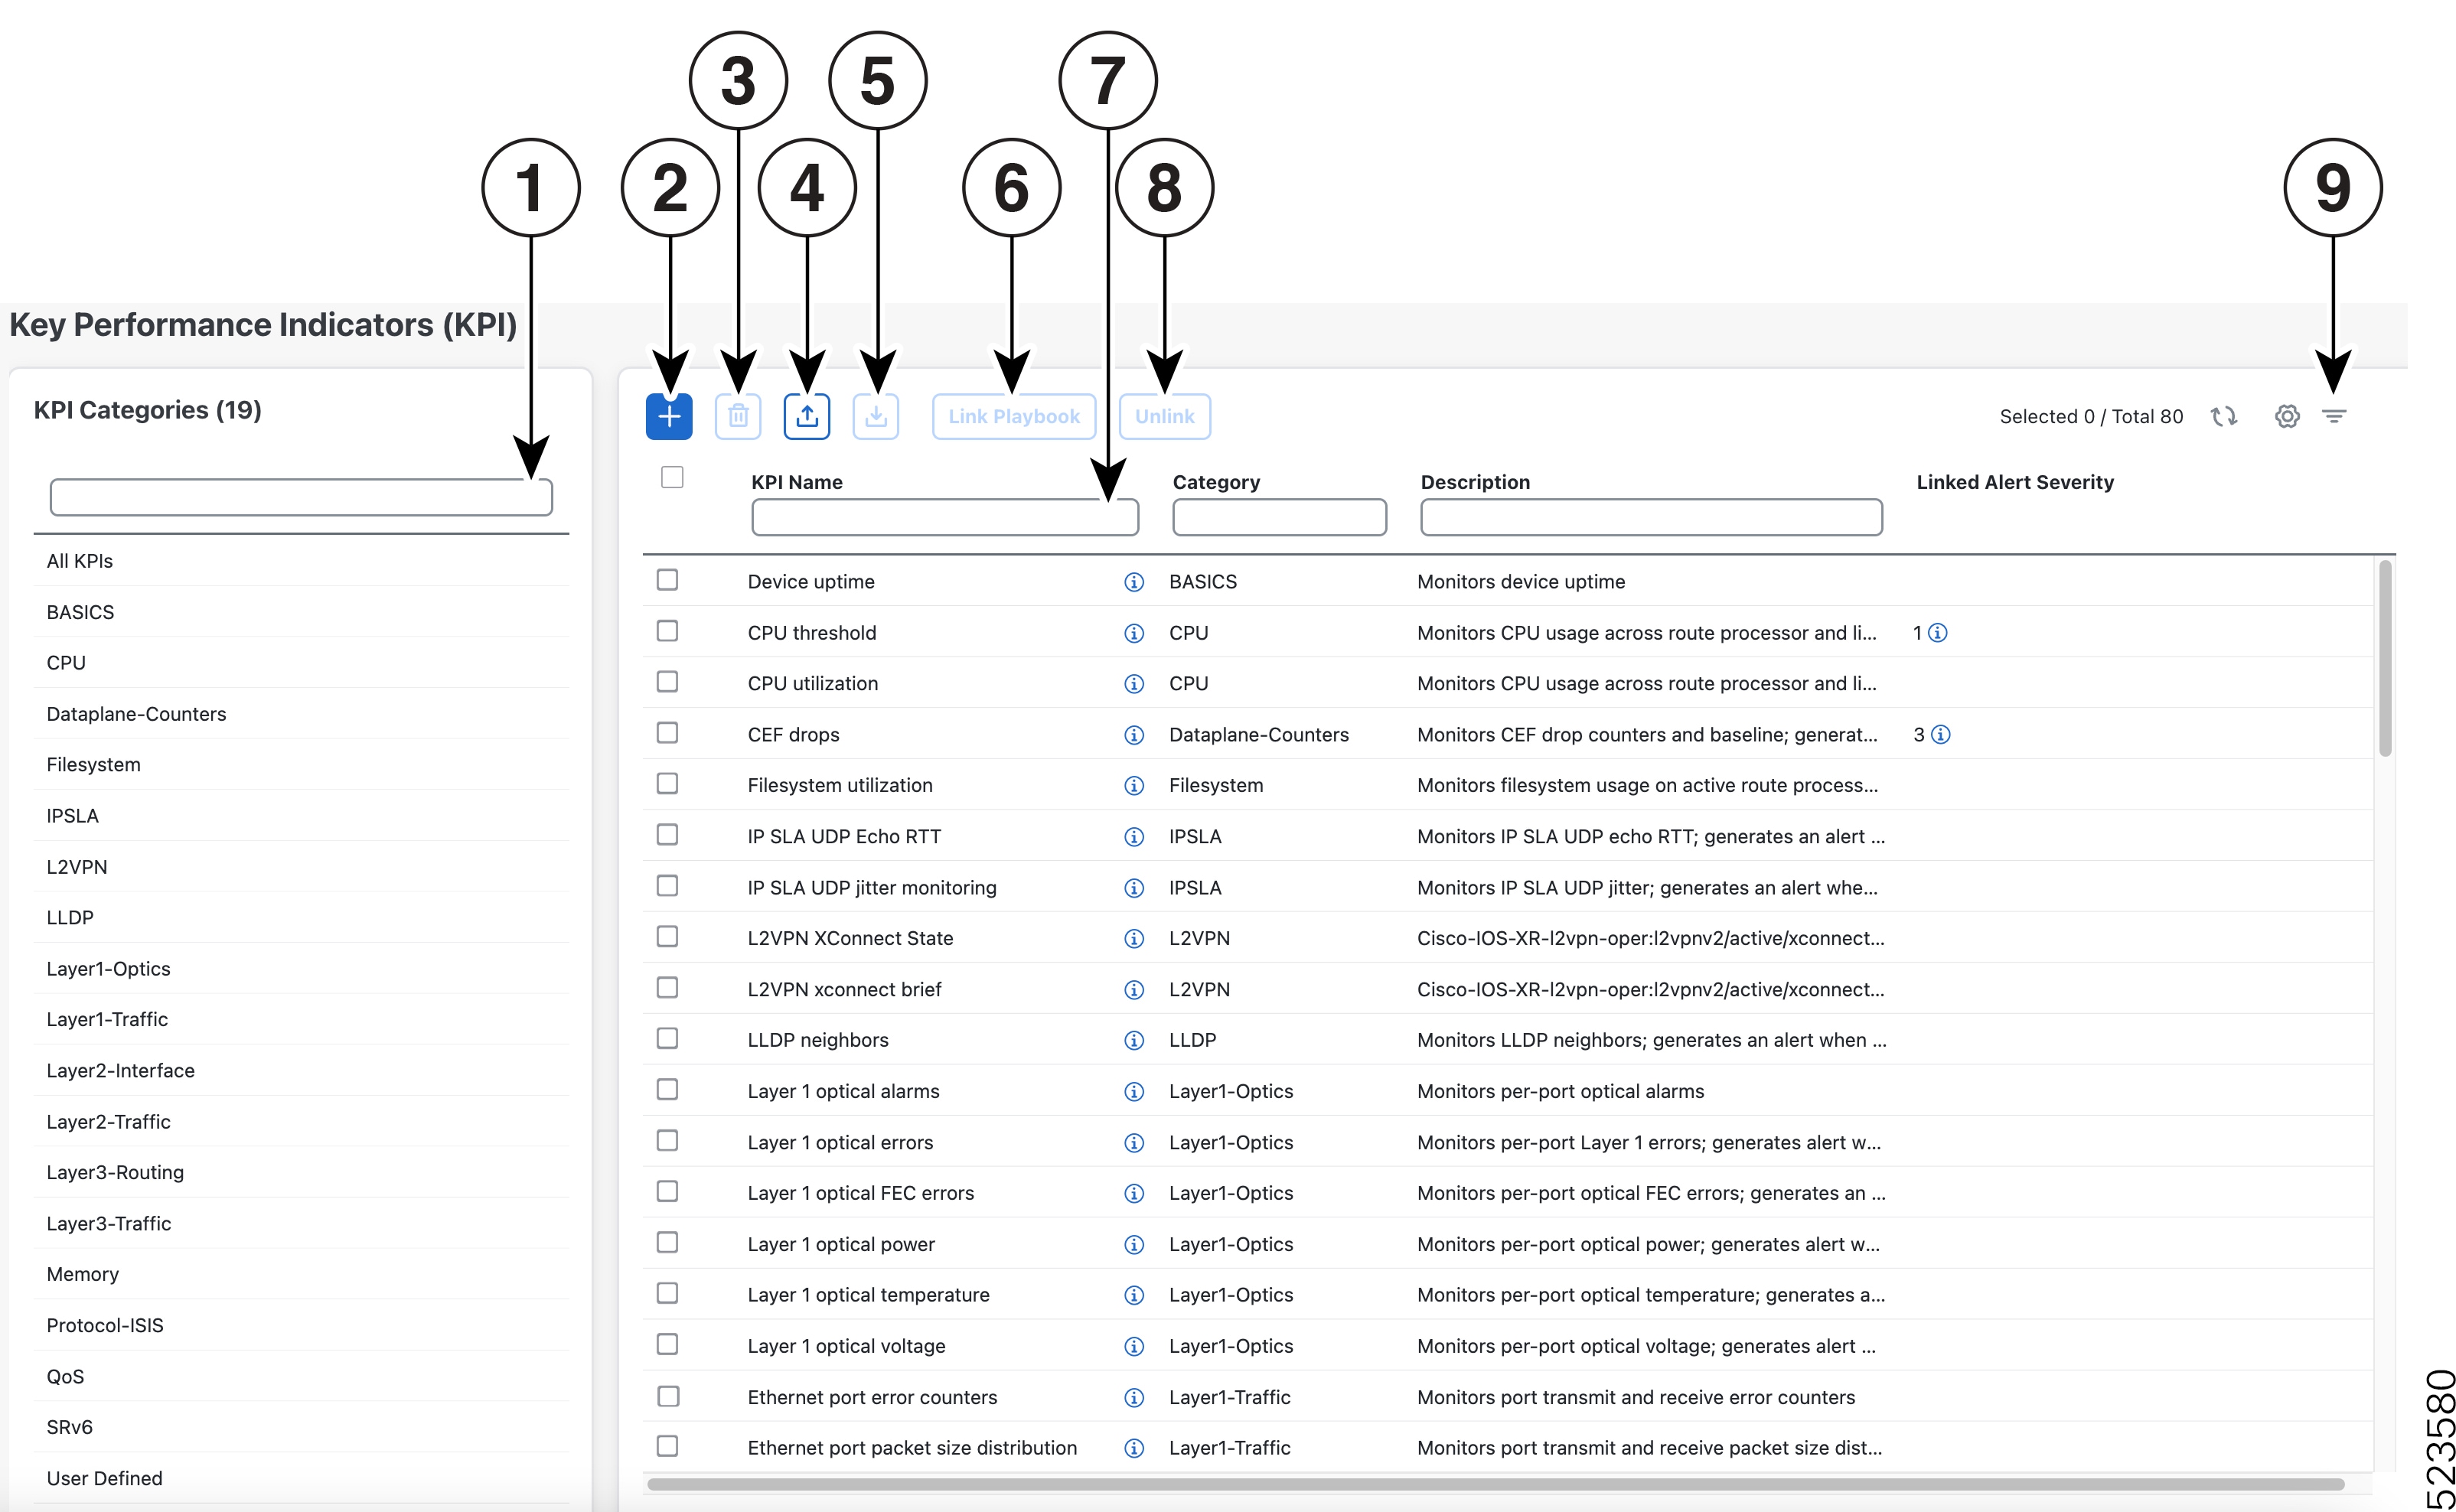
List of Health Insights KPIs
This section lists the prebuilt Health Insights KPIs supplied with Health Insights application.
Supported Protocols
The target device(s) must support the form of telemetry used by the KPI either SNMP, GNMI, or MDT. The application validates for a match between KPI and device telemetry capabilities.
Definition of the protocols:
-
Model-Driven Telemetry (MDT): Model-driven telemetry provides a mechanism to stream operational data from device as defined in the YANG model(s) to a data collector.
-
gRPC Network Management Interface (gNMI): gNMI provides the mechanism to install, manipulate, and delete the configuration of network devices, and also to view operational data.
-
Simple Network Management Protocol (SNMP): SNMP is an IP protocol for collecting and organizing information about managed devices on IP networks and for modifying that information to change device behavior.
-
Command Line Interface (CLI): CLI is used in network device management.
Health Insights uses either MDT or gNMI protocols but the device supports both. gNMI is a preferred default.
|
Category |
KPI Name | Description | Alerting | Protocol |
|---|---|---|---|---|
|
Dataplane-Counters |
CEF drops |
Monitors CEF drop counters and baseline. Generates an alert for an unusual number of drops. |
Rate Change |
MDT, gNMI |
|
CPU |
CPU threshold |
Monitors CPU usage across route policies and line cards on routers. Generates an alert when CPU utilization exceeds the configured threshold |
Two-Level Threshold |
MDT, gNMI |
|
CPU |
CPU utilization |
Monitors CPU usage across route policies and line cards on routers. Generates an alert when CPU utilization is unusual. |
Standard Deviation |
MDT, gNMI |
|
Basics |
Device uptime |
Monitors device uptime. |
Low Single Threshold |
MDT, gNMI |
|
Layer 1-Traffic |
Ethernet port error counters |
Monitors port transmit and receive error counters. |
Rate Change |
MDT, gNMI |
|
Layer 1-Traffic |
Ethernet port packet size distribution |
Monitors port transmit and receive packet size distributions. |
No Alert |
MDT, gNMI |
|
Layer 1-Traffic |
Ethernet port packet statistics |
Monitors port transmit and receive packet statistics. |
Standard Deviation of Rate Change |
MDT, gNMI |
|
Layer 2-Traffic |
Interface bandwidth monitor |
Monitors bandwidth utilization across all interfaces on a router. Generates an alert when bandwidth exceeds the configured threshold. |
Two-Level Threshold |
MDT, gNMI |
|
Layer 3-Traffic |
Interface counters by protocol |
Monitors interface statistics (such as incoming and outgoing packets or byte counters) organized by protocol. |
No Alert |
MDT, gNMI |
|
Layer2-Interface |
Interface flap detection |
Monitors interface flaps and alerts when flap count reaches set threshold. |
Two-Level Threshold |
MDT, gNMI |
|
Layer 2-Traffic |
Interface packet counters |
Monitors interface transmit and receive counters. Generates an alert when unusual traffic rates occur. |
No Alert |
MDT, gNMI |
|
Layer 2-Traffic |
Interface packet error counters |
Monitors interface transmit and receive error counters. Generates an alert when unusual error rates occur. |
Rate Change |
MDT, gNMI |
|
QOS |
Interface QoS (egress) |
Monitors interface QoS on the egress direction for queue statistics, queue depth, and so on. |
No Alert |
MDT, gNMI |
|
QOS |
Interface QoS (ingress) |
Monitors interface QoS on the ingress direction for queue statistics, queue depth, and so on. |
No Alert |
MDT, gNMI |
|
Layer 2-Traffic |
Interface rate counters |
Monitors interface statistics as rate counters. Generates an alert when unusual traffic rates occur. |
Standard Deviation |
MDT, gNMI |
|
IPSLA |
IP SLA UDP echo RTT |
Monitors IP SLA UDP echo RTT. Generates an alert when unusual RTT values occur. |
Standard Deviation |
MDT, gNMI |
|
IPSLA |
IP SLA UDP jitter monitoring |
Monitors IP SLA UDP jitter. Generates an alert when an abnormal UDP jitter occurs. |
Standard Deviation |
MDT, gNMI |
|
Layer 3-Routing |
IPv6 RIB BGP route count |
Monitors IPv6 RIB for route count and memory used by BGP. Generates an alert when an anomaly is detected (such as significant increase or decrease in route counts). |
Standard Deviation |
MDT, gNMI |
|
Layer 3-Routing |
RIB IS-IS route count |
Monitors RIB for route count and memory used by IS-IS. Generates an alert when an anomaly is detected (such as significant increase or decrease in route counts). |
Standard Deviation |
MDT, gNMI |
|
Layer 3-Routing |
IPv6 RIB IS-IS route count |
Monitors IPv6 RIB for route count and memory used by IS-IS. Generates an alert when an anomaly is detected (such as significant increase or decrease in route counts). |
Standard Deviation |
MDT, gNMI |
|
Layer 3-Routing |
IPv6 RIB OSPF route count |
Monitors IPv6 RIB for route count and memory used by OSPF. Generates an alert when an anomaly is detected (such as significant increase or decrease in route counts). |
Standard Deviation |
MDT, gNMI |
|
Protocol-ISIS |
ISIS neighbor summary |
Monitors ISIS neighbor summaries for changes in neighbor status. |
No Alert |
MDT, gNMI |
|
Layer 1-Optics |
Layer 1 optical alarms |
Monitors per-port optical alarms (current and past). |
No Alert |
MDT, gNMI |
|
Layer 1-Optics |
Layer 1 optical errors |
Monitors per-port Layer 1 errors. Generates an alert when error rates exceed the configured threshold. |
Rate Change |
MDT, gNMI |
|
Layer 1-Optics |
Layer 1 optical FEC errors |
Monitors per-port optical FEC errors. Generates an alert when FEC errors exceed the configured threshold. |
Rate Change |
MDT, gNMI |
|
Layer 1-Optics |
Layer 1 optical power |
Monitors per-port optical power. |
No Alert |
MDT, gNMI |
|
Layer 1-Optics |
Layer 1 optical temperature |
Monitors per-port optical temperature. |
No Alert |
MDT, gNMI |
|
Layer 1-Optics |
Layer 1 optical voltage |
Monitors per-port optical voltage. |
No Alert |
MDT, gNMI |
|
Layer 2-Interface |
Line state |
Monitors interface line states. |
No Alert |
MDT, gNMI |
|
LLDP |
LLDP neighbors |
Monitors LLDP neighbors. |
No Alert |
MDT, gNMI |
|
Memory |
Memory utilization |
Monitors memory usage across route processor and line cards on routers. Generates an alert when memory utilization is unusual. |
Standard Deviation |
MDT, gNMI |
|
Memory |
Memory utilization (cXR) |
Monitors memory usage across route processor and line cards on classic XR devices. Generates an alert when memory utilization is unusual. |
Standard Deviation |
MDT, gNMI |
|
Layer 3-Routing |
RIB BGP route count |
Monitors RIB for route count and memory used by BGP. Generates an alert when an anomaly is detected (such as significant increase or decrease in route counts). |
Standard Deviation |
MDT, gNMI |
|
Layer 3-Routing |
RIB connected route count |
Monitors RIB for route count and memory used by connected. Generates an alert when an anomaly is detected (such as significant increase or decrease in route counts). |
Standard Deviation |
MDT, gNMI |
|
Layer 3-Routing |
RIB IS-IS route count |
Monitors RIB for route count and memory used by IS-IS. Generates an alert when an anomaly is detected (such as significant increase or decrease in route counts) |
Standard Deviation |
MDT, gNMI |
|
Layer 3-Routing |
RIB local route count |
Monitors RIB for route count and memory used by local. Generates an alert when an anomaly is detected (such as significant increase or decrease in route counts). |
Standard Deviation |
MDT, gNMI |
|
Layer 3-Routing |
RIB OSPF route count |
Monitors RIB for route count and memory used by OSPF. Generates an alert when an anomaly is detected (such as significant increase or decrease in route counts). |
Standard Deviation |
MDT, gNMI |
|
Layer 3-Routing |
RIB static route count |
Monitors RIB for route count and memory used by static. Generates an alert when an anomaly is detected (such as significant increase or decrease in route counts). |
Standard Deviation |
MDT, gNMI |
|
Layer 3-Routing |
RIBv6 connected route count |
Monitors RIBv6 for route count and memory used by connected. Generates an alert when an anomaly is detected (such as significant increase or decrease in route counts). |
Standard Deviation |
MDT, gNMI |
|
Layer 3-Routing |
RIBv6 local route count |
Monitors RIBv6 for route count and memory used by local. Generates an alert when an anomaly is detected (such as significant increase or decrease in route counts). |
Standard Deviation |
MDT, gNMI |
|
Layer 3-Routing |
RIBv6 static route count |
Monitors RIBv6 for route count and memory used by static. Generates an alert when an anomaly is detected (such as significant increase or decrease in route counts). |
Standard Deviation |
MDT, gNMI |
|
Layer 3-Routing |
RIBv6 subscriber route count |
Monitors RIBv6 for route count and memory used by subscriber. Generates an alert when an anomaly is detected (such as significant increase or decrease in route counts). |
Standard Deviation |
MDT, gNMI |
|
Layer 2-Traffic |
SNMP interface packet error counters |
Monitors interface transmit and receive error counters. Generates an alert when unusual error rates occur. |
No Alert |
SNMP |
|
Layer 2-Traffic |
SNMP interface packet counters |
Monitors interface transmit and receive counters. |
No Alert |
SNMP |
|
Layer 2-Traffic |
SNMP interface rate counters |
Monitors interface statistics as rate counters. Generates an alert when unusual traffic rates occur. |
Standard Deviation Rate of Change |
SNMP |
|
Layer 2-Traffic |
Interface packet error counters (Openconfig) |
Monitors interface error counters; generates an alert when unusual error rates occur. This KPI uses openconfig-interfaces YANG model. |
Rate Change |
gNMI |
|
Layer 2-Traffic |
Interface rate counters (Openconfig) |
Monitors interface statistics (such as rate counters), and generates an alert when unusual traffic rates occur. |
Rate Change |
gNMI |
|
File System |
Filesystem Utilization |
Monitors filesystem usage on active route processor and generates an alert when filesystem utilization exceeds the configured threshold. |
Two-Level Threshold |
CLI |

 Feedback