Catalog
The Catalog allows you to view all the applications that you have installed or enabled on the Cisco DCNM. Few applications are installed and are operational by default, when you install the Cisco DCNM.
The following applications appears based on the Cisco DCNM Deployments:
-
Health Monitor (2.1)
-
PTP Monitoring (1.1)
-
Kibana (2.0)
-
Programmable report (1.1.0)
-
Elastic Service (1.1)
-
Compliance (4.0.0)
-
Debug Tools (2.1)
-
IPAM Integrator (1.0)
-
Endpoint Locator (2.1)
-
Kubernetes Visualizer (1.1)
-
vmmplugin (4.1)
 Note |
The applications started by default, or also installed on the DCNM utilizes infrastructure services are operational, by default. |
You can install more applications from the App Center, via the Web UI.
For instructions about downloading, adding, starting, stopping, and deleting applications from the Cisco DCNM Web UI, see Installing and Deploying Applications.
PTP Monitoring
This section explains the preview functionality of the Precision Time Protocol (PTP) monitoring. PTP is a time synchronization protocol for nodes that are distributed across a network. On a local area network, it achieves clock accuracy in the sub-nanosecond range, making it suitable for measurement and control systems.
In DCNM, PTP Monitoring can be installed as an application. From the DCNM Web UI, navigate to Applications and click PTP Monitoring. This application works in the IPFM mode only.
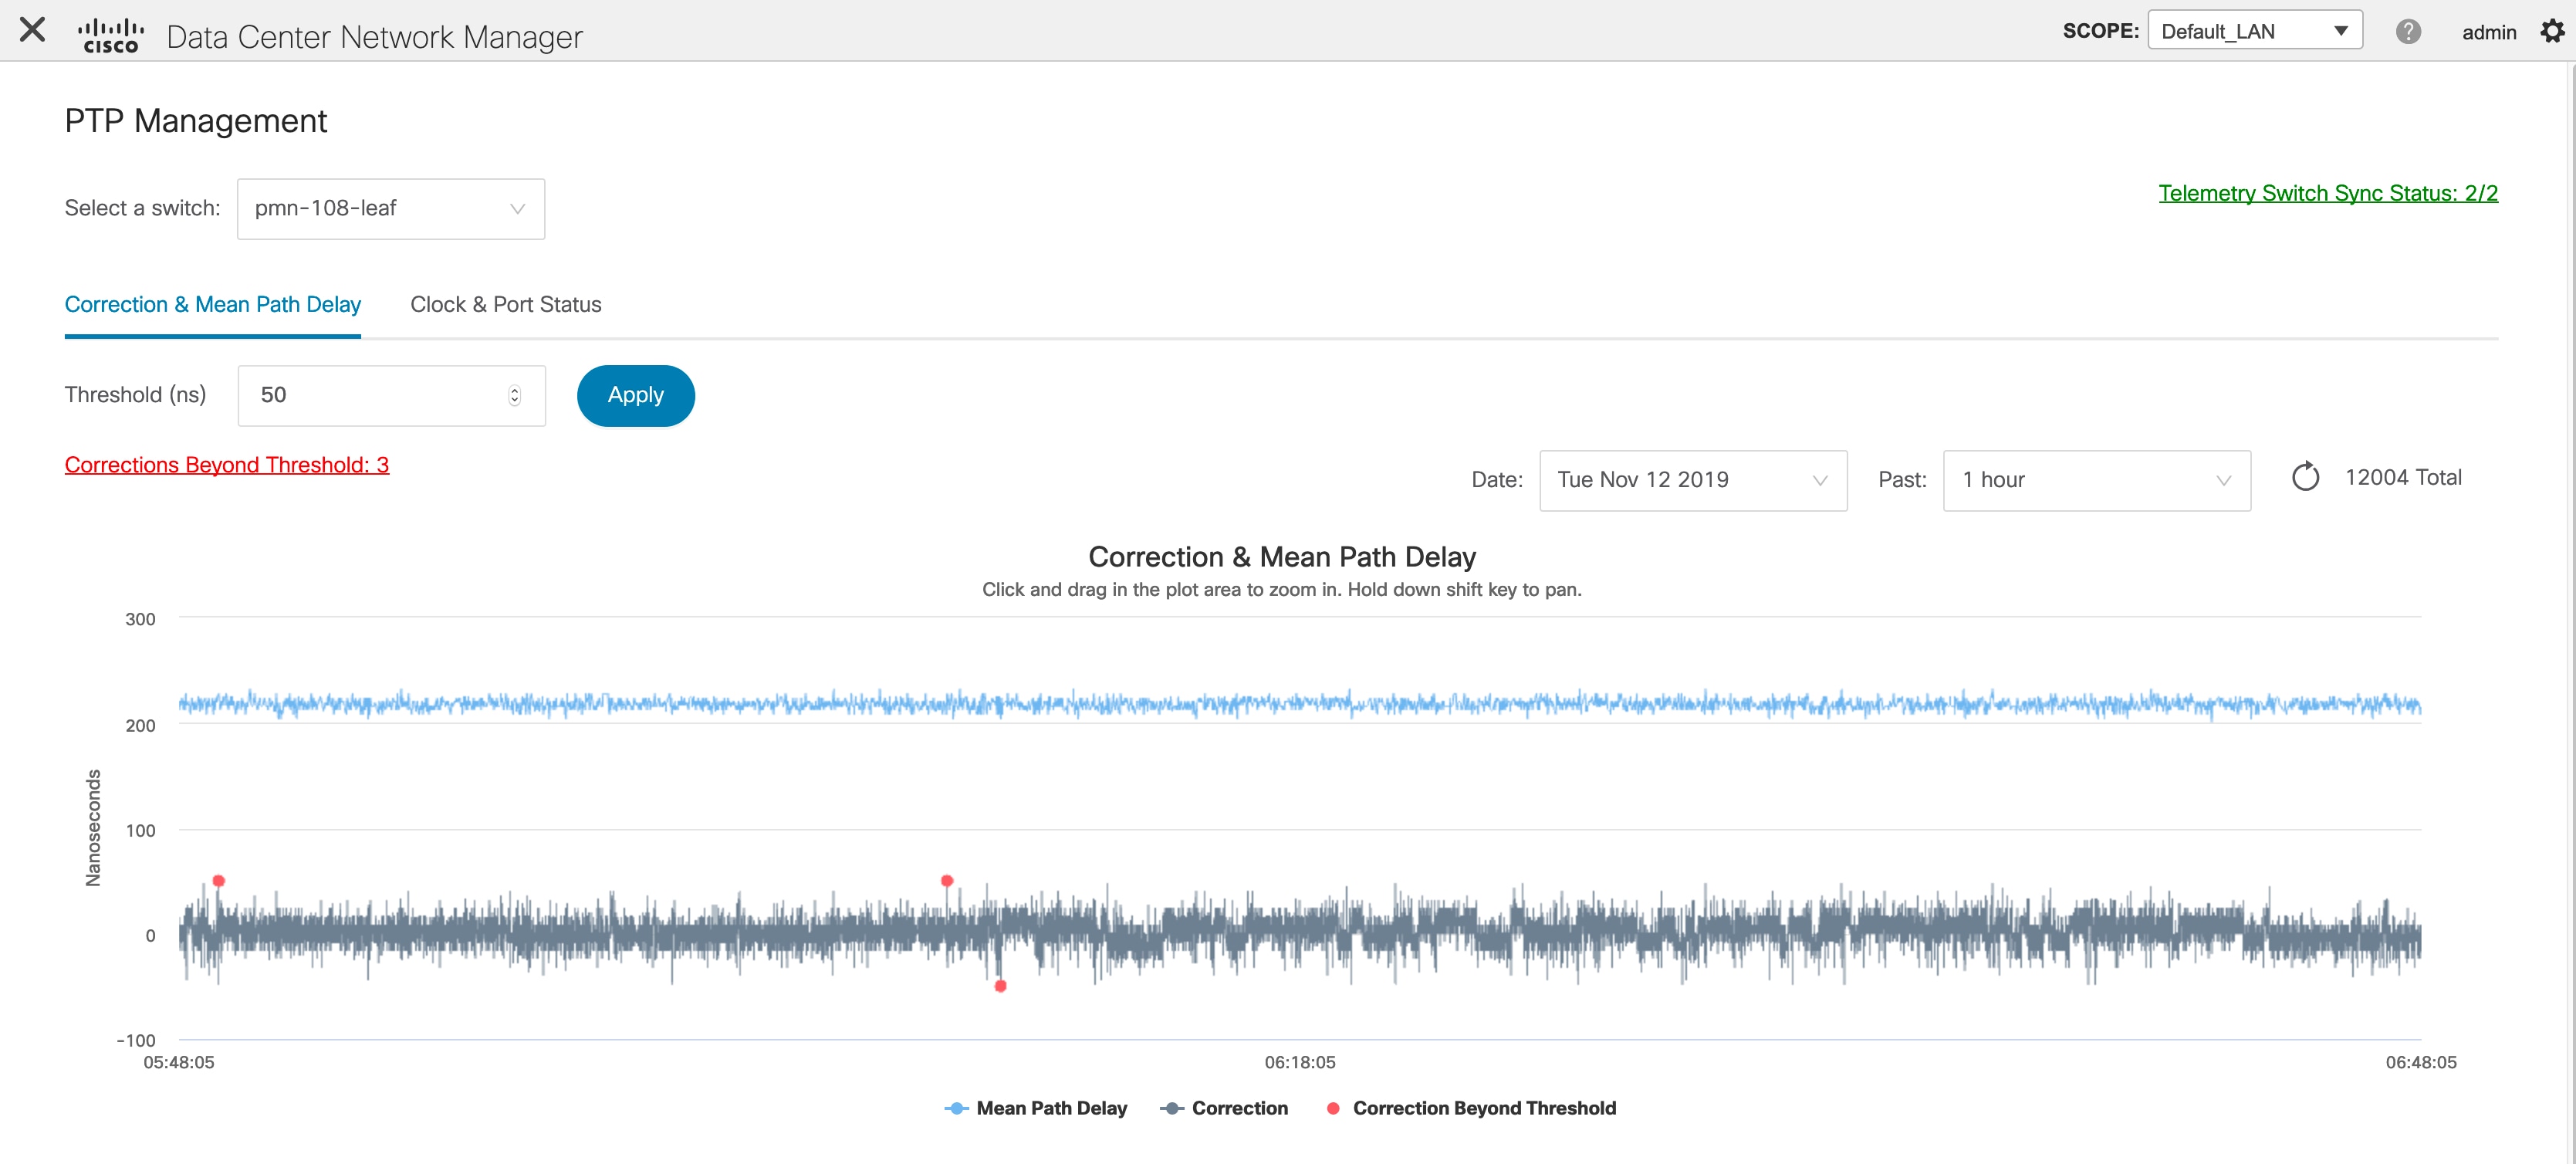
In the PTP Management window, you can view PTP related information based on the switch selected from the Select a switch drop-down list. You can click the Telemetry Switch Sync Status link to check whether the switches are in sync. The Sync Status column displays the status of the switches.
The following tabs are displayed in this window:
-
Correction & Mean Path Delay
-
Clock & Port Status
 Note |
The PTP related info is displayed for the switch group that you select from the SCOPE drop-down list. |

Correction and Mean Path Delay
The Correction & Mean Path Delay tab displays a graph showing the PTP operational statistics: mean path delay, correction, and correction beyond threshold. You can click and drag in the plot area to zoom in and hold the shift key to pan. Click the Reset zoom button to reset zoom.
By default, the graph is displayed for the threshold value of 500 nanoseconds (ns). You can also display data based on a specific threshold value. In the Threshold (ns) field, enter the required value in nanoseconds and click Apply. Note that the threshold value is persistent in the DCNM settings, and it is used to generate PTP correction threshold AMQP notifications.
From the Date drop-down list, you can select the appropriate date to view the data. The PTP data is stored up to the last seven (7) days. The default value for the stored data is 7 days. To change this value, navigate to Administration > DCNM Server > Server Properties and set the updated value for the pmn.elasticsearch.history.days property.
From the Past drop-down list, you can also select a timeframe over which the data has to be displayed. The values in the Past drop-down list are 1, 6, 12, and 24 hours.

Note that you can click the legends in the graph to hide or display statistics.
If there are any corrections, you can view them in a tabular format by clicking the Corrections Beyond Threshold link.

Clock and Port Status
The Clock & Port Status tab displays status for Parent Clock, Grandmaster Clock, and ports.

The Port Status table displays the status of the ports and the peer ports. Click the Search icon, and enter the port status, and click Search to filter the port status.
 Feedback