Overview
Troubleshoot SD‑WAN topologies and device templates in Firewall Management Center (FMC) using device template report, commands, and packet tracer.
Troubleshoot Device Templates
-
Use the Device Template Apply report for initial troubleshooting:
-
Check the errors mentioned in the report.
-
Review variable values and network object overrides values. Check for overlaps and incompatibilities.
-
Check model mappings to ensure if the correct model mappings exist. Delete or add mappings accordingly.
-
Verify if the device or template is locked because of tasks such as application or modification of the template.
-
See the Management Center audit logs to find any other issues and resolve them.
-
-
Use Audit Logs:
Logs related to application of the device template, configuration updates, device template creation, and deletion, are logged under audit logs. The device template audit logs are added to the log both at the start and at the end of the task to apply the template on the device.
An audit diff file is also generated that enables you to view configuration changes that have been done during application of the template on the device. To view the diff file:
-
Choose System > Monitoring > Audit.
The device template logs are logged under the subsystem Devices > Template Management.
-
Click the diff icon to open a new window that displays the configuration changes that have been done during the application of the template on the device.
-
Troubleshoot SD-WAN Topologies
After the deployment, use the following CLI commands and tools to debug issues related to route-based VPN tunnels on Threat Defense devices.
CLI and Debug Commands
| Command |
Description |
|---|---|
| ping |
Ping the outside IP address of the peer to the check the connectivity between the devices. |
| show vpnsession db |
Displays summary information about current VPN sessions. |
| debug crypto condition peer <peer-IP> |
Enable conditional debugging for a particular peer |
| debug vti 255 |
Debug the Virtual Tunnel Interface information. |
Packet Tracer
The Packet Tracer tool allows you to test policy configurations by modeling a packet with source and destination addresses, and protocol characteristics. Besides verifying your configuration, you can use this tool to debug unexpected behaviour, such as packets being denied access.
To use a packet tracer on Threat Defense devices, choose Devices > Packet Tracer. You must be an Admin or Maintenance user to use this tool.
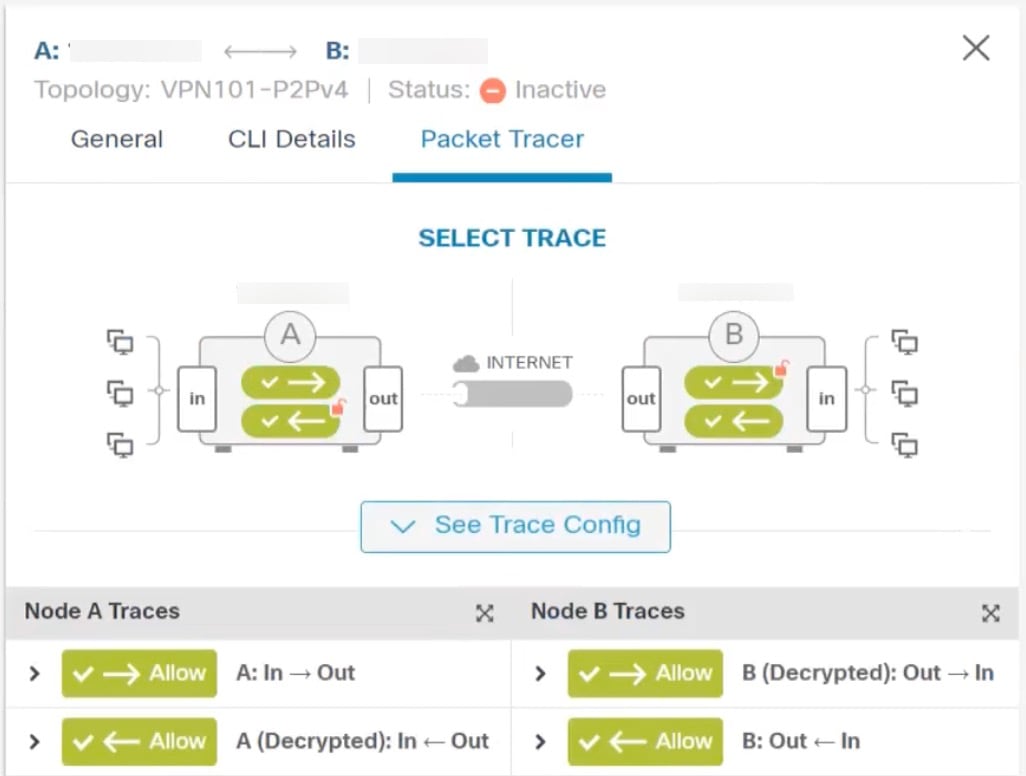
You can also use the Packet Tracer in the Site to Site VPN Dashboard to troubleshoot VPN tunnels between two Threat Defense devices.
-
Choose Overview > Dashboards.
-
For each tunnel, hover your cursor over a topology and click the View
 icon to view more information about the tunnels.
 -
Click the Packet Tracer tab.
-
Configure the parameters.
-
Click Trace Now.
-
After the trace completes, you can view the output of the trace with the results of each module.