- New and Changed
- Preface
- Overview
- Using the CFS Infrastructure
- Configuring System Message Logging
- Configuring Call Home
- Scheduling Maintenance Jobs
- Monitoring System Processes and Logs
- Configuring SNMP
- Configuring RMON
- Configuring Domain Parameters
- Monitoring Network Traffic Using SPAN
- Configuring Fabric Configuration Server
Cisco Fabric Manager System Management Configuration Guide
Bias-Free Language
The documentation set for this product strives to use bias-free language. For the purposes of this documentation set, bias-free is defined as language that does not imply discrimination based on age, disability, gender, racial identity, ethnic identity, sexual orientation, socioeconomic status, and intersectionality. Exceptions may be present in the documentation due to language that is hardcoded in the user interfaces of the product software, language used based on RFP documentation, or language that is used by a referenced third-party product. Learn more about how Cisco is using Inclusive Language.
- Updated:
- August 21, 2009
Chapter: Configuring System Message Logging
Configuring System Message Logging
This chapter describes how to configure system message logging on Cisco MDS 9000 Family switches. It includes the following sections:
•![]() System Message Logging Configuration
System Message Logging Configuration
About System Message Logging
You can monitor system messages by clicking the Events tab on Fabric Manager or by choosing Logs > Events > Current on Device Manager. You can also monitor system messages remotely by accessing the switch through Telnet, SSH, or the console port, or by viewing the logs on a system message logging server.

Note ![]() When the switch first initializes, the network is not connected until initialization completes. Therefore, messages are not redirected to a system message logging server for a few seconds.
When the switch first initializes, the network is not connected until initialization completes. Therefore, messages are not redirected to a system message logging server for a few seconds.
Log messages are not saved across system reboots. However, a maximum of 100 log messages with a severity level of critical and below (levels 0, 1, and 2) are saved in NVRAM.
Table 3-1 describes some samples of the facilities supported by the system message logs.
Table 3-2 describes the severity levels supported by the system message logs.
Note ![]() Refer to the Cisco MDS 9000 Family System Messages Reference for details on the error log message format.
Refer to the Cisco MDS 9000 Family System Messages Reference for details on the error log message format.
System Message Logging Configuration
System logging messages are sent to the console based on the default (or configured) logging facility and severity values.
This sections includes the following topics:
•![]() System Message Logging Servers
System Message Logging Servers
•![]() Verifying Syslog Servers from Fabric Manager Web Server
Verifying Syslog Servers from Fabric Manager Web Server
•![]() Viewing Logs from Fabric Manager Web Server
Viewing Logs from Fabric Manager Web Server
Message Logging Initiation
You can disable logging to the console or enable logging to a specific Telnet or SSH session.
•![]() When you disable or enable logging to a console session, that state is applied to all future console sessions. If you exit and log in again to a new session, the state is preserved.
When you disable or enable logging to a console session, that state is applied to all future console sessions. If you exit and log in again to a new session, the state is preserved.
•![]() When you enable or disable logging to a Telnet or SSH session, that state is applied only to that session. If you exit and log in again to a new session, the state is not preserved.
When you enable or disable logging to a Telnet or SSH session, that state is applied only to that session. If you exit and log in again to a new session, the state is not preserved.
To enable or disable the logging state for a Telnet or SSH session using Fabric Manager, follow these steps:
Step 1 ![]() Select a switch in the Fabric pane.
Select a switch in the Fabric pane.
Step 2 ![]() Expand Switches, expand Events and select SysLog in the Physical Attributes pane.
Expand Switches, expand Events and select SysLog in the Physical Attributes pane.
You see the SysLog information in the Information pane.
Step 3 ![]() Click the Switch Logging tab.
Click the Switch Logging tab.
You see the switch information shown in Figure 3-1.
Figure 3-1 Switch Logging Tab in Fabric Manager

Step 4 ![]() Select a switch in the Information pane.
Select a switch in the Information pane.
Step 5 ![]() Check (enable) or uncheck (disable) the Console Enable check box.
Check (enable) or uncheck (disable) the Console Enable check box.
Step 6 ![]() Click the Apply Changes icon.
Click the Apply Changes icon.
Console Severity Level
When logging is enabled for a console session (default), you can configure the severity levels of messages that appear on the console. The default severity for console logging is 2 (critical).

Tip ![]() The current critical (default) logging level is maintained if the console baud speed is 9600 baud (default). All attempts to change the console logging level generates an error message. To increase the logging level (above critical), you must change the console baud speed to 38400 baud.
The current critical (default) logging level is maintained if the console baud speed is 9600 baud (default). All attempts to change the console logging level generates an error message. To increase the logging level (above critical), you must change the console baud speed to 38400 baud.
To configure the severity level for a logging facility using Fabric Manager, follow these steps:
Step 1 ![]() Select a switch in the Fabric pane.
Select a switch in the Fabric pane.
Step 2 ![]() Expand Switches, expand Events and select SysLog in the Physical Attributes pane.
Expand Switches, expand Events and select SysLog in the Physical Attributes pane.
You see the SysLog information in the Information pane.
Step 3 ![]() Click the Switch Logging tab.
Click the Switch Logging tab.
You see the switch information shown in Figure 3-2.
Figure 3-2 Switch Logging Tab in Fabric Manager
Step 4 ![]() Select a switch in the Information pane.
Select a switch in the Information pane.
Step 5 ![]() Select a severity level from the Console Severity drop-down list in the row for that switch.
Select a severity level from the Console Severity drop-down list in the row for that switch.
Step 6 ![]() Click the Apply Changes icon.
Click the Apply Changes icon.
Module Logging
By default, logging is enabled at level 7 for all modules. You can enable or disable logging for each module at a specified level.
To configure the severity level for a logging facility, follow these steps:
Step 1 ![]() In Fabric Manager, expand Switches, expand Events and select SysLog in the Physical Attributes pane.
In Fabric Manager, expand Switches, expand Events and select SysLog in the Physical Attributes pane.
In Device Manager, choose Logs > Syslog > Setup and click the Switch Logging tab in the Syslog dialog box.
You see the switch information shown in Figure 3-3 or Figure 3-4.
Figure 3-3 Switch Logging Tab in Fabric Manager
Figure 3-4 Switch Logging Tab in Device Manager

Step 2 ![]() Check the check boxes where you want message logging to occur (ConsoleEnable, TerminalEnable, LineCardEnable).
Check the check boxes where you want message logging to occur (ConsoleEnable, TerminalEnable, LineCardEnable).
Step 3 ![]() Choose the message severity threshold from the Console Severity drop-down box for each switch in Fabric Manager (see Figure 3-3) or click the appropriate message severity level radio button in Device Manager (see Figure 3-4).
Choose the message severity threshold from the Console Severity drop-down box for each switch in Fabric Manager (see Figure 3-3) or click the appropriate message severity level radio button in Device Manager (see Figure 3-4).
Step 4 ![]() Click the Apply Changes icon in Fabric Manager, or click Apply in Device Manager to save and apply your changes.
Click the Apply Changes icon in Fabric Manager, or click Apply in Device Manager to save and apply your changes.
Log Files
Logging messages can be saved to a log file. You can configure the name of this file and restrict its size as required. The default log file name is messages. The file name can have up to 80 characters and the file size ranges from 4096 bytes to 4194304 bytes.
To send log messages to a file using Fabric Manager, follow these steps:
Step 1 ![]() Select a switch in the Fabric pane.
Select a switch in the Fabric pane.
Step 2 ![]() Expand Switches, expand Events and select SysLog in the Physical Attributes pane.
Expand Switches, expand Events and select SysLog in the Physical Attributes pane.
You see the SysLog information in the Information pane.
Step 3 ![]() Select a switch in the Information pane.
Select a switch in the Information pane.
Step 4 ![]() Click the Switch Logging tab.
Click the Switch Logging tab.
You see the information in Figure 3-5.
Figure 3-5 Switch Logging Tab in Fabric Manager
Step 5 ![]() Enter the name of the log file in the LogFile Name column in the row for that switch.
Enter the name of the log file in the LogFile Name column in the row for that switch.
Step 6 ![]() Click the Apply Changes icon.
Click the Apply Changes icon.
Note ![]() The configured log file is saved in the /var/log/external directory. The location of the log file cannot be changed.
The configured log file is saved in the /var/log/external directory. The location of the log file cannot be changed.
System Message Logging Servers
You can configure a maximum of three system message logging servers.
To send log messages to a UNIX system message logging server, you must configure the system message logging daemon on a UNIX server. Log in as root, and follow these steps:
Step 1 ![]() Add the following line to the /etc/syslog.conf file.
Add the following line to the /etc/syslog.conf file.
local1.debug /var/log/myfile.log
Note ![]() Be sure to add five tab characters between local1.debug and /var/log/myfile.log. Refer to entries in the /etc/syslog.conf file for further examples.
Be sure to add five tab characters between local1.debug and /var/log/myfile.log. Refer to entries in the /etc/syslog.conf file for further examples.
The switch sends messages according to the specified facility types and severity levels. The local1 keyword specifies the UNIX logging facility used. The messages from the switch are generated by user processes. The debug keyword specifies the severity level of the condition being logged. You can set UNIX systems to receive all messages from the switch.
Step 2 ![]() Create the log file by entering these commands at the UNIX shell prompt:
Create the log file by entering these commands at the UNIX shell prompt:
$ touch /var/log/myfile.log
$ chmod 666 /var/log/myfile.log
Step 3 ![]() Make sure the system message logging daemon reads the new changes by entering this command:
Make sure the system message logging daemon reads the new changes by entering this command:
$ kill -HUP ~cat /etc/syslog.pid~
Note ![]() Most tabs in the Information pane for features using CFS are dimmed until you click the CFS tab. The CFS tab shows which switches have CFS enabled and shows the master switch for this feature. Once the CFS tab is click, the other tabs in the Information pane that use CFS are activated.
Most tabs in the Information pane for features using CFS are dimmed until you click the CFS tab. The CFS tab shows which switches have CFS enabled and shows the master switch for this feature. Once the CFS tab is click, the other tabs in the Information pane that use CFS are activated.
You can configure a maximum of three syslog servers. One of these syslog servers should be Fabric Manager if you want to view system messages from the Event tab in Fabric Manager.
To configure system message logging servers, follow these steps:
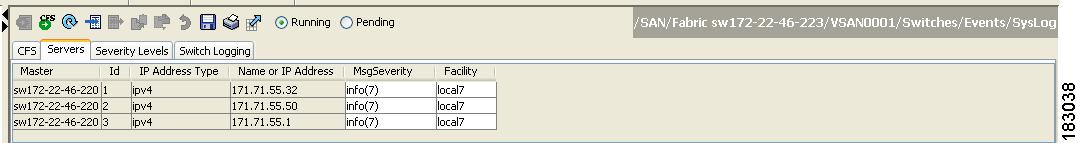
Step 1 ![]() In Fabric Manager, expand Switches, expand Events and select SysLog in the Physical Attributes pane, then click the Servers tab in the Information pane.
In Fabric Manager, expand Switches, expand Events and select SysLog in the Physical Attributes pane, then click the Servers tab in the Information pane.
Figure 3-6 Servers Tab in Fabric Manager Syslog
In Device Manager, choose Logs > Syslog > Setup and click the Servers tab in the Syslog dialog box.
Figure 3-7 Servers Tab in Device Manager Syslog
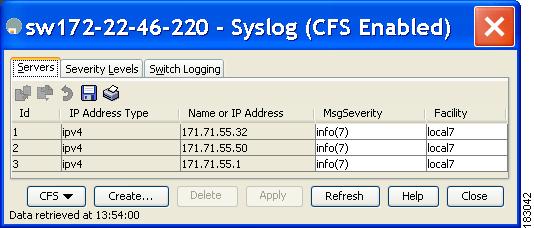
Step 2 ![]() Click the Create Row icon in Fabric Manager, or click Create in Device Manager (see Figure 3-7) to add a new syslog server.
Click the Create Row icon in Fabric Manager, or click Create in Device Manager (see Figure 3-7) to add a new syslog server.
Step 3 ![]() Enter the name or IP address in dotted decimal notation (for example, 192.168.2.12) of the syslog server in the Name or IP Address field.
Enter the name or IP address in dotted decimal notation (for example, 192.168.2.12) of the syslog server in the Name or IP Address field.
Step 4 ![]() Set the message severity threshold by clicking the MsgSeverity radio button and set the facility by clicking the Facility radio button.
Set the message severity threshold by clicking the MsgSeverity radio button and set the facility by clicking the Facility radio button.
Step 5 ![]() Click the Apply Changes icon in Fabric Manager, or click Create in Device Manager to save and apply your changes.
Click the Apply Changes icon in Fabric Manager, or click Create in Device Manager to save and apply your changes.
Device Manager allows you to view event logs on your local PC as well as those on the switch. For a permanent record of all events that occur on the switch, you should store these messages off the switch. To do this the MDS switch must be configured to send syslog messages to your local PC and a syslog server must be running on that PC to receive those messages. These messages can be categorized into four classes:
•![]() Hardware—Line card or power supply problems
Hardware—Line card or power supply problems
•![]() Link Incidents—FICON port condition changes
Link Incidents—FICON port condition changes
•![]() Accounting—User change events
Accounting—User change events
•![]() Events—All other events
Events—All other events
Note ![]() You should avoid using PCs that have IP addresses randomly assigned to them by DHCP. The switch continues to use the old IP address unless you manually change it; however, the Device Manager prompts you if it does detect this situation. UNIX workstations have a built-in syslog server. You must have root access (or run the Cisco syslog server as setuid to root) to stop the built-in syslog daemon and start the Cisco syslog server.
You should avoid using PCs that have IP addresses randomly assigned to them by DHCP. The switch continues to use the old IP address unless you manually change it; however, the Device Manager prompts you if it does detect this situation. UNIX workstations have a built-in syslog server. You must have root access (or run the Cisco syslog server as setuid to root) to stop the built-in syslog daemon and start the Cisco syslog server.
Verifying Syslog Servers from Fabric Manager Web Server
To verify the syslog servers remotely using Fabric Manager Web Server, follow these steps:
Step 1 ![]() Point your browser at the Fabric Manager Web Server.
Point your browser at the Fabric Manager Web Server.
Step 2 ![]() Choose Events > Syslog to view the syslog server information for each switch. The columns in the table are sortable.
Choose Events > Syslog to view the syslog server information for each switch. The columns in the table are sortable.
Outgoing System Message Logging Server Facilities
All system messages have a logging facility and a level. The logging facility can be thought of as where and the level can be thought of as what.
The single system message logging daemon (syslogd) sends the information based on the configured facility option. If no facility is specified, local7 is the default outgoing facility.
The internal facilities are listed in Table 3-1 and the outgoing logging facilities are listed in Table 3-3.
Viewing Logs from Fabric Manager Web Server
To view system messages remotely using Fabric Manager Web Server, follow these steps:
Step 1 ![]() Point your browser at the Fabric Manager Web Server.
Point your browser at the Fabric Manager Web Server.
Step 2 ![]() Click the Events tab followed by the Details to view the system messages. The columns in the events table are sortable. In addition, you can use the Filter button to limit the scope of messages within the table.
Click the Events tab followed by the Details to view the system messages. The columns in the events table are sortable. In addition, you can use the Filter button to limit the scope of messages within the table.
Viewing Logs from Device Manager
You can view system messages from Device Manager if Device Manager is running from the same workstation as the Fabric Manager Server. Choose Logs > Events > current to view the system messages on Device Manager. The columns in the events table are sortable. In addition, you can use the Find button to locate text within the table.
You can view switch-resident logs even if you have not set up your local syslog server or your local PC is not in the switch's syslog server list. Due to memory constraints, these logs will wrap when they reach a certain size. The switch syslog has two logs: an NVRAM log that holds a limited number of critical and greater messages and a nonpersistent log that contains notice or greater severity messages. Hardware messages are part of these logs.
Note ![]() When using the show logging command, output is displayed only when the configured logging levels for the switch are different from the default levels.
When using the show logging command, output is displayed only when the configured logging levels for the switch are different from the default levels.
Default Settings
Table 3-4 lists the default settings for system message logging.
 Feedback