- DMM User's Guide Preface
- DMM User's Guide Overview
- Understanding the Digital Media Manager
- Managing User Accounts
- Create Content Offering
- Creating Playlists
- Categorizing Content
- Customizing Video Portal
- Managing Deployments
- Config Settings
- Linking to the Video Portal
- Setting Up the DME 1000 and DME 2000 Encoders
- Setting Up Live Events Using a DME 1000 or DME 2000 Encoder
- Setting Up Live Events Using Third-Party Live Streams
- Archive and Delete
- Video Reports Metrics Overview
- DMM User's Guide Glossary
Video Reports Metrics Overview
The Video Portal Reports application is included on the Video Portal Appliance. This application records Page Views, Video Streams, Referrers, and Unique Visitors on the Video Portal.
•![]() Page Views are defined as any click in the Video Portal which causes the displayed information to change, but does not play a video stream, or change a playlist.
Page Views are defined as any click in the Video Portal which causes the displayed information to change, but does not play a video stream, or change a playlist.
•![]() Unique Visitors are tracked through a cookie and are counted on a daily basis; that is, if a person visits five times in a day, that constitutes one unique visitor. If a person visits once each day for a week, that constitutes seven unique visits.
Unique Visitors are tracked through a cookie and are counted on a daily basis; that is, if a person visits five times in a day, that constitutes one unique visitor. If a person visits once each day for a week, that constitutes seven unique visits.
•![]() Video Streams are counted when a visitor initially presses the Play button on the Video Portal.
Video Streams are counted when a visitor initially presses the Play button on the Video Portal.
•![]() Referrers are URLS to pages from which visitors linked into the video portal index page.
Referrers are URLS to pages from which visitors linked into the video portal index page.
Basic Usage Instructions
•![]() The reports can be found at http://<url to your video portal server>:8080/CvpMetrics/
The reports can be found at http://<url to your video portal server>:8080/CvpMetrics/
•![]() Viewing the SVG graphs in the reports requires either Firefox 1.5 or newer (natively supports SVG graphics) or Internet Explorer with the Adobe SVG plug-in installed.
Viewing the SVG graphs in the reports requires either Firefox 1.5 or newer (natively supports SVG graphics) or Internet Explorer with the Adobe SVG plug-in installed.
•![]() Navigate to the report you wish to view by clicking one of the left-hand navigational links.
Navigate to the report you wish to view by clicking one of the left-hand navigational links.
•![]() Choose either a date range (from the drop-down box) or a start date and end date.
Choose either a date range (from the drop-down box) or a start date and end date.
•![]() Click the Go button to show a report covering the chosen time period.
Click the Go button to show a report covering the chosen time period.
•![]() Per-Video traffic reports enable you to run metrics reports for a single video stream over a chosen time period.
Per-Video traffic reports enable you to run metrics reports for a single video stream over a chosen time period.
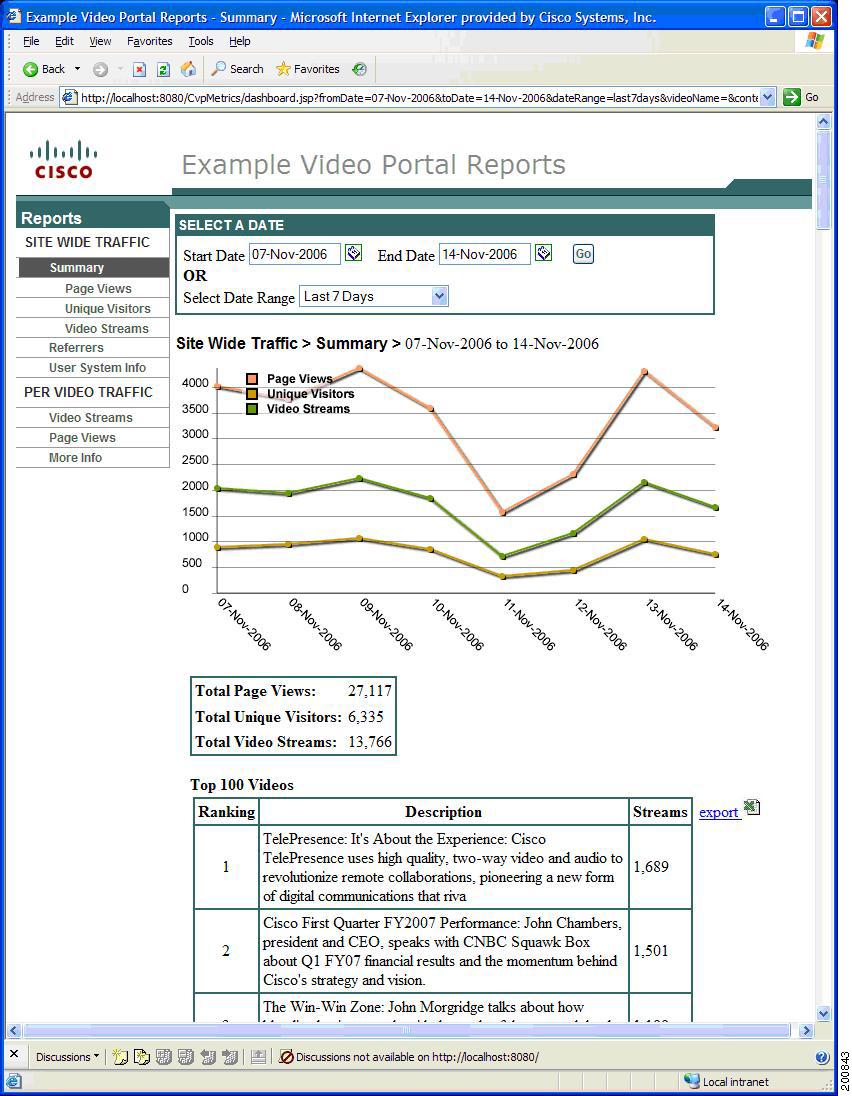
Figure 15-1 shows a sample report.
Figure 15-1 Sample Video Report
Viewing Individual Content Traffic
Figure 15-2 shows the Page View page, which displays data as a line graph indicating quantity and selected date range, and a table. You can export the table to a spreadsheet and then save it to a file using a "Save As" operation. Moving the cursor over a graph point displays the exact count.
Figure 15-2 Page View Page

Figure 15-3 shows the Unique Visitors page, which displays data as a line graph indicating quantity and selected date range, and as a table. You can export the table to a spreadsheet and then save it to a file using a "Save As" operation. Moving the cursor over a graph point displays the exact count.
Figure 15-3 Unique Visitors Page

Figure 15-4 shows the Video Streams page, which displays data as a line graph indicating quantity and selected date range, and as a table. You can export the table to a spreadsheet and then save it to a file using a "Save As" operation. Moving the cursor over a graph point displays the exact count.
Figure 15-4 Video Streams Page

Viewing Referral Information
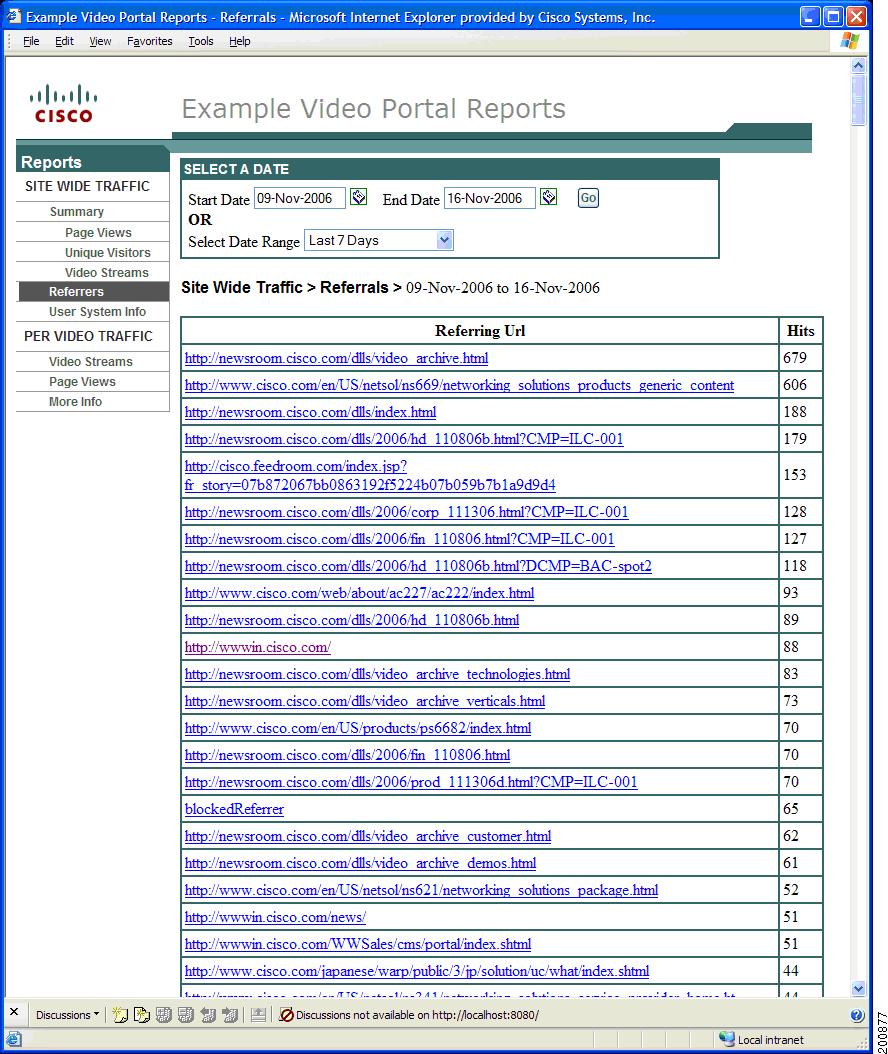
Figure 15-5 shows the Referrals page, which lists the referring URL of the web page from which a visitor came and the number of hits it received. Clicking on the URL forwards you to the web page.
Figure 15-5 Referrals Page
Viewing User System Information
Figure 15-6 shows the User System Info page, which uses a bar graph to show the specific number of visitors using a particular browser, operating system and plugins in a selected time period. Moving the cursor to the top of each bar shows you the exact count.
Figure 15-6 User System Info Page

Viewing Per-Video Traffic
Video Portal Reports also measures individual data for specific videos (Per-Video Traffic). You can view Video Streams and Page Views data of the specific video selected by entering the title or description of the video in the Search By Title field (see Figure 15-7.)
Figure 15-7 Per Video Traffic Page
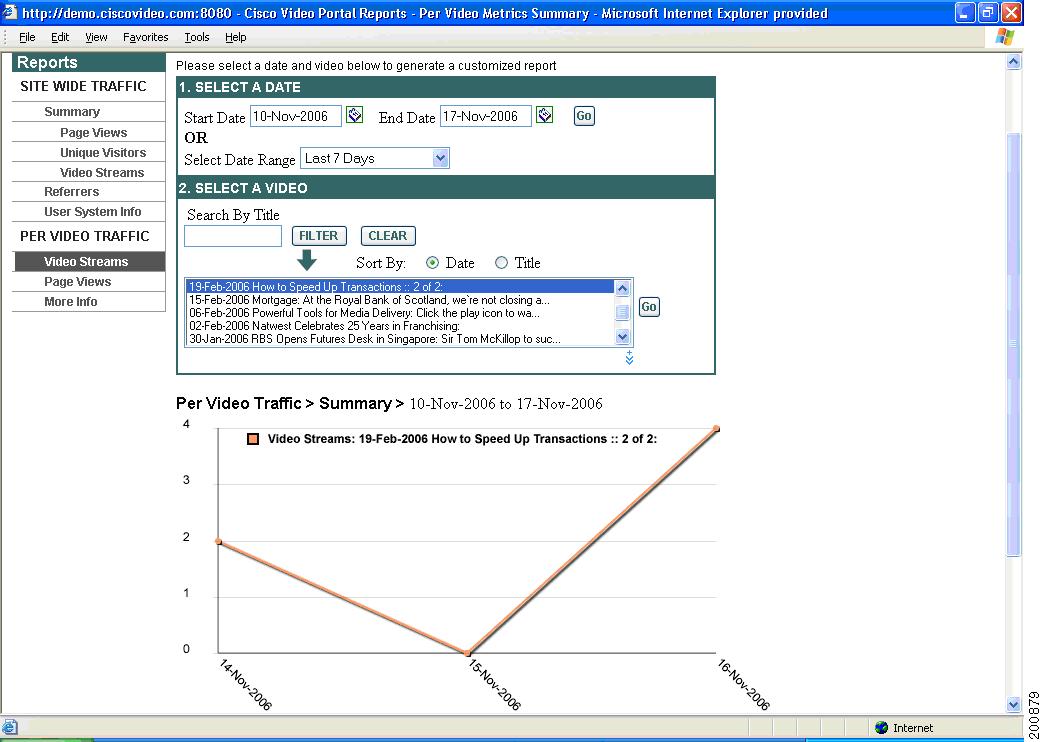
Figure 15-8 shows the More Info display, which shows how many visitors viewing the Video Portal are clicking on the More Info link. A specific video can also be selected to view results.
Figure 15-8 More Info Display

 Feedback