CAR Device Reports Results

This chapter describes report output information for each device report. The chapter contains the following topics:

Gateway Detail Report Results

The Gateway Detail report includes the following fields. See the table.

Table 1. Gateway Detail Report Fields

Field

Description

Date

The date when the call went through the gateway.

Orig. Time

The time when the call went through the gateway.

Term. Time

The time that the call terminated.

Duration(s)

The duration, in seconds, that the call was connected. The duration specifies the difference between the Dest Connect and the Dest Disconnect times.

Orig

The directory number from which the call was placed.

Dest

The directory number to which the call was originally placed. If the call was not forwarded, this directory number should match the Final Destination number. If the call was forwarded, this field contains the original destination number of the call before it was forwarded.

Orig. Codec

The codec code (compression or payload code) that the call originator used on its sending side during this call. This code may differ from the codec code that was used on its receiving side.

Dest. Codec

The codec code (compression or payload code) that the destination used on its sending side during this call. This code may differ from the codec code that was used on its receiving side.

Orig. Device

The device name of the device that placed the call. For incoming and tandem calls, this field specifies the device name of the gateway.

Dest Device

The device name of the device that received the call. For outgoing and tandem calls, this field specifies the device name of a gateway. For conference calls, this field specifies the device name of the conference bridge.

Orig QoS

QoS depicts the voice-quality grade that was achieved for the calls.

Dest QoS

The QoS category that was experienced by the receiver of the call.

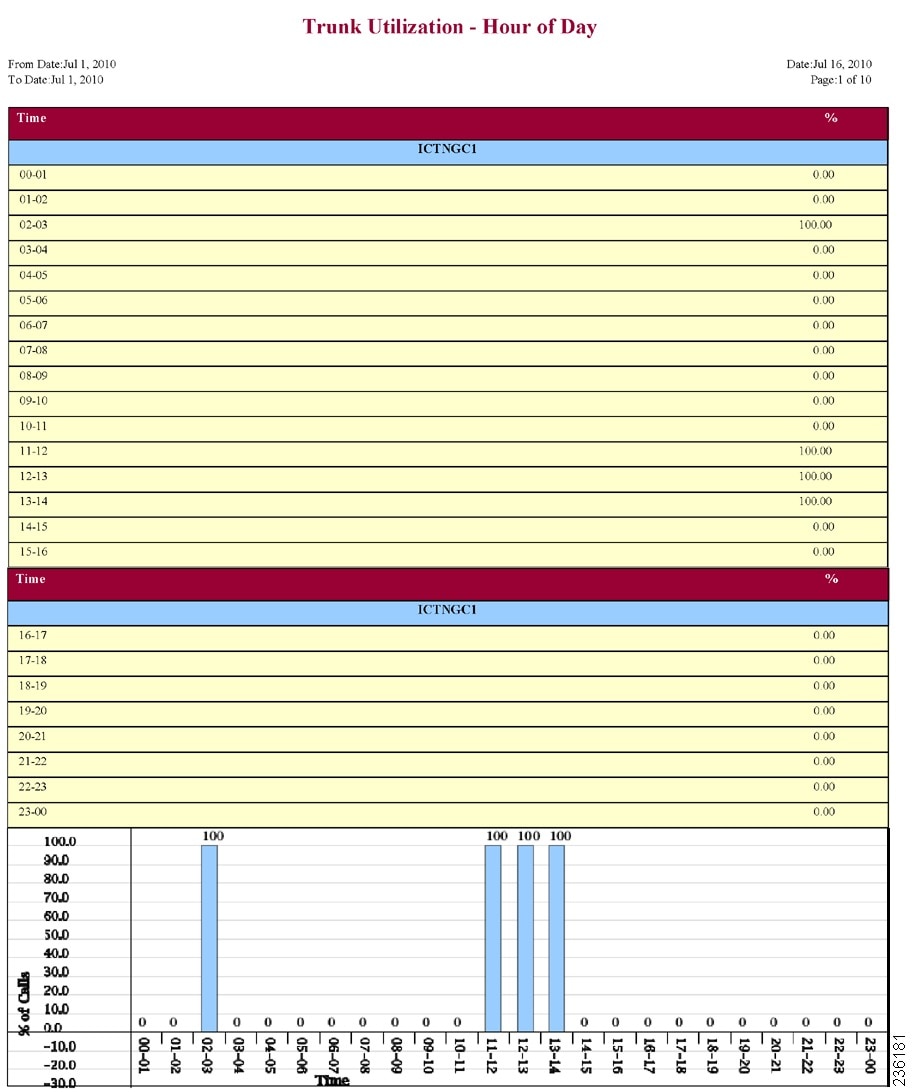
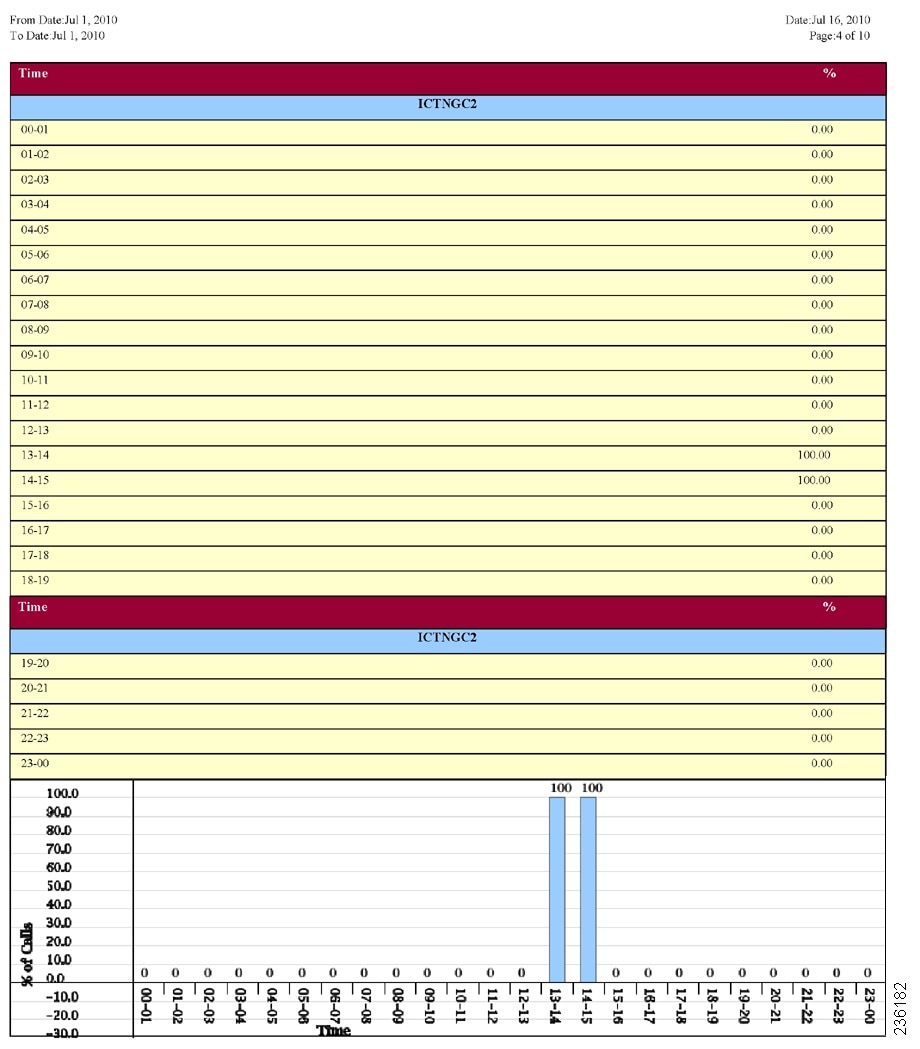
Figure 1 displays sample output of the Gateway Detail Report in PDF format.

Figure 1. Gateway Detail Report


Gateway Summary Report Results

The Gateway Summary report includes the following fields. See the following table.


Note

The Gateway Summary report segregates calls for each call classification that the user selects and divides the calls based on QoS type.


Table 2. Gateway Summary Report Fields

Field

Description

Call Classification

Shows the type of call (internal, incoming, and tandem.)

Quality of Service

Shows a summary of the performance of the various gateways with the total number of calls for each voice-quality category. The parameters set in the Define QoS Values provide the basis for all voice-quality categories.

  • Good - QoS for these calls specifies the highest possible quality.
  • Acceptable - QoS for these calls, although slightly degraded, still falls within an acceptable range.
  • Fair - QoS for these calls, although degraded, still falls within a usable range.
  • Poor - QoS for these calls was unsatisfactory.
  • NA - These calls did not match any criteria for the established QoS categories.

Calls

Shows the total calls for the particular call classification.

Duration (sec)

Shows the total duration for all the calls for the particular call classification.

The following figure displays sample output of the Gateway Summary Report in PDF format.

Figure 2. Gateway Summary Report


Gateway and Route Utilization Report Results

The Gateway, Route Group, Route List, and Route Pattern Utilization reports provide similar output. If you choose to display the report in PDF format, the report shows the utilization as a bar chart. A graph displays for each selected gateway or route group. See the table.

Table 3. Gateway and Route Utilization Report Fields

Field

Description

Time/Day

Time in one-hour blocks if you chose Hourly or one-day blocks if you chose weekly or monthly. The results show the utilization for each hour or day for the entire period that is shown in the from and to dates.

%

Gateway, route group, route list, or route pattern utilization percentage. This field gives the estimated utilization percentage of the gateways or route groups or route lists or route patterns relative to the total number of calls that all the gateways put together can support at any one time.

Figure 1 displays sample output of the Gateway Utilization Report in PDF format.

Figure 3. Gateway Utilization Report


Figure 2 displays sample output of the Route/Hunt List Utilization report in PDF format.

Figure 4. Route/Hunt List Utilization Report


Figure 3 displays sample output from the Route and Line Group Utilization report in PDF format.

Figure 5. Route and Line Group Utilization Report


Figure 4 displays sample output of the Route Pattern/Hunt Path Utilization report in PDF format.

Figure 6. Route Pattern/Hunt Path Utilization Report


Hunt Pilot Summary Report Results

The Hunt Pilot Summary report includes the following fields. See the table.

Table 4. Hunt Pilot Summary Report Fields

Field

Description

Time

Time in one-hour blocks if you chose Hourly or one-day blocks if you chose weekly or monthly. The results show the call details for each hour or day for the entire period that is shown in the from and to dates.

No.of Calls Presented/Received

Number of calls presented and received at the specified time duration/day.

Number of calls received = Number of calls handled + Number of calls abandoned + Number of calls Forwarded due to no Answer + Number of calls Forwarded due to Busy + Number of calls Failed.

No.of Calls Handled/Answered

Number of calls answered.

No.of Calls Abandoned (Not Answered nor Redirected)

Number of calls that went on/off hook but were never connected or answered.

No.of Calls Forwarded due to no Answer (FONA)

Number of calls that were forwarded due to no reply.

No.of Calls Forwarded due to Busy (FOB)

Number of calls that were forwarded since the receiving end was busy.

No.of Calls Failed

Number of calls that failed to go through.

Hunt Pilot Name

Lists the name of the available Hunt Pilots.

Line Number

List the line numbers of the hunt members.

Figure 1 displays sample output of the Hunt Pilot Summary report in PDF format.

Figure 7. Hunt Pilot Summary Report


Hunt Pilot Detail Report Results

The Hunt Pilot Detail report includes the following fields. See the table.

Table 5. Hunt Pilot Detail Report Fields

Field

Description

Date/Time connected

Date and Time when the call was received

Date/Time disconnected

Date and Time when the call ended

Duration

Time duration of the call

Calling Party

Directory number (DN) of the caller

Called Party

Hunt Pilot Directory number (DN)

Final Called Party Number

Directory Number where the call landed in the end. If the call is landed in Hunt Pilot, then it will show its member DN. Suppose the call forward is set from member DN to some other DN, it will show that DN where the call got forwarded.

The number of the hunt member is displayed only when the Show Line Group Member DN in finalCalledPartyNumber CDR Field is set to true. If the value is set to false, the Hunt Pilot DN is displayed in this field. For details on setting this parameter see, Service Parameters Configuration in Cisco Unified CM Administration Guide.

Dest. Device Name

Device identifier of the device that answered the call.

Call Answered

Indicates if the call was answered or not. Values could be Yes or No.

Call Abandoned

Indicates if the call was abandoned. Values could be Yes or No.

Call Forwarded Due to No Answer (FONA)

Indicates if the call was forwarded due to no reply. Values could be Yes or No.

Call Forwarded Due to Busy (FOB)

Indicates if the call was forwarded since the answering end was busy. Values could be Yes or No.

Call Failed

Indicates if the call failed to get through. Values could be Yes or No.

Call Reference

Identification number to trace the call. This is the globalcallid_callid value in the CDR database.

Figure 1 displays sample output of the Hunt Pilot Details report in the PDF format.

Figure 8. Hunt Pilot Details Report


Conference Call Detail Report Results

You can choose to generate Conference Call information in either a summary or a detailed report. The reports display the call details in a table when you generate the report in PDF format. The following tables show the fields in the Conference Call Detail and Summary reports. See the tables.


Note

The report criteria include the type of conference (ad hoc and/or meet-me) and the From and To date range.


Table 6. Conference Call Detail Summary Report Fields

Field

Description

Orig. Time

Time that the first participant enters the conference.

Term. Time

Time that the last participant leaves the conference.

No. of Participants

Number of participants in the conference.

Duration

Sum of the duration of individual participants in the conference in seconds.

Device Name

Names of the conference devices that were used.

Table 7. Conference Call Detail Report Fields

Field

Description

Conference Start Time

Time at which conference started.

Conference End Time

Time at which conference ended.

Connect Time

Time at which conference participants connected to conference.

Disconnect Time

Time at which conference participants disconnected from conference.

Duration

Total time of conference.

Directory Number

Directory number of participants.

Call Classification

Call types of conference (internal, incoming, and so on.)

Device Name

Names of the conference devices that were used.

QoS

Quality of service.

Figure 1 displays sample output of the Conference Call Details Summary report in PDF format.

Figure 9. Conference Call Details Summary Report


Conference Bridge Utilization Report Results

The Conference Bridge Utilization report provides the following fields. If you choose PDF format, the report shows the utilization as a table. See the table.

Table 8. Conference Bridge Utilization Report Fields

Field

Description

Time/Day

Time in one-hour blocks if you chose Hourly or one-day blocks if you chose day of week or daily.

% Usage

Conference bridge utilization percentage.

Conf. Bridge

The conference bridge device that is used to hold conference calls.

Type

Either hardware or software conference bridge.

Max Streams

The number of conferences that can be held at a time along with the number of people per conference.

Figure 1 displays sample output of the Conference Bridge Utilization report in PDF format.

Figure 10. Conference Bridge Utilization Report


Voice Messaging Utilization Report Results

The Voice Messaging Utilization report provides the following fields. See the table.

Table 9. Voice Messaging Utilization Report Fields

Field

Description

Time/Day

Time in one-hour blocks if you chose Hourly or one-day blocks if you chose day of week or daily.

% Usage

Voice-messaging percentage.

Voice Messaging Ports

The sum of the maximum number of ports for all the gateways under the route patterns that are configured for the voice-messaging systems and the entries in the Device table of Unified Communications Manager that have type Class as 8.

Voice Messaging Gateways

The originating or destination device name of the gateways under the route patterns that are configured for the voice-messaging systems.

Number of Ports

The number of ports that the voice-messaging gateway supports.

Figure 1 displays sample output of the Voice Messaging Utilization report in PDF format.

Figure 11. Voice Messaging Utilization Report


Trunk Utilization Report Results

The Trunk Utilization report provides the following fields. If you choose to display the report in PDF format, the report shows the utilization as a bar chart. A graph displays for each selected trunk. See the table.

Table 10. Trunk Utilization Report Fields

Field

Description

Time/Day

Time in one-hour blocks if you chose Hourly or one-day blocks if you chose weekly or monthly. The results show the utilization for each hour or day for the entire period that is shown in the from and to dates.

%

Trunk utilization percentage. This field gives the estimated utilization of the trunks relative to the total number of calls that passed through the devices.

Figure 1 to Figure 4 display sample output pages of the Trunk Utilization Report in PDF format.

Figure 12. Trunk Utilization Report Sample 1


Figure 13. Trunk Utilization Report Sample 2


Figure 14. Trunk Utilization Report Sample 3


Figure 15. Trunk Utilization Report Sample 4


Additional Documentation

  • Administration Guide for Cisco Unified Communications Manager

  • Cisco Unified Serviceability Administration Guide

  • Cisco Unified Communications Manager Call Detail Records Administration Guide