View Map Heirarchy on Detect and Locate
Uploading Maps to Cisco Spaces: Detect and Locate
One of the first setup tasks is uploading maps that are exported from Cisco Prime Infrastructure to Cisco Spaces: Detect and Locate. Typically, map data contains floor images, floor coordinates, access points (AP), calibration data, and details about APs on a floor.
Before you begin
If Cisco Spaces: Detect and Locate is launched through Cisco Spaces, maps are automatically synchronized into through Cisco CMX tethering.
Procedure
|
Step 1 |
Log in to Cisco Spaces: Detect and Locate. |
|
Step 2 |
From the left navigation pane, click Maps and then choose the Upload button. |
|
Step 3 |
Browse to the location where the maps are stored (on your computer). Select the maps that were previously exported from Cisco Prime Infrastructure. |
|
Step 4 |
Verify if the maps are uploaded successfully. |
Viewing the Map on Cisco Spaces: Detect and Locate
Procedure
|
Step 1 |
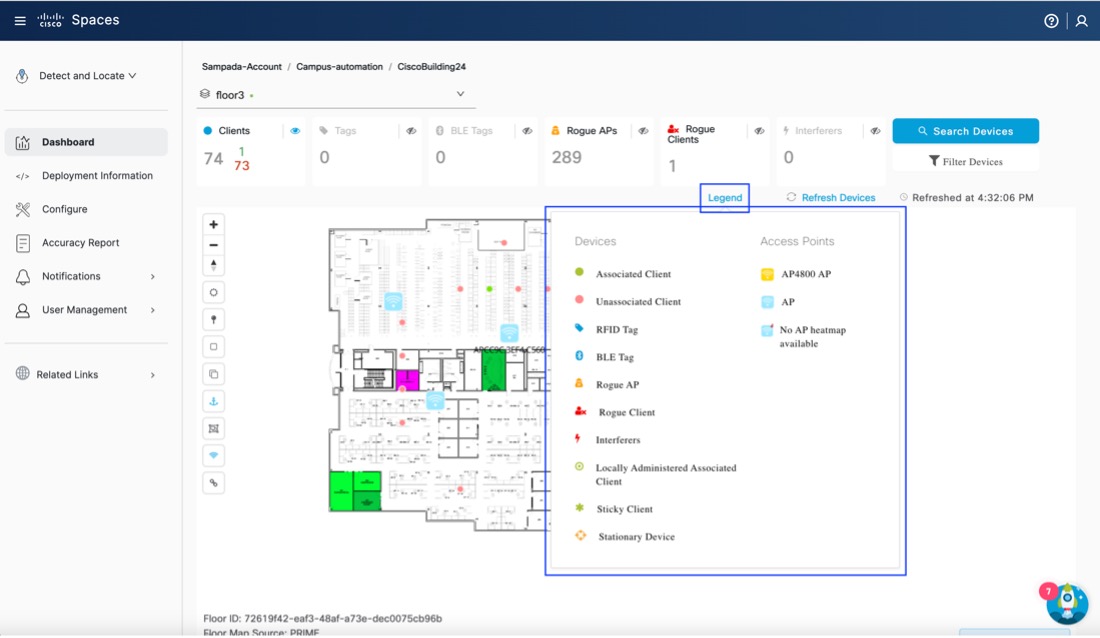
From the Cisco Spaces: Detect and Locate dashboard, use the drop-down list to navigate to the desired campus, building, and floor. 
|
||
|
Step 2 |
From the toolbar on the top, choose any combination of the icons to customize your view of the devices. 
|
||
|
Step 3 |
(Optional) Click the |
||
|
Step 4 |
Choose any combination of the following icons to enable or disable other elements on your dashboard, like zones, access points, and tags and heat maps. 
|
 icon to filter the displayed items. These filters are persistent and across sessions.
 : Show or hide the zones on a specific floor.
 : Show or hide all the APs that have been deployed on a specific floor. If the map has been uploaded to
  ) and which APs have issues with device location and hence may need troubleshooting.(
 )
)


Understand the Map Legend
-
A green dot
 indicates connected clients. Click to see additional details of a client.
-
A red dot
 indicates probing clients. Click to see additional details about a client.
-
A dot associated with a number
 indicates a cluster of probing clients. Click to view details of all the clients in that cluster. You can also zoom in to
view the clients individually.
indicates a cluster of probing clients. Click to view details of all the clients in that cluster. You can also zoom in to
view the clients individually.
-
Locally Administered Associated Client
-
Sticky Client
-
Stationary Device
Customize the Devices Viewed
The toolbar on the top lists the various types of devices. A device is represented by a name, icon, and a corresponding number
that indicates the number of such devices on your network. Use the  icon beside each device to show or hide a particular type of device, so that you customize your view of the devices.

The devices represented on this toolbar are described below:
-
Clients: All client devices. You can see the breakdown of this number into connected and detected devices.
Figure 9. Connected and Detected Devices 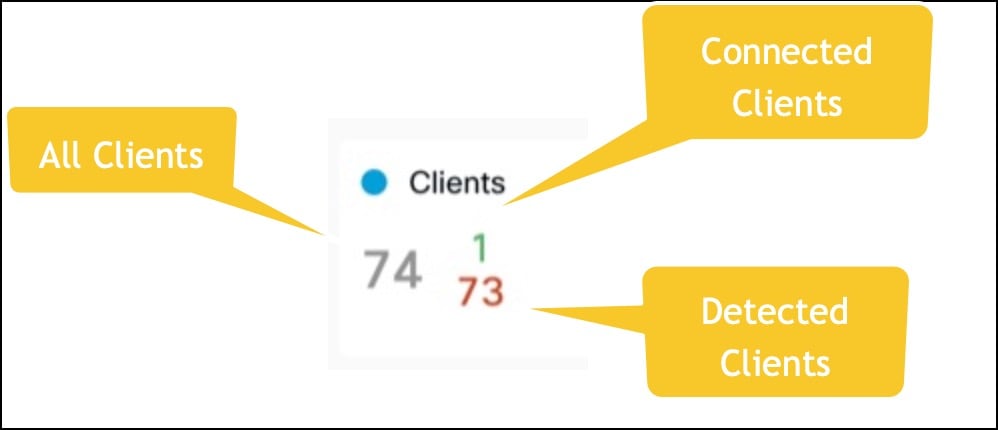
-
Tags: Vendor-specific information that is related to Wi-Fi tags are displayed in raw format.
-
BLE Tags: Bluetooth Low Energy tags attached to track devices.
-
Rogue APs: APs that are not part of or managed by the Cisco CMX infrastructure. Click to see additional details.
-
Rogue Clients: Clients that are connected to rogue access points.
-
Interferers: Devices that can create a radio frequency interference. .
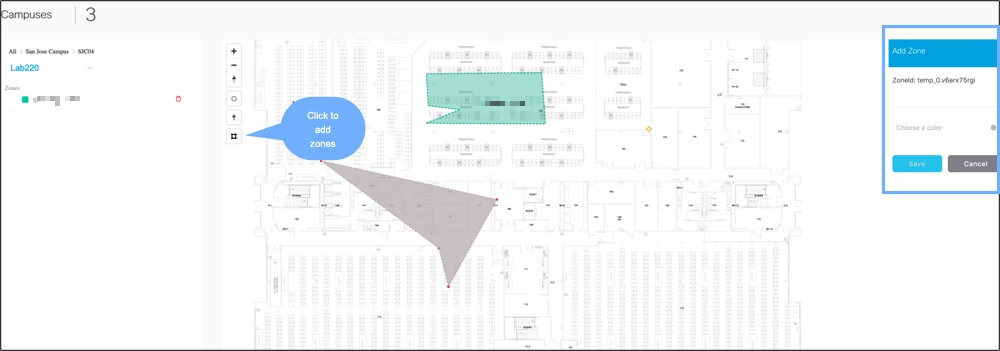
Create Zones
From the left navigation pane, click Maps, and browse to the location where you need to create a zone. Click the Create a Zone icon from the toolbar to the left and click on the map to create the zone boundaries. You can double-click to complete the creation of the zone. Add a name for the zone after placing it on the map. You can zoom into the zone and view it.
 Feedback