语料库选择器

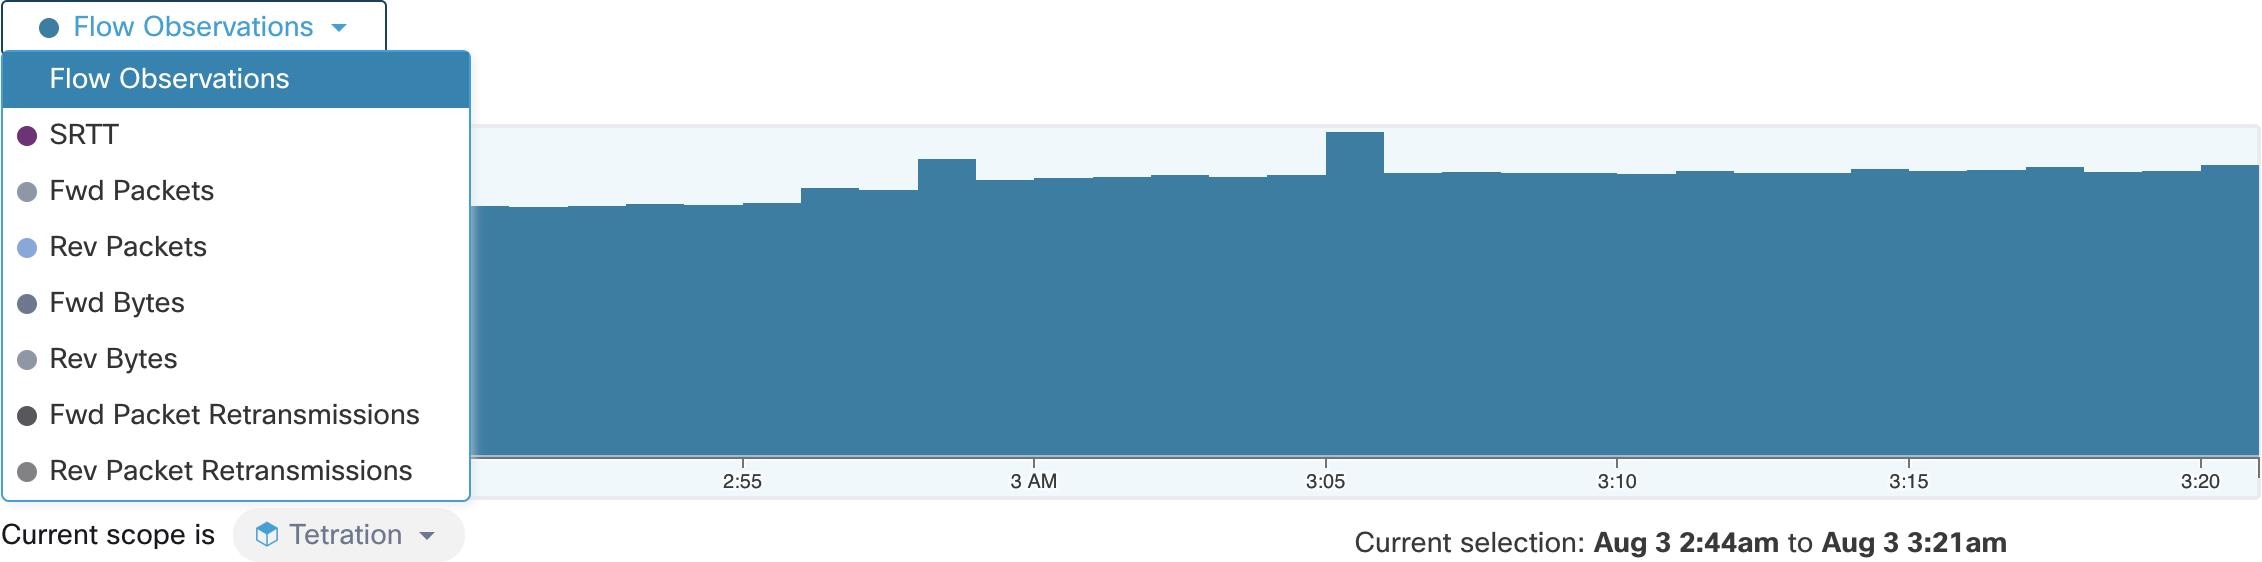
这是整个语料库的当前范围的未过滤摘要时间序列数据。此组件的目的是让您了解正在查看的日期范围,并通过在组件内拖动来轻松更改日期范围。图表中的数据可用于确定选择哪个时间范围。您可以选择要显示的不同指标,默认情况下会显示流观察结果的计数。
语料库选择器目前最多可以支持选择大约 20 亿个流观察结果。
此产品的文档集力求使用非歧视性语言。在本文档集中,非歧视性语言是指不隐含针对年龄、残障、性别、种族身份、族群身份、性取向、社会经济地位和交叉性的歧视的语言。由于产品软件的用户界面中使用的硬编码语言、基于 RFP 文档使用的语言或引用的第三方产品使用的语言,文档中可能无法确保完全使用非歧视性语言。 深入了解思科如何使用包容性语言。
思科可能会在某些地方提供本内容的当地语言翻译版本。请注意,翻译版本仅供参考,如有任何不一致之处,以本内容的英文版本为准。
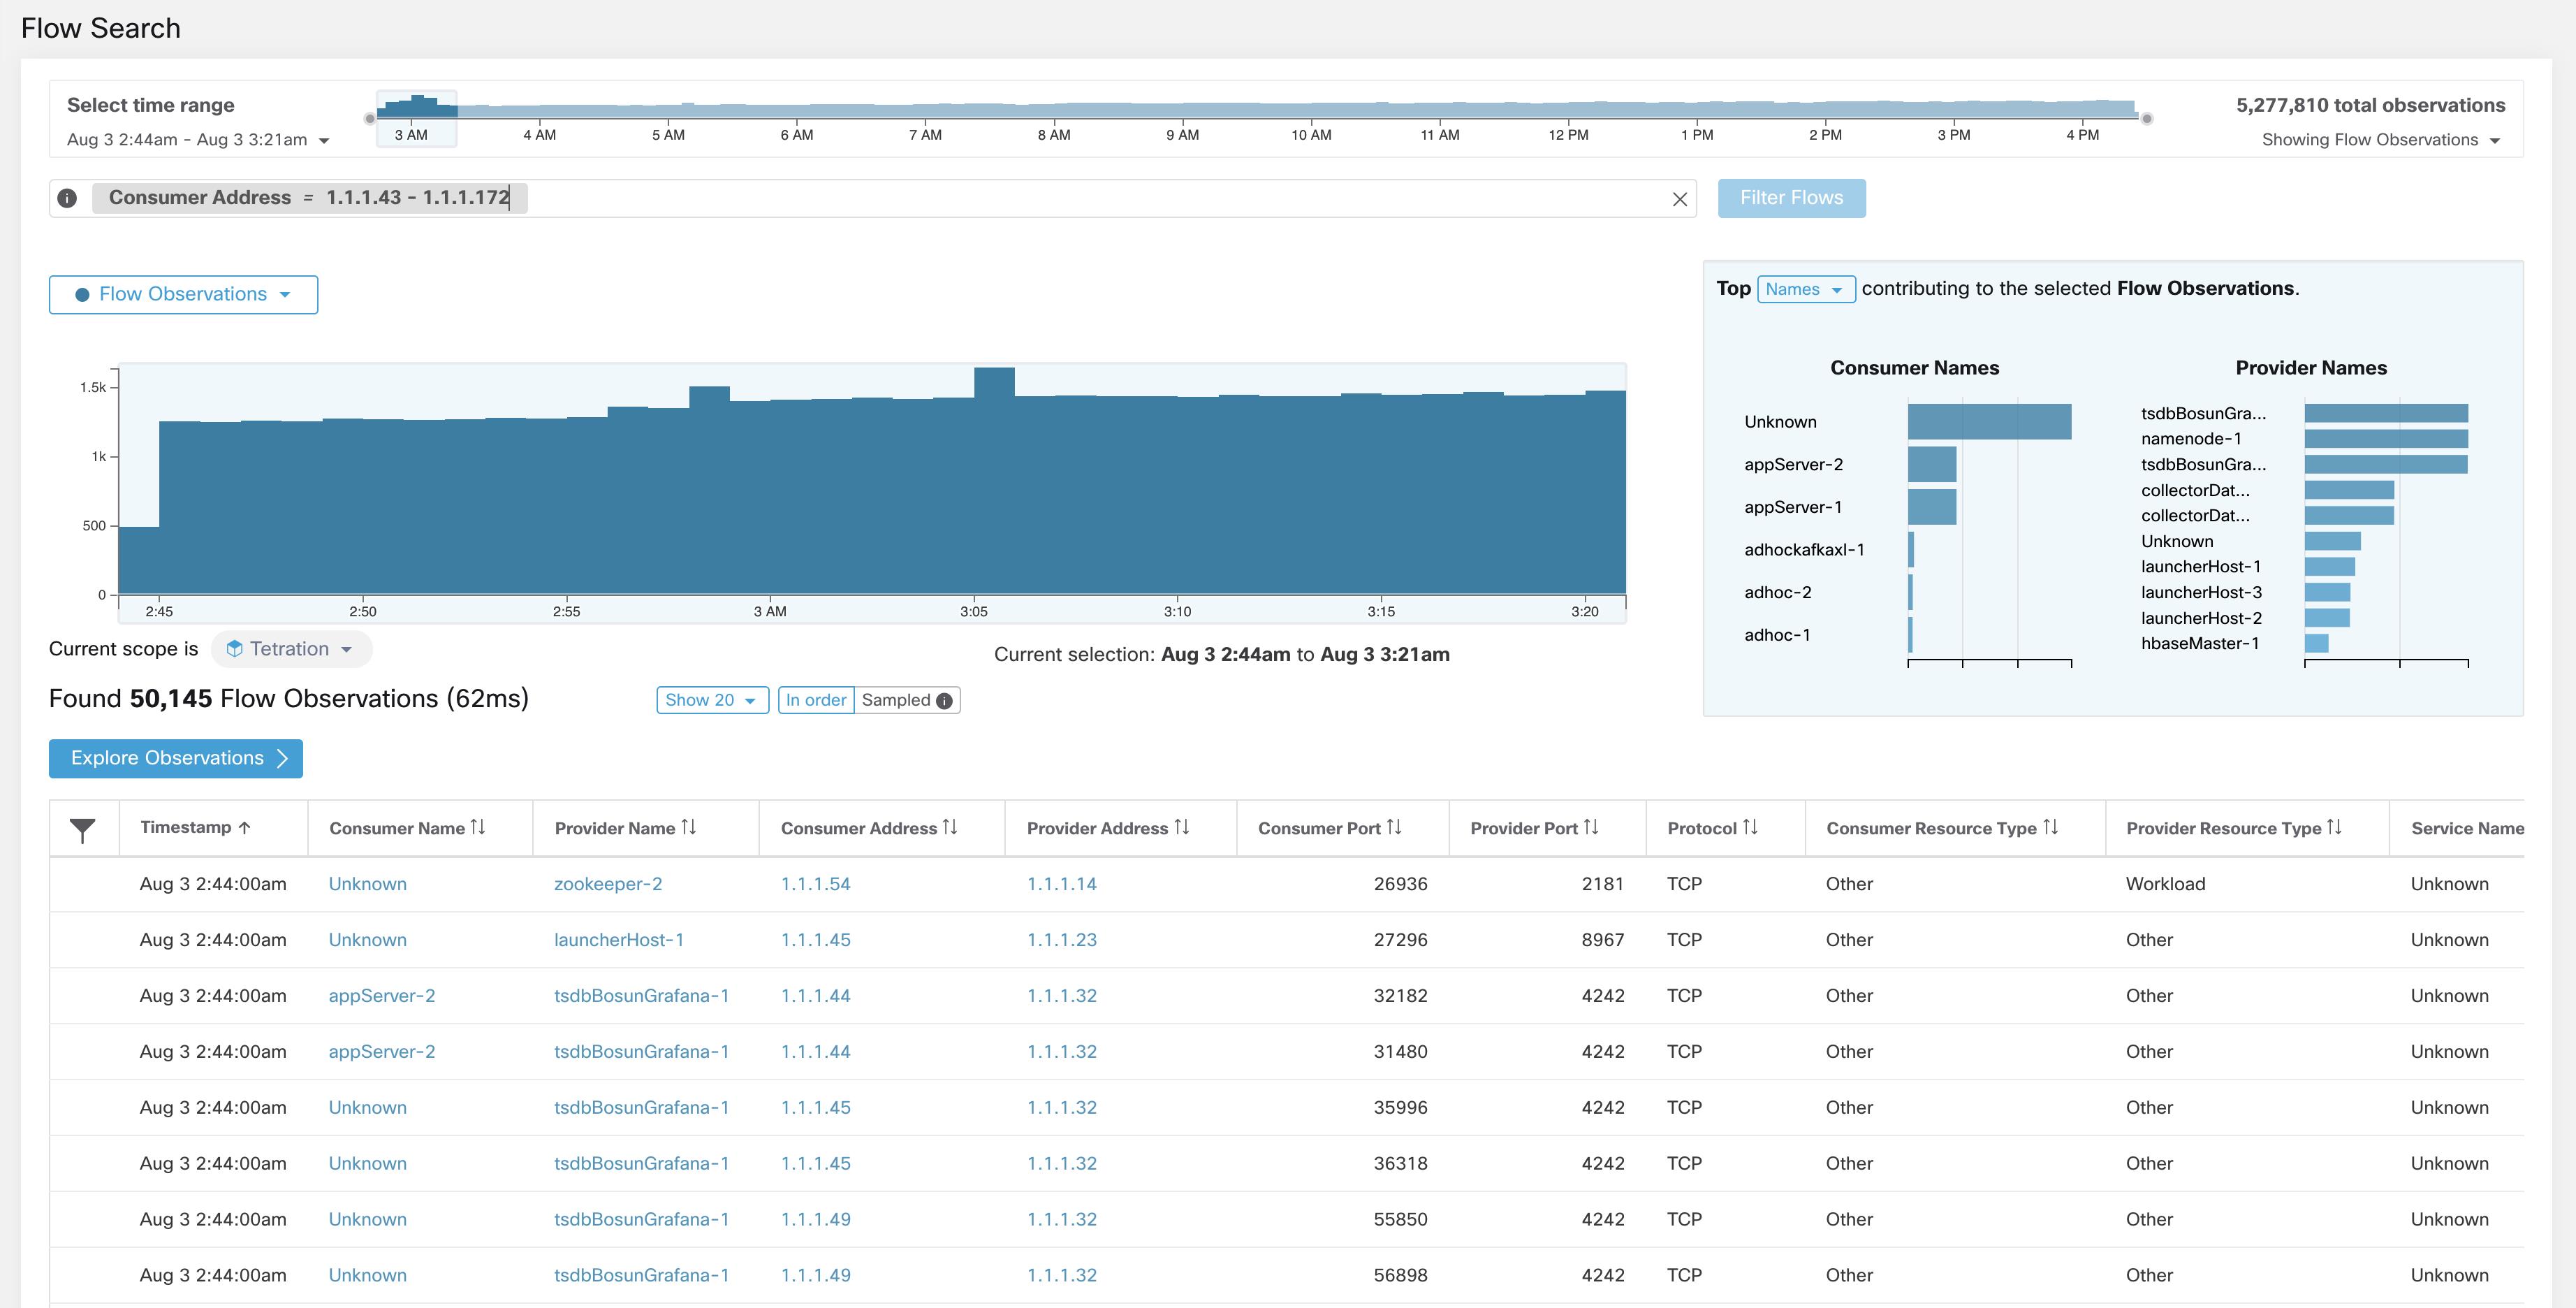
在 Cisco Secure Workload UI 的导航窗格中,选择),从而转到“流搜索”(Flow Search) 页面。此页面提供了快速过滤和深入研究流语料库的方法。基本单位是流观察结果,即每个唯一流的每分钟汇聚。流的两端称为使用者和提供者,使用者发起流,而提供者响应使用者(例如分别为客户端和服务器)。每个观察结果都会跟踪流在该分钟间隔内每个方向上的数据包数、字节数和其他指标。除了快速过滤之外,还可以使用探索观察结果来直观地探索流。点击生成的流观察结果列表,即可查看该流的详细信息,包括该流生命周期内的延迟、数据包和字节数。
 警告 |
对于使用深度可视性代理或执行代理检测的主机,Cisco Secure Workload 能够将流数据与提供或使用流的进程相关联。因此,用于启动进程的完整命令行参数(可能包括数据库或 API 凭证等敏感信息)可用于分析和显示。 |

这是整个语料库的当前范围的未过滤摘要时间序列数据。此组件的目的是让您了解正在查看的日期范围,并通过在组件内拖动来轻松更改日期范围。图表中的数据可用于确定选择哪个时间范围。您可以选择要显示的不同指标,默认情况下会显示流观察结果的计数。
语料库选择器目前最多可以支持选择大约 20 亿个流观察结果。

在这里,您可以定义过滤器以缩小搜索结果的范围。点击所有可能维度的过滤器 (Filters) 一词旁边的 (?) 图标。对于任何用户标签数据,这些列也将在适当的时间间隔内可用。此输入还支持 and、or、not 和括号关键字,使用这些关键字表示更复杂的过滤器。例如,IP 1.1.1.1 和 2.2.2.2 之间的方向无关过滤器可以写作:
Consumer Address = 1.1.1.1 and Provider Address = 2.2.2.2 or Consumer Address = 2.2.2.2 and Provider Address = 1.1.1.1
And to additionally filter on Protocol = TCP:
(Consumer Address = 1.1.1.1 and Provider Address = 2.2.2.2 or Consumer Address = 2.2.2.2 and Provider Address = 1.1.1.1) and Protocol = TCP
通过将“-”转换为范围查询,过滤器输入还支持将“、”和“-”用于端口、使用者地址和提供者地址。以下是有效过滤器的示例:

|
列(API 中公开的名称) |
说明 |
来源 |
|---|---|---|
|
使用者地址 (src_address) |
使用 CIDR 表示法输入子网或 IP 地址(例如,10.11.12.0/24)。匹配使用者地址与提供的 IP 地址或子网重叠的流观察结果。 |
软件代理和注入设备 |
|
提供者地址 (dst_address) |
使用 CIDR 表示法输入子网或 IP 地址(例如,10.11.12.0/24)匹配其提供者地址与提供的 IP 地址或子网重叠的流观察结果。 |
软件代理和注入设备 |
|
使用者域名 |
匹配其使用者域名(与使用者 IP 地址或子网关联)与输入的使用者域名重叠的流观察结果。 |
软件代理和 AnyConnect 连接器 |
|
提供者域名 |
匹配其提供者域名(与提供者 IP 地址/子网关联)与输入的提供者域名重叠的流观察结果。 |
软件代理和 AnyConnect 连接器 |
|
使用者主机名 (src_hostname) |
匹配使用者主机名与提供的主机名重叠的流。 |
软件代理和 AnyConnect 连接器 |
|
提供者主机名 (dst_hostname) |
匹配提供者主机名与提供的主机名重叠的流。 |
软件代理和 AnyConnect 连接器 |
|
使用者执行组织 (src_enforcement_epg_name) |
使用者执行组是执行策略中与使用者匹配的过滤器(范围、资产过滤器或集群)的名称。 |
内部 |
|
提供者执行组 (dst_enforcement_epg_name) |
提供者执行组是与提供者匹配的执行策略中的过滤器(范围、资产过滤器或集群)的名称。 |
内部 |
|
使用者分析组 |
使用者分析组是所分析策略中与使用者匹配的过滤器(范围、资产过滤器或集群)的名称。 |
内部 |
|
提供者分析组 |
提供者分析组是所分析策略中与提供者匹配的过滤器(范围、资产过滤器或集群)的名称。 |
内部 |
|
使用者范围 (src_scope_name) |
匹配使用者属于指定范围的流。 |
内部 |
|
提供者范围 (dst_scope_name) |
匹配其提供者属于指定范围的流。 |
内部 |
|
使用者端口 (src_port) |
匹配使用者端口与提供的端口重叠的流。 |
软件代理、ERSPAN 和 NetFlow |
|
提供者端口 (dst_port) |
匹配提供者端口与提供的端口重叠的流。 |
软件代理、ERSPAN 和 NetFlow |
|
使用者国家/地区 (src_country) |
匹配使用者国家/地区与提供的国家/地区重叠的流。 |
内部 |
|
提供者国家/地区 (dst_country) |
匹配提供者国家/地区与提供的国家/地区重叠的流。 |
内部 |
|
使用者细分 (src_subdivision) |
匹配使用者细分与提供的细分(状态)重叠的流。 |
内部 |
|
提供者细分 (dst_subdivision) |
匹配提供者细分与提供的细分(状态)重叠的流。 |
内部 |
|
使用者自治系统组织 (src_ autonomous_system_organization) |
匹配使用者自治系统组织与提供的自治系统组织 (ASO) 重叠的流。 |
内部 |
|
提供者自治系统组织 (dst_autonomous_system_organization) |
匹配提供者自治系统组织与提供的自治系统组织 (ASO) 重叠的流。 |
内部 |
|
协议 (proto) |
按协议类型(TCP、UDP、ICMP)过滤流观察结果。 |
软件代理和注入设备 |
|
地址类型 (key_type) |
按地址类型(IPv4、IPv6、DHCPv4)过滤流观察结果。 |
软件代理和注入设备 |
|
正向 TCP 标志 |
按标志(SYN、ACK、Echo)过滤流观察结果。 |
软件代理、ERSPAN 和 NetFlow |
|
反向 TCP 标志 |
按标志(SYN、ACK、Echo)过滤流观察结果。 |
软件代理、ERSPAN 和 NetFlow |
|
正向进程 UID (fwd_process_owner) |
按进程所有者 UID(root、admin、yarn、mapred)过滤流观察结果。 |
软件代理 |
|
反向进程 UID (rev_process_owner) |
按进程所有者 UID(root、admin、yarn、mapred)过滤流观察结果。 |
软件代理 |
|
正向进程 (fwd_process_string) |
按进程(Java、Hadoop、Nginx)过滤流观察结果。请参阅进程字符串可视性警告 |
软件代理 |
|
反向进程 (rev_process_string) |
按进程(Java、Hadoop、Nginx)过滤流观察结果。请参阅进程字符串可视性警告 |
软件代理 |
|
收集规则中的使用者? |
仅匹配内部使用者。 |
内部 |
|
收集规则中的提供者? |
仅匹配内部提供者。 |
内部 |
|
SRTT 可用 |
使用“true”或“false”匹配 SRTT 测量值可用的流。(这相当于 SRTT > 0)。 |
内部 |
|
字节数 |
按字节流量存储桶过滤流观察结果。匹配流量桶值为 =、<、>(按 2 的幂 (0, 2, 64, 1024) 进行分组)的流。 |
软件代理和注入设备 |
|
数据包数 |
按数据包流量存储桶过滤流观察结果。匹配数据包流量存储桶值为 =、<、>(按 2 的幂 (0, 2, 64, 1024) 进行分组)的流。 |
软件代理和注入设备 |
|
流持续时间 (µs) |
按流持续时间存储桶过滤流观察结果。匹配“流持续时间”值分别为 =、<、>(按 2 的幂 (0, 2, 64, 1024) 进行分组)的流。 |
内部 |
|
数据持续时间 (µs) |
按数据持续时间存储桶过滤流观察结果。匹配“数据持续时间”值分别为 =、<、>(按 2 的幂 (0, 2, 64, 1024) 进行分组)的流。 |
内部 |
|
SRTT (µs) (srtt_dim_usec) |
按 SRTT 存储桶过滤流观察结果。匹配 SRTT 存储桶值为 =、<、>(按 2 的幂 (0, 2, 64, 1024) 进行分组)的流。 |
软件代理 |
|
正向数据包重新传输 (fwd_tcp_pkts_retransmitted) |
按数据包重新传输存储桶过滤流观察结果。匹配数据包重新传输桶值为 =、<、>(按 2 的幂 (0, 2, 64, 1024) 进行分组)的流。 |
软件代理 |
|
反向数据包重新传输 (rev_tcp_pkts_retransmitted) |
按数据包重新传输存储桶过滤流观察结果。匹配数据包重新传输桶值为 =、<、>(按 2 的幂 (0, 2, 64, 1024) 进行分组)的流。 |
软件代理 |
|
用户标签(* 或 user_ 前缀) |
与手动上传的自定义标签关联的用户定义数据,在 UI 中以 * 为前缀,而在 OpenAPI 中以 user_ 为前缀。 |
配置管理数据库 (CMDB) |
|
TLS 版本 |
流中使用的 SSL 协议版本。 |
软件代理 |
|
TLS 密码 |
流中 SSL 协议使用的算法类型。 |
软件代理 |
|
使用者代理类型 |
指定使用者代理类型。 |
内部 |
|
提供者代理类型 |
指定提供者代理类型。 |
内部 |
|
使用者资源类型 |
表示从源到使用者的资源流。它可以是工作负载、Pod、服务或其他 |
内部 |
|
提供者资源类型 |
表示从提供者到使用者的资源流。。它可以是工作负载、Pod、服务或其他。 |
内部 |
 Note |
由于流数据仅在注入时才会使用用户标签进行标记,因此用户标签在启用后不会立即显示。标签可能需要几分钟才会开始显示在“流搜索”中。此外,可用的用户标签会有所不同,具体取决于您选择的语料库选择器的哪个部分,因为启用的标签可能已在不同时间更改。 |

此组件显示所选间隔(在上述语料库选择器中做出的选择)内各种指标的汇总总计。使用下拉列表更改显示的指标。
也可以在此组件中进一步缩小所选间隔。点击图表中您要关注的区域,“前 N 个”(Top N) 图表和下面的数据都将更新为仅包含该所选时间间隔内的数据。

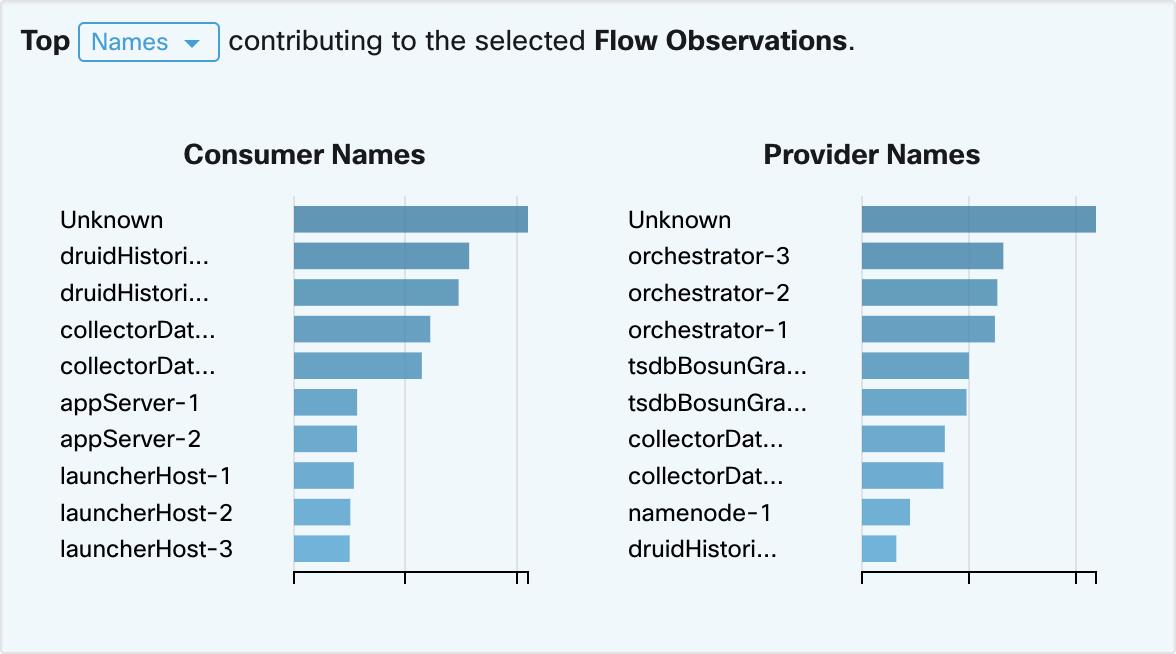
图表显示了左侧已过滤时序图表中的前 N 个值。在时序图表中选择“流观察结果”(Flow Observations) 中的一个峰值,并在“前 N 个”(Top N) 图表中选择主机名,可显示对这些流观察结果影响最大的主机名(使用者和提供者)列表。此外,如果时间序列图表设置为显示 SRTT,则“排名靠前的主机名”(Top Hostnames) 会显示对该所选 SRTT 影响最大的主机名。
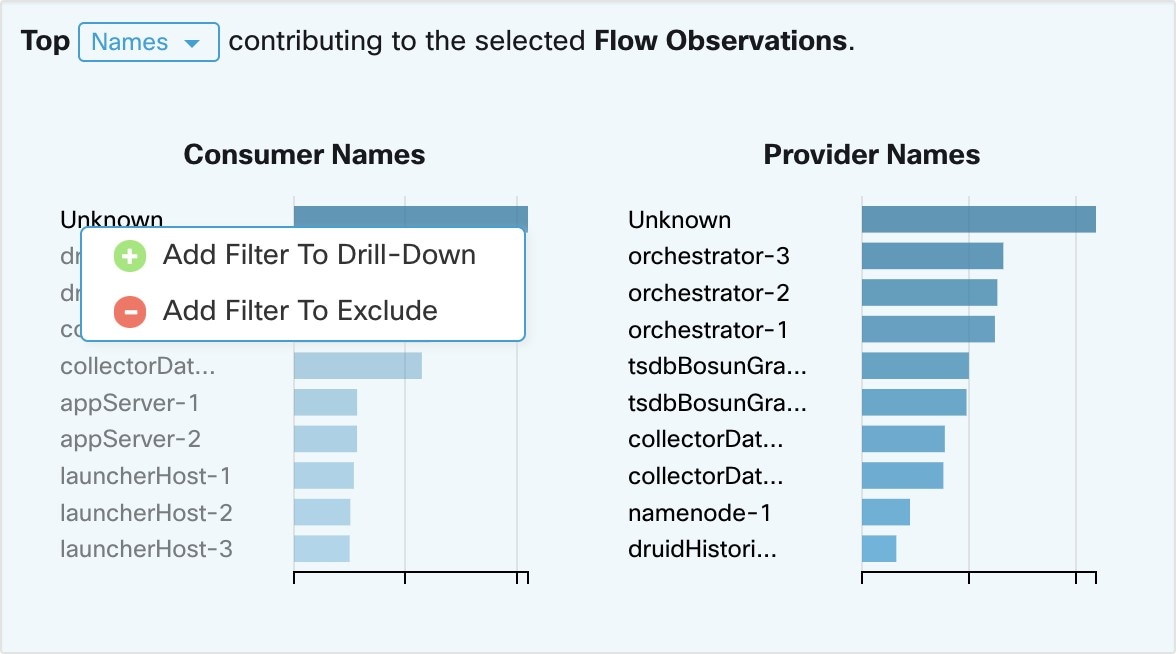
点击“前 N 个”(Top N) 图表中的任何项目,以显示一个菜单,允许您 向下钻取或排除该值。
点击向下钻取 (Drill-Down) 以添加将结果限制为仅包含该值的过滤器。
点击排除 (Exclude) 以添加从结果中排除该值的过滤器。
Note |
点击向下钻取 (Drill-Down) 或排除 (Exclude) 后,必须按下过滤器 (Filter) 图标才能使过滤器生效。这样可以快速执行多个排除操作,而不会在中间重复更新页面。 |

这是与以上页面中的过滤器和选择相匹配的实际流观察结果的列表。默认情况下,将从间隔开始时加载 20。可以使用下拉菜单增加加载的数量。还可以使用采样 (Sampled) 而不是按顺序 (In order) 从所选间隔加载随机的流观察结果集。采样 (Sampled) 设置可用于从所选间隔获取更具代表性的流观察结果集,而不是从间隔开始按顺序加载它们。
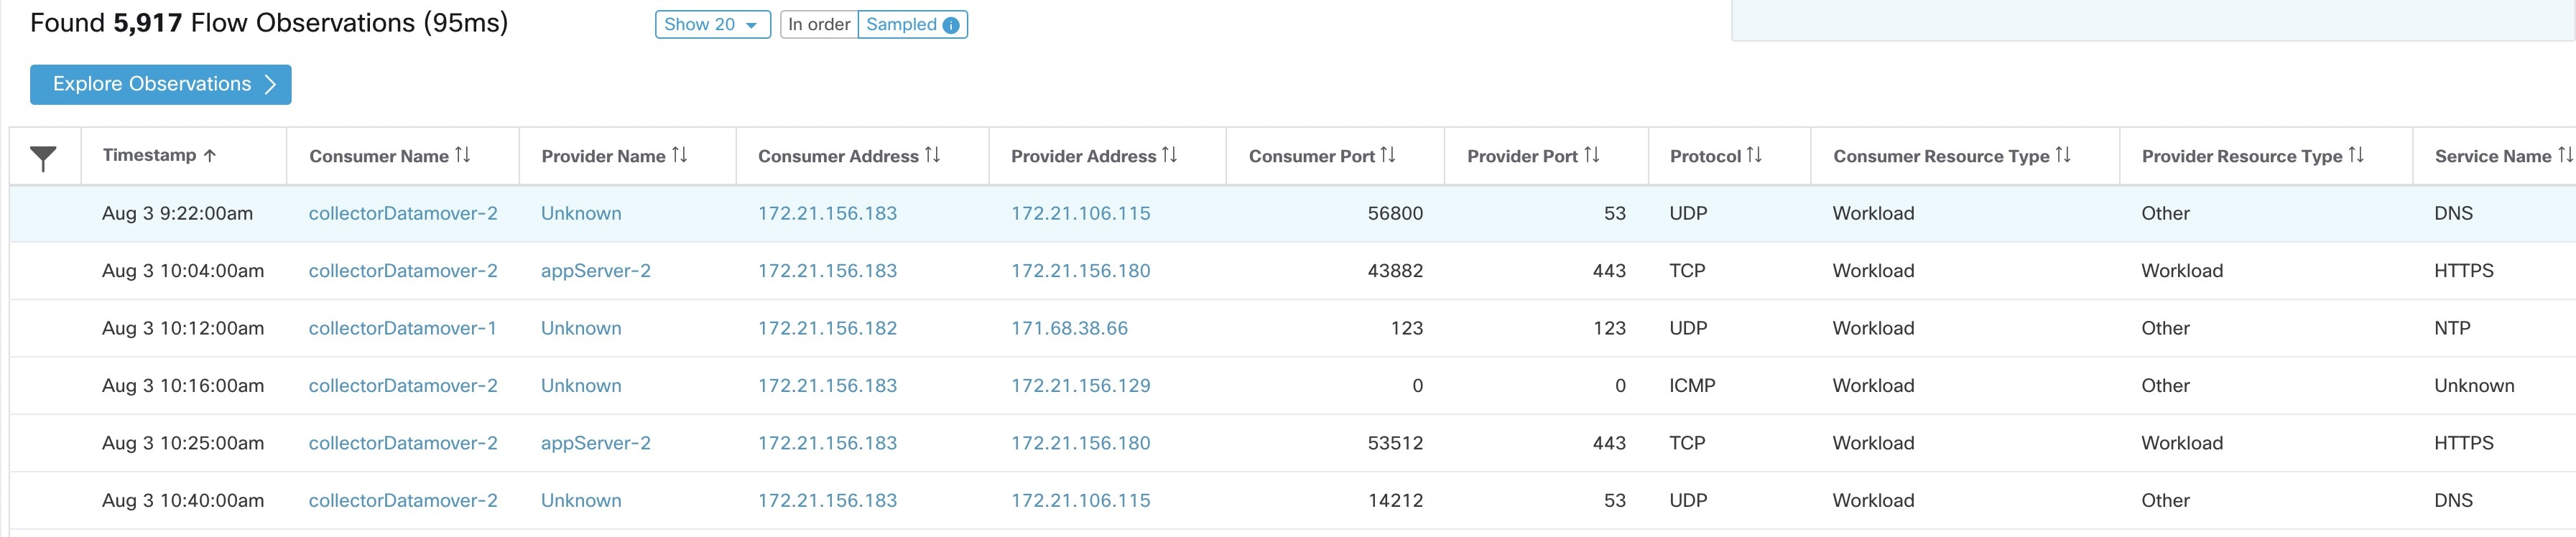
点击任意行以展开流详细信息 (Flow Details) 部分。这将显示流摘要以及该流生命周期内各种指标的图表。对于长期存在的流,底部会显示一个摘要图表,让您能够选择查看时序数据的不同间隔。

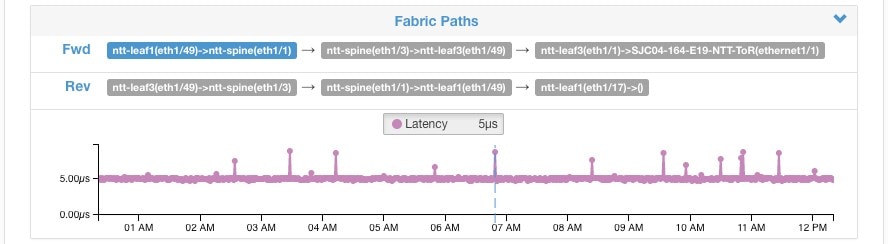
对于标记有交换矩阵路径信息的流,正向/反向交换矩阵延迟 (Fwd/Rev Fabric Latency) 和 SRTT 可用。如果可用,可能会显示其他指标的时间序列图表,例如正向/反向突发指示器 (Fwd/Rev Burst Indicators) 和正向/反向突发 + 丢弃指示器 (Fwd/Rev Burst+drop Indicators)。请参阅可视性警告。

此外,还提供有关正向/反向交换矩阵路径 (Fwd/Rev Fabric Path) 的详细信息。每个链接均可点击,从而切换延迟和丢弃指标时间序列图表(非零时)。点击正向 (Fwd) 或反向 (Rev) 以导航至流的“交换矩阵路径重叠”(Fabric Path Overlay) 页面向下钻取。

点击探索观察结果 (Explore Observations) 结果,启用允许快速浏览高维数据的图表视图(平行坐标 (Parallel Coordinates) 图表)。起初,此图表有点难以理解,但在仅启用您感兴趣的维度(通过取消选中维度 (Dimensions) 下拉列表中的项目)以及重新排列维度的顺序时,此图表非常有用。此图表中的单条线表示单个观察结果,该线与各个轴相交的位置表示该观察结果对于该维度的值。将鼠标悬停在图表下方的观察结果列表上,查看图表中表示该观察结果的突出显示线时,这一点会变得更清楚:
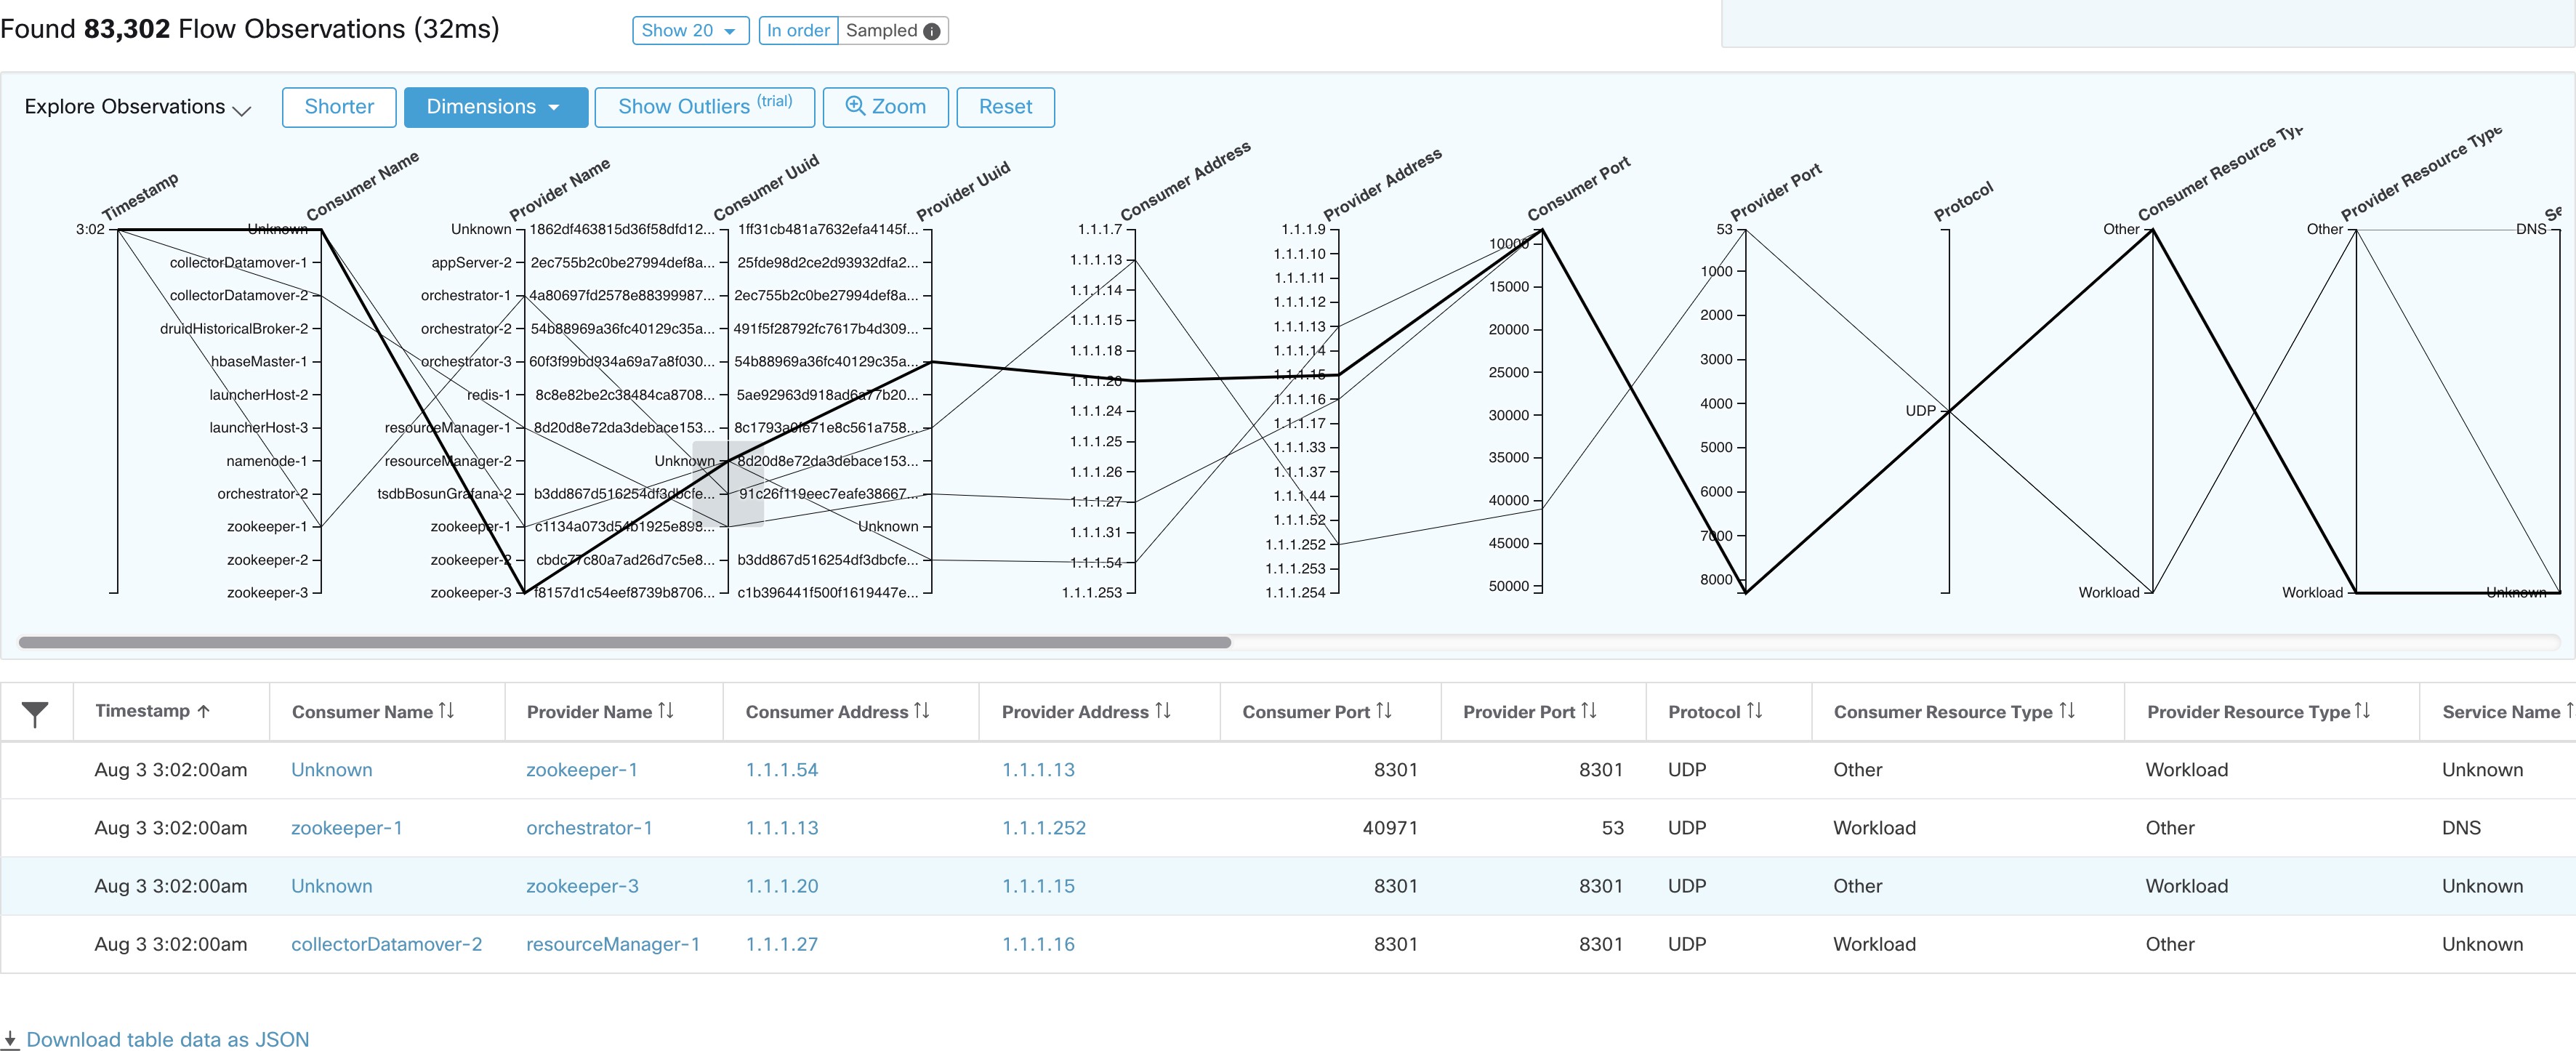
由于流数据的高维特性,此图表默认情况下很宽,需要向右滚动才能看到整个图表。因此,禁用除您感兴趣的维度之外的所有维度将非常有用。
建议在启用采样和更多流的情况下完成探索观察结果。这样,您就可以查看构成所选间隔的更多各种流。因此,如果您在上面的时间序列图表中选择了 200 万个流观察结果,则在整个间隔内均匀加载 1000 个流观察结果,而按顺序加载流将从最开始处加载前 1000 个流观察结果间隔:
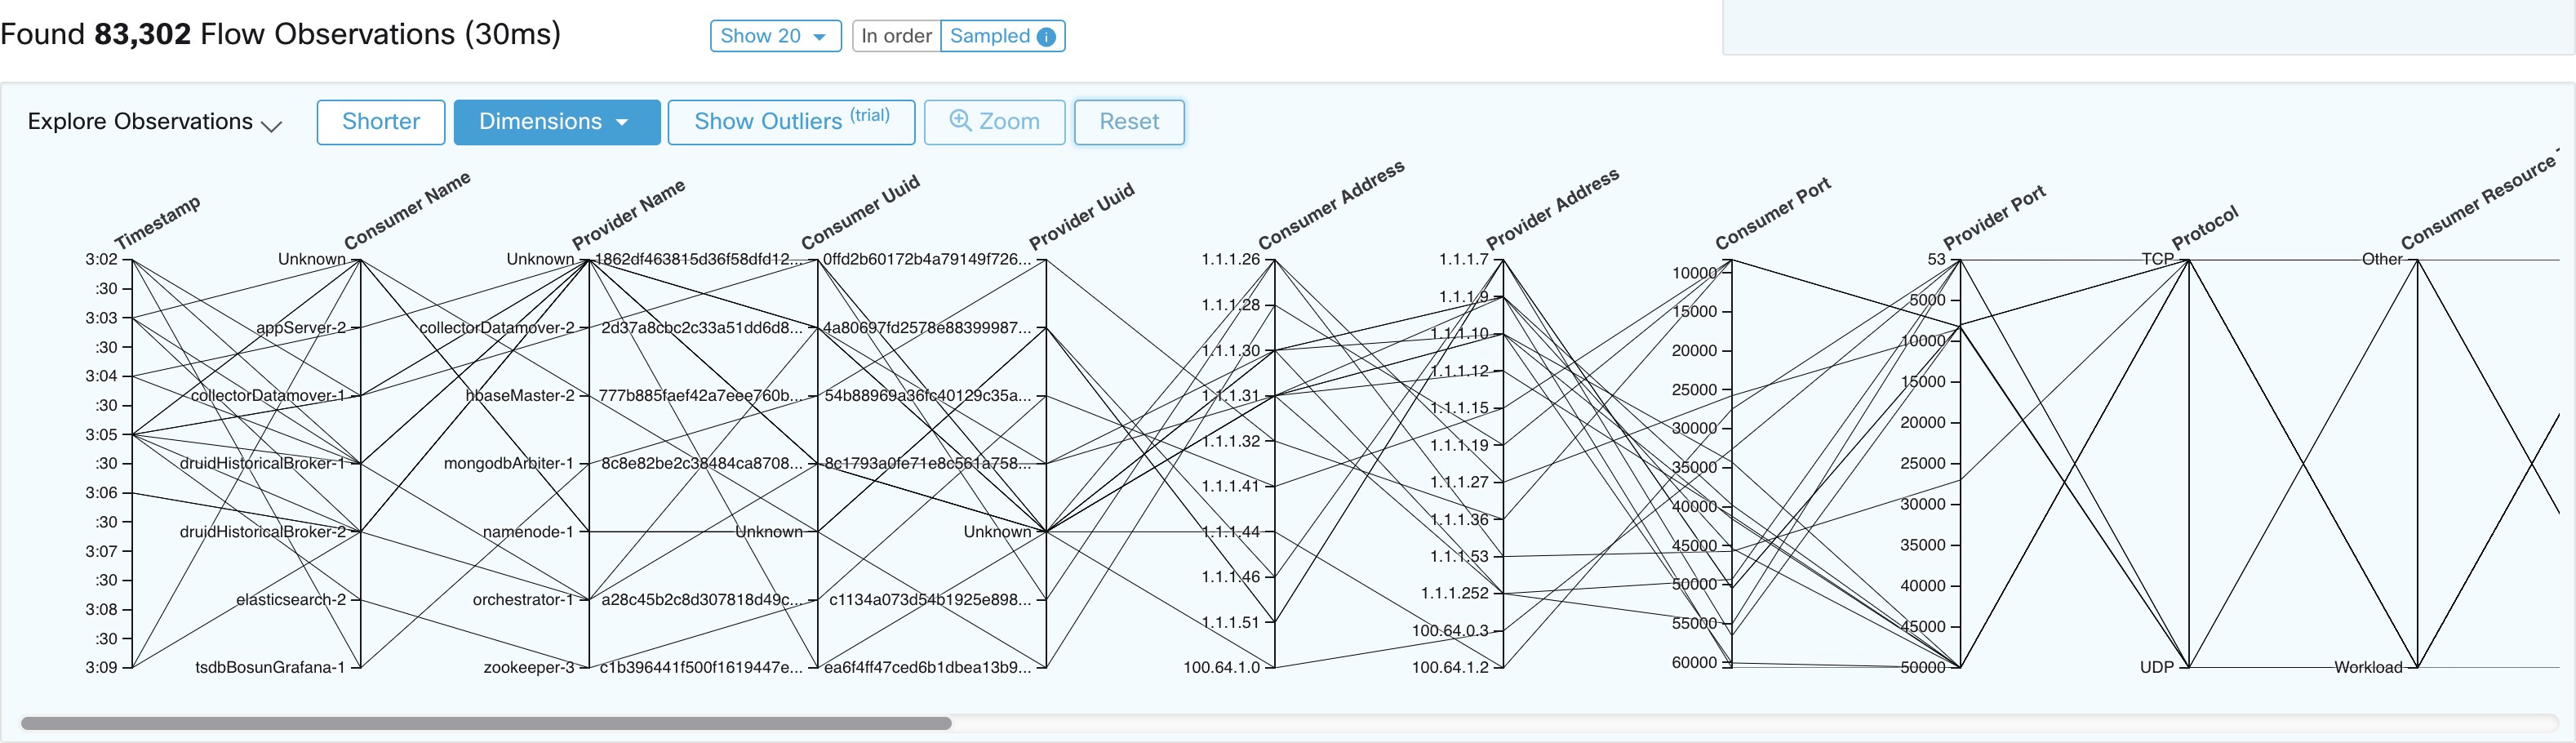
请注意,所有按顺序观察的时间戳如何从 9:09 开始,以及观察结果如何均匀分布在采样版本中的选定间隔内。
沿任意坐标轴拖动光标可创建一个选区,只显示与该选区匹配的观察结果。再次点击轴可随时删除选择。一次可以在任意数量的轴上进行选择。观察结果列表将更新,以便仅显示所选观察结果:
流方向(客户端/服务器或提供者/使用者分类)对于可视性、自动策略发现和执行非常重要。每个单播流都有一个客户端和一个服务器分类。
例如,如果有客户端 (192.168.1.1-192.168.1.3) 使用 https 访问网络服务器 (192.168.2.1),通常源端口是 1025-65535 范围内的短暂端口,目标端口是 443。

准确的客户端-服务器方向为:
客户端:192.168.1.1-3
服务器:192.168.2.1
服务:TCP 端口 443
自动发现策略生成的策略如图所示(左侧终端已分组):

现在,如果客户端-服务器方向决策相反(分类不准确),即:
客户端:192.168.2.1
服务器:192.168.1.1-3
服务:临时端口列表(45680、51112、45553)
那么,在上述不准确的分类中,生成的策略可能如图所示:
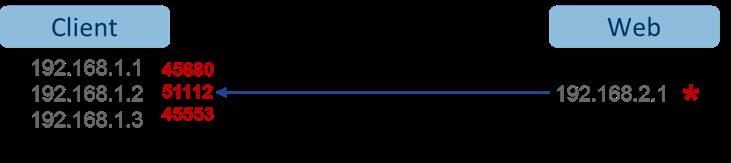
这会在策略执行方面消耗更多资源。此外,根据执行策略的方式,即使 192.168.1.1-3 使用这些临时端口,它们也无法访问 192.168.2.1。例如,如果使用 Cisco Secure Workload 软件传感器执行,则客户端到 Web 的执行策略 (ESTAB) 不会与客户端生成的发往 Web 的流量(NEW、ESTAB)不匹配。
Cisco Secure Workload 中使用时间戳和 TCP 标志来确定客户端-服务器方向。如果没有 TCP 标志信息(SYN、SYN/ACK),例如,数据包可能是 UDP/ICMP,或者使用的硬件传感器不支持方向信号,那么就会使用用户定义的覆盖规则、时间戳和其他启发式方法来推断流量方向。根据定义,启发式方法无法保证 100% 准确。客户端-服务器的准确度取决于所用传感器的类型和使用传感器的条件。您可以使用 Cisco Secure Workload 的 REST-API (OpenAPI) 插入客户端-服务器覆盖规则,以便为 Cisco Secure Workload 获取错误方向的流类型识别服务器端口。然后,允许 Cisco Secure Workload 处理使用这些规则捕获的新流数据,然后在固定流方向的持续时间内生成策略。有关用于指定覆盖规则的 API 的更多详细信息,请参阅:客户端服务器配置。您还可以手动定义策略并检查/删除不需要的策略。请参阅策略。
深度可视性或执行软件代理为 Cisco Secure Workload 客户端-服务器分类算法提供最佳信号。建议考虑部署深度可视性或执行代理。这些代理会获取所有必要的信号,以推动正确的客户端-服务器分类。如果无法为少数工作负载部署深度可视性或执行代理,则建议使用 ERSPAN 传感器并在此位置停止以进行自动策略发现。Cisco Secure Workload 尽其所能提供帮助,我们会根据反馈不断改进启发式算法。
当正确的客户端-服务器方向信息不可用时,Cisco Secure Workload 会使用用户定义的覆盖或启发式方法来推断可能的方向。根据定义,启发式方法无法保证 100% 准确。准确度会随所使用的传感器类型及其使用条件的不同而有所下降。
以下是针对策略生成使用案例推荐的客户端-服务器决策顺序:
深度可视性或执行代理:为获得最佳效果,请使用软件传感器(深度可视性或执行代理)。在传感器启动之前启动的流量将通过下面讨论的启发式方法进行处理。
ADC 传感器,例如 F5/Citrix/. . . agents:这些代理会从 ADC 设备收集客户端-服务器状态,并将该真实信息源流传输到 Cisco Secure Workload。
ERSPAN 传感器 :对于 ERSPAN 传感器,用户需要注意提供进出相关工作负载的流量的完整可视性,并确保 ERSPAN 传感器看到所有跨区流量。ERSPAN 传感器也不得超额订用,以免其对工作负载的网络通信的可视性受到影响。此外,用户必须确保 ERSPAN 传感器的丢包率保持在最低水平。对于自动策略发现,操作员不会看到包含网络流信息的进程信息。
在使用下面列出的 NetFlow 传感器时,用户必须注册才能进行更多手动策略分析和生成例外规则。Cisco Secure Workload 广泛使用启发式方法,根据定义,启发式方法也并非 100% 准确。
NetFlow 传感器:NetFlow 提供采样和汇聚的流数据。汇聚和采样进程会丢失客户端-服务器方向信息。这会影响自动策略发现和策略生成结果,并使问题变得更加严重。NetFlow 数据非常适合实现高级可视性。Cisco Secure Workload 必须回退到启发式算法,如果不正确,有时需要操作员执行更多手动工作,例如为 Cisco Secure Workload 定义例外规则。NetFlow 数据也会丢失一些短流,并且信号质量取决于生成 NetFlow 数据的设备。对于通过 L3/L4 NAT 设备(或服务器负载均衡器)等特殊使用案例(例如拼接流),我们建议将 NetFlow 与 Cisco Secure Workload 配合使用,以便提供 Cisco Secure Workload 可视性,弄清楚哪个流与哪个其他流相关。
下文将详细介绍客户服务器方向分析。
检测服务器的方法有多种(通常是启发式方法):
如果传感器检测到 SYN 握手,则它可以确定服务器的身份。
基于时间 - 连接的发起方被视为客户端。
度数模型 - 服务器通常有许多客户端与其通信。相比之下,客户端端口的程度预计要低得多。
优先级顺序为 SYN_ANALYSIS/NETSTAT > USER_CONFIG > DEGREE_MODEL。
之所以赋予 SYN_ANALYSISIS 比用户配置更高的优先级,是因为配置可能会过时,而传感器拥有最佳的有利位置来确定基本事实。DEGREE_MODEL 是学习/启发式方法发挥作用的地方,其准确性无法得到 100% 的保证。
尽管我们在此领域做出了最好的意图并不断优化算法,客户端-服务器检测启发式方法仍可能会出错。在这些情况下,可以使用 OpenAPI 接口来穿透已知的服务器端口。这些配置不会应用于过去的流,只会影响从该点开始(即,向前)的流上的标记。其目的是作为万不得已的备用手段,而不是正常的作案方式。
我们还建议不要在给定流的整个持续时间内不断翻转客户端-服务器标记(即使我们弄错了,当我们的内部模型发生变化时--随着时间的推移,随着对更多流模式的观察/分析,内部模型会发生变化)。允许较高/同等优先级的更新覆盖较低优先级的更新(我们还将为现有流量翻转客户端服务器)。换句话说,“在流的生命周期内”标记的粘性仅适用于基于学位模型的标记。
Cisco Secure Workload 支持以下流分析精确度模式:
详细模式:过去,详细模式是唯一可用的模式,其中代理会报告观察到的每个流以及有关观察到的流的详细统计信息。捕获的统计信息包括数据包和字节计数、TCP 标志、连接统计信息、网络延迟、SRTT 等。虽然这种报告在很多情况下都是可取的,但报告和处理的计算量很大,而且,如果主要使用案例只是分段,可能并不会严格要求使用这种报告。
对话模式:对话模式提供了比传统详细模式更轻量级的替代方案。处于对话模式的代理旨在尽可能报告对话而不是流(即只要它们能够准确地进行客户端-服务器分类)。这适用于 TCP、UDP 和 ICMP 流。
在详细模式下,对于 TCP/UDP 流,我们报告五元组流 {源和目标 IP、源和目标端口以及协议}。而对于对话模式,代理会省略源端口,因为它们是临时端口 {每次新连接时都会更改},使其成为四元组流。
Note |
将流检测为 4 元组还取决于客户端-服务器检测算法,而该算法依赖于服务器/目标端口是否为公认端口 (0-1023)。 |
因此,如果您使用的自定义应用不使用已知服务器/目标端口,则可以使用 OpenAPI 接口提取已知服务器端口。这些配置不会应用于过去的流,只会影响从该点开始(即,向前)的流上的标记。要优化服务器端口,请参阅客户端服务器配置。
对话模式下的代理报告包含精简信息,而省略字段的完整列表包括:
TCP/UDP 源端口(临时端口)
正向/反向 TCP 瓶颈
TCP 握手存储桶
SRTT(µs)
正向/反向数据包重新传输
SRTT 可用
正向/反向拥塞窗口已缩小
正向/反向 MSS 已更改
正向/反向 TCP 接收窗口为零?正向/反向突发指示符
正向/反向最大突发大小 (KB)
要启用对话模式,请参阅软件代理配置中的“流可视性”配置部分
Note |
由于多种因素的影响,包括但不限于 TCP 流的百分比、在已知服务端口上侦听的服务数量以及代理的内存限制,因此将代理更改为以对话模式报告所能获得的确切收益可能会有所不同。 |
Note |
为某些代理打开会话模式后,流搜索页面的观察结果中可能会混合出现会话和流。 |
 反馈
反馈