Dashboard

This chapter contains the following topics:

Dashboard

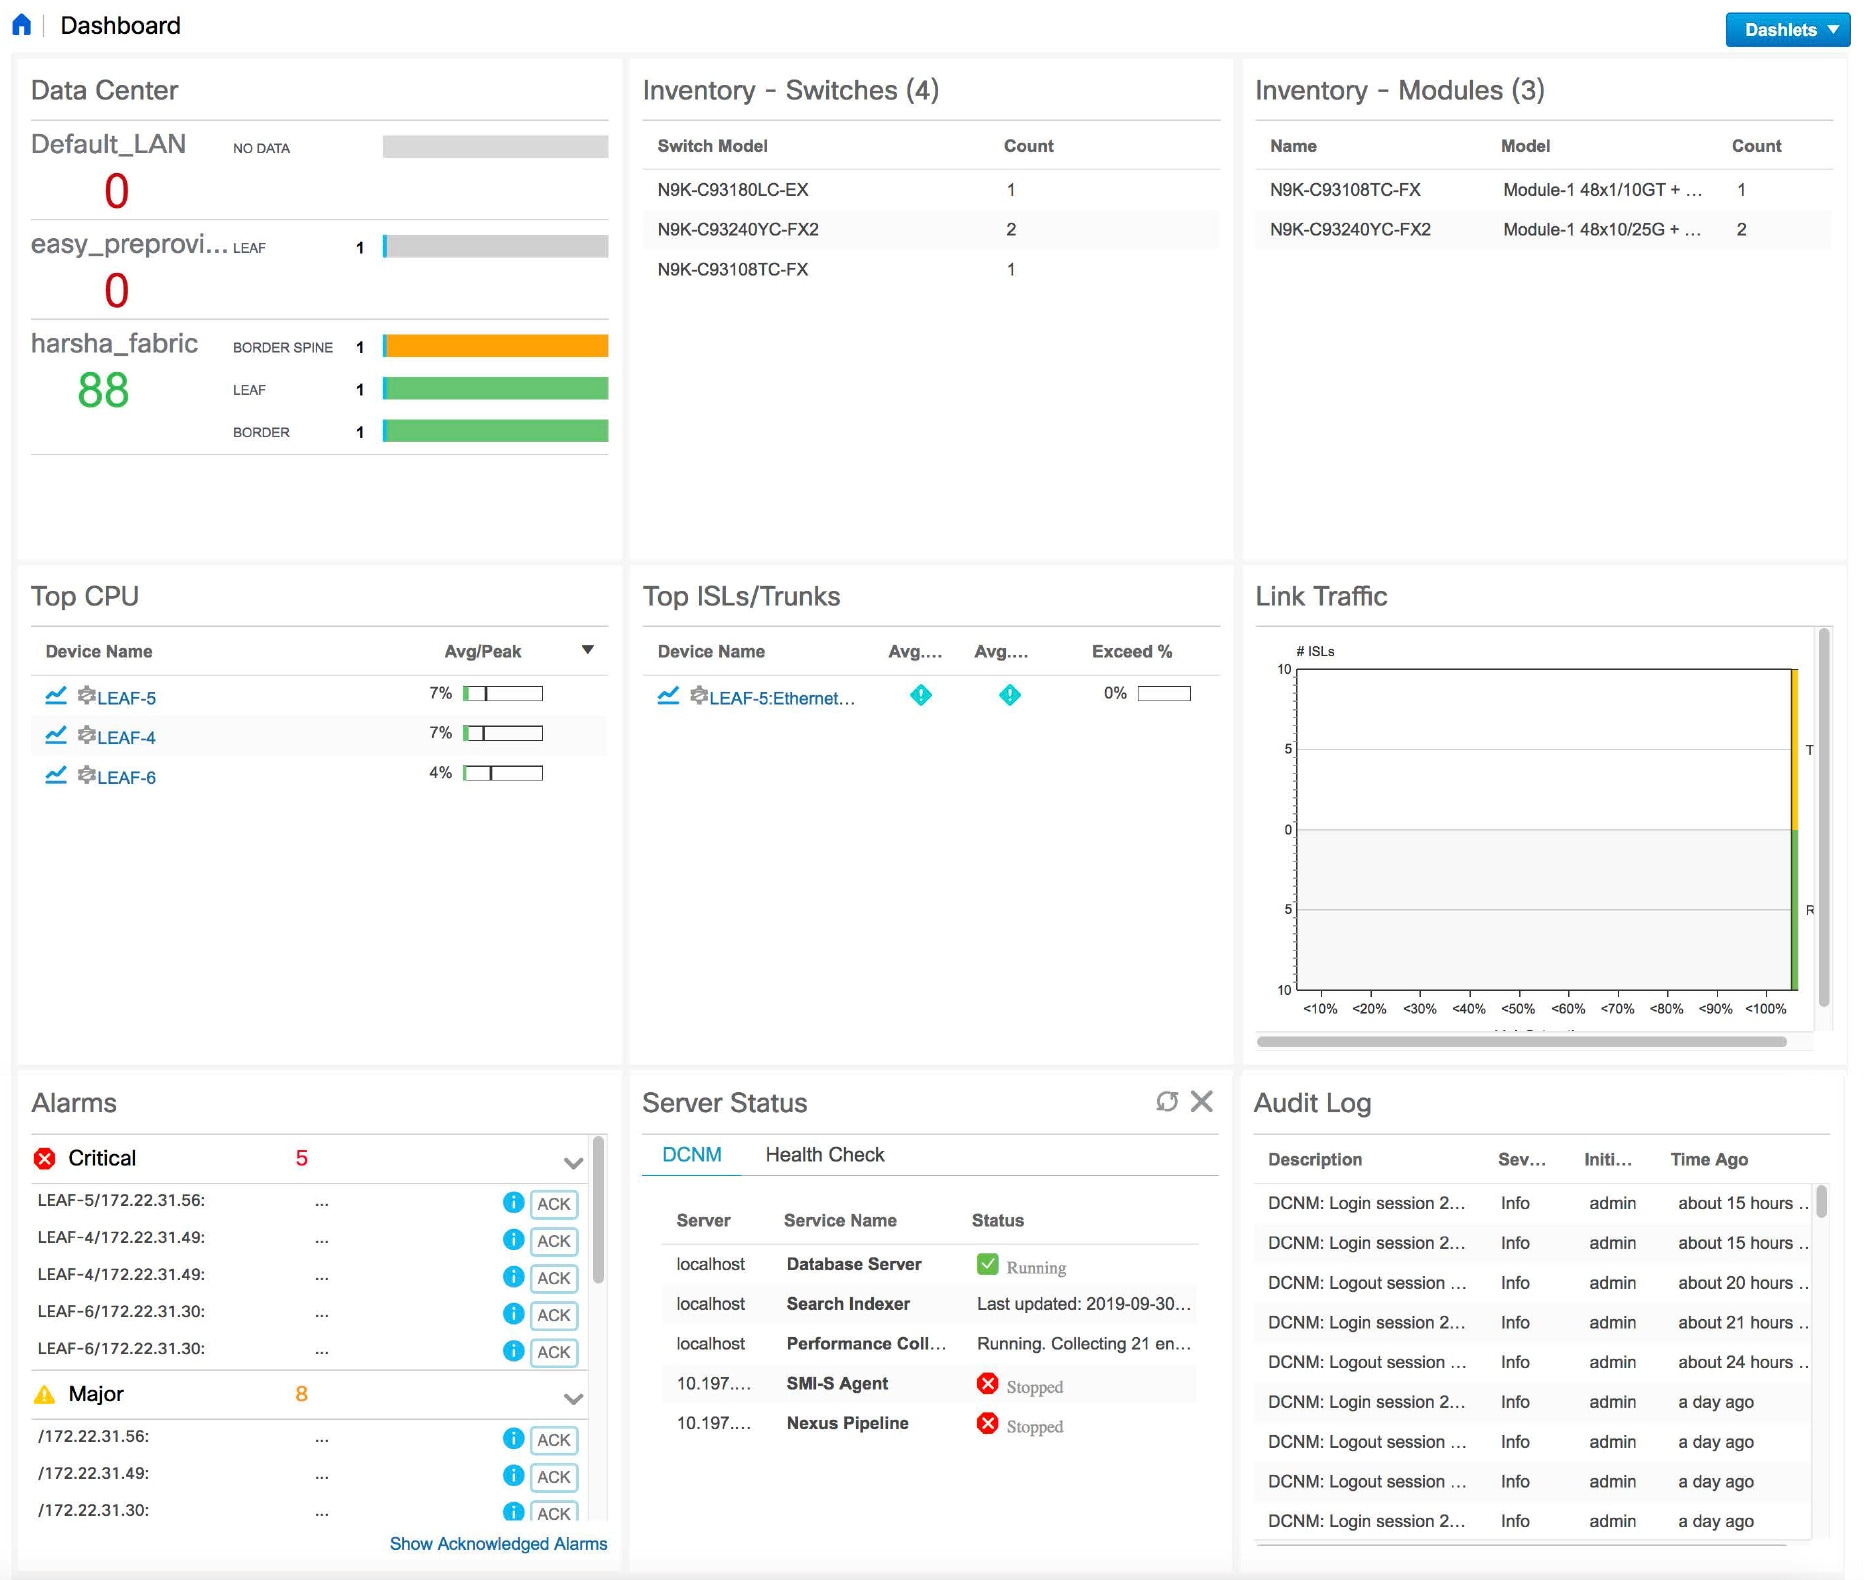
The intent of Dashboard is to enable network and storage administrators to focus on particular areas of concern around the health and performance of data center switching. This information is provided as 24-hour snapshots. The functional view of LAN switching consists of six dynamic dashlets that display information in the context of the selected scope by default. The scope can be adjusted in the upper right corner of the window to display focused information that is particular to the managed domain. It offers details of a specific topology or set of topologies that is a part of the data center scope.

The various scopes that are available on the Cisco Data Center Network Manager (DCNM) web interface are:

  • Data Center

  • Default_SAN

  • Default_LAN

  • Each SAN Fabric

  • Custom scopes that you create

From the left menu bar, choose Dashboard. The Dashboard window displays the default dashlets.

The following are the default dashlets that appear in the Dashboard window:

  • Data Center

  • Inventory - Switches

  • Inventory - Modules

  • Top CPU

  • Top ISLs/Trunks

  • Link Traffic

  • Alarms

  • Events

  • Server Status

  • Audit Log

From the Dashlets drop-down list, you can choose more dashlets so that they are added to the dashboard.

The panels can be added, removed, and dragged around to reorder.

Dashlets

By default, a subset of the available dashlets is automatically displayed in the dashboard. To add a dashlet that is not automatically displayed in a dashboard, from the Cisco DCNM Web UI, perform the following steps:

Procedure


Step 1

Choose Dashboard.

Step 2

From the Dashlets drop-down list, choose the dashlet that you want to add in the dashboard.

In the Dashlets drop-down list, an icon appears before the selected dashlet.

The following table lists the dashlets that you can add on the Dashboard window.
Dashlet

Description

Events

Displays events with Critical, Error, and Warning severity. In this dashlet, click the Show Acknowledged Events link to go to the Monitor > Switch > Events.

Alarms

Displays alarms with Critical, Major, Minor, and Warning severity. In this dashlet, click the Show Acknowledged Alarms link to go to the Monitor > Alarms > View window. Hover the mouse cursor over the blue i icon for more information about a specific alarm. Click ACK to acknowledge a specific alarm.

Link Traffic

Displays a diagram of Inter-Switch Link (ISL) and saturation link for transmitting and receiving in the data center.

Data Center

Displays the number of access, spine and leaf devices, and a generic health score for each switch group in the current scope. Devices are aggregated by type within a switch group.

Audit Log

Displays the accounting log table of Cisco DCNM.

Network Map

Displays the populated switch groups that are visible in your Role Based Access Control (RBAC) scope on a world map. If you use the scope selector, it limits the set of switch groups displayed. If you click detach option, the map opens in a new tab and can be configured.

  • The network map dialog box has properties that are different from the Summary dashboard view:

  • You can click and drag nodes to move them around the map. The map saves their new positions.

  • You can double click a node to trigger a slider that contains the summary inventory information pertaining to a specific switch group.

  • You can upload an image of your choice as the background to the network map.

Note 

You will be prompted to upload an image file with recommended dimension, which is the current window size. Reset returns the network map to its default state, resetting the position of the nodes and clearing the custom image.

Server Status

Displays the status of DCNM and federation servers, and the health check status for the components.

The following services, server, and status details are displayed under the DCNM tab.

  • Database Server

  • Search Indexer

  • Performance Collector

  • NTPD Server

  • DHCP Server

  • SNMP Traps

  • Syslog Server

The following component status and details are displayed under the Health Check tab.

  • AMQP Server

  • DHCP Server

  • TFTP Server

  • EPLS

  • EPLC

Top ISLs/Trunks

Displays the performance data for the top ten performing ISLs, trunk ports or both. Each entry shows the current average receive and transmit percentage, with a graph depicting the percentage of time each trunk spent exceeding the currently configured thresholds.

Top SAN End Ports (SAN only)

Displays the performance data for the top ten performing SAN host and storage ports. Each entry shows the current receive and transmit percentage, with a graph depicting the percentage of time each trunk spent exceeding the currently configured thresholds.

Note 

This dashlet is only for SAN.

Top CPU

Displays CPU utilization for the discovered switches over the last 24 hours, with a red bar displaying the high watermark for that 24-hour period.

Top Temperature

Displays the module temperature sensor details of switches.

Note 

This dashlet is only for LAN.

Health

Displays the health summary that contains two columns displaying the summary of problems and summary of events for the past 24 hours.

Click the count adjacent to the warnings pertaining to switches, ISLs, hosts, or storage (other than 0) to view the corresponding inventory for that fabric.

Click the count adjacent to the event severity levels (Emergency, Alert, Critical, Error, Warning, Notice, Info, or Debug) to view a summary of the corresponding events and descriptions.

Errors

Displays the error packets for the selected interface. This information is retrieved from the Errors > In-Peak and Errors > Out-Peak columns of the Monitor > LAN / Ethernet page.

Discards

Displays the error packets that are discarded for the selected interface.

Note 

The Discards dashlet is only for LAN.

Inventory (Ports)

Displays the ports inventory summary information.

Inventory (Modules)

Displays the switches on which the modules are discovered, the models name and the count.

Inventory (ISLs)

Displays the ISLs inventory summary information, such as the category and count of ISLs.

Inventory (Logical)

Displays the logical inventory summary information, such as the category and count of logical links.

Inventory (Switches)

Displays the switches inventory summary information such as the switch models and the corresponding count.

Inventory (Port Capacity)

Displays the port capacity inventory summary information such as the tiers, the number and percentage of the available ports, and the remaining days.

Note 

To restore the default dashlets in the dashboard page, click the Default Set link in the Dashlet drop-down list.