- Testing Your Configuration
- Monitoring Performance
- Monitoring System Resources
- Monitoring Connections
- Monitoring Per-Process CPU Usage
Troubleshooting Connections and Resources
This chapter describes how to troubleshoot the ASA and includes the following sections:
Testing Your Configuration
This section describes how to test connectivity for the single mode ASA or for each security context, how to ping the ASA interfaces, and how to allow hosts on one interface to ping through to hosts on another interface.
This section includes the following topics:
- Pinging ASA Interfaces
- Verifying ASA Configuration and Operation, and Testing Interfaces Using Ping
- Determining Packet Routing with Traceroute
- Tracing Packets with Packet Tracer
Pinging ASA Interfaces
To test whether the ASA interfaces are up and running and that the ASA and connected routers are operating correctly, you can ping the ASA interfaces.
To ping the ASA interfaces, perform the following steps:
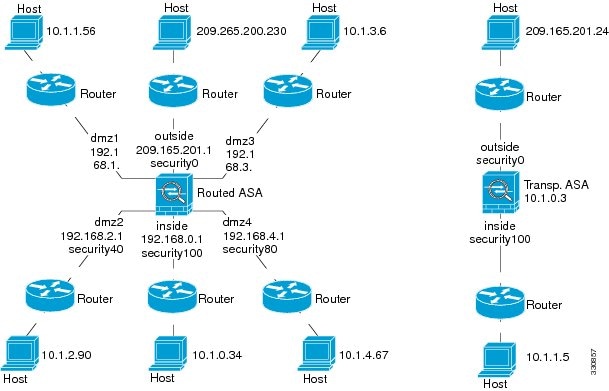
Step 1![]() Draw a diagram of your single-mode ASA or security context that shows the interface names, security levels, and IP addresses.
Draw a diagram of your single-mode ASA or security context that shows the interface names, security levels, and IP addresses.

Note![]() Although this procedure uses IP addresses, the ping command also supports DNS names and names that are assigned to a local IP address with the name command.
Although this procedure uses IP addresses, the ping command also supports DNS names and names that are assigned to a local IP address with the name command.
The diagram should also include any directly connected routers and a host on the other side of the router from which you will ping the ASA. (See Figure 22-1.)
Figure 22-1 Network Diagram with Interfaces, Routers, and Hosts
Step 2![]() Ping each ASA interface from the directly connected routers. For transparent mode, ping the management IP address. This test ensures that the ASA interfaces are active and that the interface configuration is correct.
Ping each ASA interface from the directly connected routers. For transparent mode, ping the management IP address. This test ensures that the ASA interfaces are active and that the interface configuration is correct.
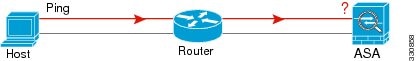
A ping might fail if the ASA interface is not active, the interface configuration is incorrect, or if a switch between the ASA and a router is down (see Figure 22-2). In this case, no debugging messages or syslog messages appear, because the packet never reaches the ASA.
Figure 22-2 Ping Failure at the ASA Interface
If the ping reaches the ASA, and it responds, debugging messages similar to the following appear:
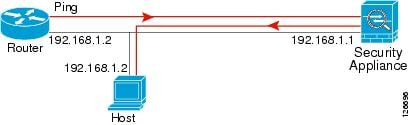
If the ping reply does not return to the router, then a switch loop or redundant IP addresses may exist (see Figure 22-3).
Figure 22-3 Ping Failure Because of IP Addressing Problems
Step 3![]() Ping each ASA interface from a remote host. For transparent mode, ping the management IP address. This test checks whether the directly connected router can route the packet between the host and the ASA, and whether the ASA can correctly route the packet back to the host.
Ping each ASA interface from a remote host. For transparent mode, ping the management IP address. This test checks whether the directly connected router can route the packet between the host and the ASA, and whether the ASA can correctly route the packet back to the host.
A ping might fail if the ASA does not have a return route to the host through the intermediate router (see Figure 22-4). In this case, the debugging messages show that the ping was successful, but syslog message 110001 appears, indicating a routing failure has occurred.
Figure 22-4 Ping Failure Because the ASA Has No Return Route

Verifying ASA Configuration and Operation, and Testing Interfaces Using Ping
The Ping tool is useful for verifying the configuration and operation of the ASA and surrounding communications links, as well as for testing other network devices.
Information About Ping
A ping is sent to an IP address and it returns a reply. This process enables network devices to discover, identify, and test each other.
The Ping tool uses ICMP (as described in RFC 777 and RFC 792) to define an echo request-and-reply transaction between two network devices. The echo request packet is sent to the IP address of a network device. The receiving device reverses the source and destination address and sends the packet back as the echo reply.
Administrators can use the ASDM Ping interactive diagnostic tool in these ways:
- Loopback testing of two interfaces—A ping may be initiated from one interface to another on the same ASA, as an external loopback test to verify basic “up” status and operation of each interface.
- Pinging to an ASA—The Ping tool can ping an interface on another ASA to verify that it is up and responding.
- Pinging through an ASA—Ping packets originating from the Ping tool may pass through an intermediate ASA on their way to a device. The echo packets will also pass through two of its interfaces as they return. This procedure can be used to perform a basic test of the interfaces, operation, and response time of the intermediate unit.
- Pinging to test questionable operation of a network device—A ping may be initiated from an ASA interface to a network device that is suspected of functioning incorrectly. If the interface is configured correctly and an echo is not received, there may be problems with the device.
- Pinging to test intermediate communications—A ping may be initiated from an ASA interface to a network device that is known to be functioning correctly and returning echo requests. If the echo is received, the correct operation of any intermediate devices and physical connectivity is confirmed.
Pinging From an ASA Interface
For basic testing of an interface, you can initiate a ping from an ASA interface to a network device that you know is functioning correctly and returning replies through the intermediate communications path. For basic testing, make sure you do the following:
- Verify receipt of the ping from the ASA interface by the “known good” device. If the ping is not received, a problem with the transmitting hardware or interface configuration may exist.
- If the ASA interface is configured correctly and it does not receive an echo reply from the “known good” device, problems with the interface hardware receiving function may exist. If a different interface with “known good” receiving capability can receive an echo after pinging the same “known good” device, the hardware receiving problem of the first interface is confirmed.
Pinging to an ASA Interface
When you try to ping to an ASA interface, verify that the pinging response (ICMP echo reply) is enabled for that interface by choosing Tools > Ping. When pinging is disabled, the ASA cannot be detected by other devices or software applications, and does not respond to the ASDM Ping tool.
Pinging Through the ASA Interface
To verify that other types of network traffic from “known good” sources are being passed through the ASA, choose Monitoring > Interfaces > Interface Graphs or an SNMP management station.
To enable internal hosts to ping external hosts, configure ICMP inspection. Choose Configuration > Firewall > Service Policies.
Troubleshooting the Ping Tool
When pings fail to receive an echo, it may be the result of a configuration or operational error in an ASA, and not necessarily because of no response from the IP address being pinged. Before using the Ping tool to ping from, to, or through an ASA interface, perform the following basic checks:
- Verify that interfaces are configured. Choose Configuration > Device Setup > Interfaces.
- Verify that devices in the intermediate communications path, such as switches or routers, are correctly delivering other types of network traffic.
- Make sure that traffic of other types from “known good” sources is being passed. Choose Monitoring > Interfaces > Interface Graphs.
Using the Ping Tool
To use the Ping tool, perform the following steps:
Step 1![]() In the main ASDM application window, choose Tools > Ping.
In the main ASDM application window, choose Tools > Ping.
Step 2![]() Enter the destination IP address for the ICMP echo request packets in the IP Address field.
Enter the destination IP address for the ICMP echo request packets in the IP Address field.
Ping also supports IPv6 addresses.
Note![]() If a hostname has been assigned in the Configuration > Firewall > Objects > Service Objects/Groups pane, you can use the hostname in place of the IP address.
If a hostname has been assigned in the Configuration > Firewall > Objects > Service Objects/Groups pane, you can use the hostname in place of the IP address.
Step 3![]() (Optional) Choose the ASA interface that transmits the echo request packets from the drop-down list. If it is not specified, the ASA checks the routing table to find the destination address and uses the required interface.
(Optional) Choose the ASA interface that transmits the echo request packets from the drop-down list. If it is not specified, the ASA checks the routing table to find the destination address and uses the required interface.
Step 4![]() Click Ping to send an ICMP echo request packet from the specified or default interface to the specified IP address and start the response timer.
Click Ping to send an ICMP echo request packet from the specified or default interface to the specified IP address and start the response timer.
The response appears in the Ping Output area. Three attempts are made to ping the IP address, and results display the following fields:
- The IP address of the device pinged or a device name, if available. The name of the device, if assigned, may be displayed, even if NO response is the result.
- When the ping is transmitted, a millisecond timer starts with a specified maximum, or timeout value. This timer is useful for testing the relative response times of different routes or activity levels.
- Example Ping output:
Sending 5, 100-byte ICMP Echos to out-pc, timeout is 2 seconds:
!!!!!
Success rate is 100 percent (5/5), round-trip min/avg/max = 1/1/1 ms
If the ping fails, the output is as follows:
Step 5![]() To enter a new IP address, click Clear Screen to remove the previous response from the Ping output area.
To enter a new IP address, click Clear Screen to remove the previous response from the Ping output area.
Determining Packet Routing with Traceroute
The Traceroute tool helps you to determine the route that packets will take to their destination. The tool prints the result of each probe sent. Every line of output corresponds to a TTL value in increasing order. The following table lists the output symbols printed by this tool.
|
|
|
|---|---|
No response was received for the probe within the timeout period. |
|
For each node, the round-trip time (in milliseconds) for the specified number of probes. |
|
To use the Traceroute tool, perform the following steps:
Step 1![]() In the main ASDM application window, choose Tools > Traceroute.
In the main ASDM application window, choose Tools > Traceroute.
The Traceroute dialog box appears.
Step 2![]() Enter hostname or IP address to which the route is traced. If the hostname is given, define it by choosing Configuration > Firewall > Objects > Service Objects/Groups, or configure a DNS server to enable this tool to resolve the hostname to an IP address.
Enter hostname or IP address to which the route is traced. If the hostname is given, define it by choosing Configuration > Firewall > Objects > Service Objects/Groups, or configure a DNS server to enable this tool to resolve the hostname to an IP address.
Step 3![]() Enter the amount of time in seconds to wait for a response before the connection times out. The default is three seconds.
Enter the amount of time in seconds to wait for a response before the connection times out. The default is three seconds.
Step 4![]() Type the destination port used by the UDP probe messages. The default is 33434.
Type the destination port used by the UDP probe messages. The default is 33434.
Step 5![]() Enter the number of probes to be sent at each TTL level. The default is three.
Enter the number of probes to be sent at each TTL level. The default is three.
Step 6![]() Specify the minimum and maximum TTL values for the first probes. The minimum default is one, but it can be set to a higher value to suppress the display of known hops. The maximum default is 30. The traceroute terminates when the packet reaches the destination or when the maximum value is reached.
Specify the minimum and maximum TTL values for the first probes. The minimum default is one, but it can be set to a higher value to suppress the display of known hops. The maximum default is 30. The traceroute terminates when the packet reaches the destination or when the maximum value is reached.
Step 7![]() Check the Specify source interface or IP address check box. Choose the source interface or IP address for the packet trace from the drop-down list. This IP address must be the IP address of one of the interfaces. In transparent mode, it must be the management IP address of the ASA.
Check the Specify source interface or IP address check box. Choose the source interface or IP address for the packet trace from the drop-down list. This IP address must be the IP address of one of the interfaces. In transparent mode, it must be the management IP address of the ASA.
Step 8![]() Check the Reverse Resolve check box to have the output display the names of hops encountered if name resolution is configured. Leave this check box unchecked to have the output display IP addresses.
Check the Reverse Resolve check box to have the output display the names of hops encountered if name resolution is configured. Leave this check box unchecked to have the output display IP addresses.
Step 9![]() Check the Use ICMP check box to specify the use of ICMP probe packets instea
Check the Use ICMP check box to specify the use of ICMP probe packets instea![]() d of UDP probe packets.
d of UDP probe packets.
Step 10![]() Click Trace Route to start the traceroute.
Click Trace Route to start the traceroute.
The Traceroute Output area displays detailed messages about the traceroute results.
Step 11![]() Click Clear Output to start a new traceroute.
Click Clear Output to start a new traceroute.
Tracing Packets with Packet Tracer
The packet tracer tool provides packet tracing for packet sniffing and network fault isolation, as well as detailed information about the packets and how they are processed by the ASA. If a configuration command did not cause the packet to drop, the packet tracer tool can provide information about the cause in an easily readable format.
In addition, you can trace the lifespan of a packet through the ASA to see whether the packet is operating correctly with the packet tracer tool. This tool enables you to do the following:
- Debug all packet drops in a production network.
- Verify the configuration is working as intended.
- Show all rules applicable to a packet, along with the CLI commands that caused the rule addition.
- Show a time line of packet changes in a data path.
- Inject tracer packets into the data path.
- Search for an IPv4 or IPv6 address based on the user identity and the FQDN.
To use the packet tracer, perform the following steps:
Step 1![]() In the main ASDM application window, choose Tools > Packet Tracer.
In the main ASDM application window, choose Tools > Packet Tracer.
The Cisco ASDM Packet Tracer dialog box appears.
Step 2![]() Choose the source interface for the packet trace from the drop-down list.
Choose the source interface for the packet trace from the drop-down list.
Step 3![]() Specify the protocol type for the packet trace. Available protocol types include ICMP, IP, TCP, and UDP.
Specify the protocol type for the packet trace. Available protocol types include ICMP, IP, TCP, and UDP.
Step 4![]() In the Source drop-down list, select one of the following options:
In the Source drop-down list, select one of the following options:
Select the Security Tag or Security Name options when you want to trace packets sent by the ASA when integrated with the Cisco TrustSec solution. Security names are created on the Cisco ISE and provide user-friendly names for security groups.
If a security policy is configured on the ASA with that security tags or security names, the ASA enforces the policy. (You can create security policies on the ASA that contain security tags or security names. To enforce policies based on security group names, the ASA needs the security group table to map security names to security tags.)
See the general operations configuration guide for information about configuring the ASA to integrate with the Cisco TrustSec solution.
Step 5![]() Based on the option you selected from the Source drop-down list, enter the corresponding text for the item you want to trace; for example, enter the source IP address for the packet trace in the Source IP Address field.
Based on the option you selected from the Source drop-down list, enter the corresponding text for the item you want to trace; for example, enter the source IP address for the packet trace in the Source IP Address field.
Step 6![]() For TCP and UDP only, choose the source port for the packet trace from the drop-down list.
For TCP and UDP only, choose the source port for the packet trace from the drop-down list.
Step 7![]() In the Destination drop-down list, select one of the following options:
In the Destination drop-down list, select one of the following options:
Step 8![]() Based on the option you selected from the Destination drop-down list, enter the corresponding text for the item you want to trace; for example, enter the source IP address for the packet trace in the Destination IP Address field.
Based on the option you selected from the Destination drop-down list, enter the corresponding text for the item you want to trace; for example, enter the source IP address for the packet trace in the Destination IP Address field.
Step 9![]() For TCP and UDP only, choose the destination port for the packet trace from the drop-down list.
For TCP and UDP only, choose the destination port for the packet trace from the drop-down list.
Step 10![]() For ICMP only, choose the type of packet trace from the Type drop-down list. Then enter the trace code and trace ID in the appropriate fields.
For ICMP only, choose the type of packet trace from the Type drop-down list. Then enter the trace code and trace ID in the appropriate fields.
Step 11![]() For IP only, enter the protocol number in the Protocol field. Valid values range from 0 to 255.
For IP only, enter the protocol number in the Protocol field. Valid values range from 0 to 255.
Step 12![]() Click Start to trace the packet.
Click Start to trace the packet.
The Information Display Area shows detailed messages about the results of the packet trace.
Note![]() To display a graphical representation of the packet trace, check the Show animation check box.
To display a graphical representation of the packet trace, check the Show animation check box.
Step 13![]() Click Clear to start a new packet trace.
Click Clear to start a new packet trace.
Monitoring Performance
To view ASA performance information in a graphical or tabular format, perform the following steps:
Step 1![]() In the ASDM main window, choose Monitoring > Properties > Connection Graphs > Perfmon.
In the ASDM main window, choose Monitoring > Properties > Connection Graphs > Perfmon.
Step 2![]() Select one or more entries from the Available Graphs list, then click Add to move them to the Selected Graphs list. To remove an entry from the Selected Graphs list, click Remove. The available options are the following:
Select one or more entries from the Available Graphs list, then click Add to move them to the Selected Graphs list. To remove an entry from the Selected Graphs list, click Remove. The available options are the following:
- AAA Perfmon—Displays the ASA AAA performance information.
- Inspection Perfmon—Displays the ASA inspection performance information.
- Web Perfmon—Displays the ASA web performance information, including URL access and URL server requests.
- Connections Perfmon—Displays the ASA connections performance information.
- Xlate Perfmon—Displays the ASA NAT performance information.
You can choose up to four types of statistics to show in one graph window. You can open multiple graph windows at the same time.
Step 3![]() To use an existing window title, select one from the drop-down list. To display graphs in a new window, enter a new window title in the Graph Window Title field.
To use an existing window title, select one from the drop-down list. To display graphs in a new window, enter a new window title in the Graph Window Title field.
Step 4![]() Click Show Graphs to view performance statistics in a new or updated graph window.
Click Show Graphs to view performance statistics in a new or updated graph window.
Step 5![]() Click the Table tab to view the same performance statistics in a tabular format.
Click the Table tab to view the same performance statistics in a tabular format.
Step 6![]() From the View drop-down list on either tab, choose to display updates to information in the following time periods: Real-time, data every 10 sec; Last 10 minutes, data every 10 sec; Last 60 minutes, data every 1 min; Last 12 hours, data every 12 minutes; or Last 5 days, data every two hours.
From the View drop-down list on either tab, choose to display updates to information in the following time periods: Real-time, data every 10 sec; Last 10 minutes, data every 10 sec; Last 60 minutes, data every 1 min; Last 12 hours, data every 12 minutes; or Last 5 days, data every two hours.
Step 7![]() (Optional) Click Export to display the Export Graph Data dialog box. The selected performance statistics to export are already checked.
(Optional) Click Export to display the Export Graph Data dialog box. The selected performance statistics to export are already checked.
Step 8![]() (Optional) Click Export again to display the Save dialog box.
(Optional) Click Export again to display the Save dialog box.
Step 9![]() (Optional) Click Save to save the performance statistics to a text file (.txt) on your local drive for future reference.
(Optional) Click Save to save the performance statistics to a text file (.txt) on your local drive for future reference.
Step 10![]() (Optional) Click Print to display the Print Graph dialog box.
(Optional) Click Print to display the Print Graph dialog box.
Step 11![]() (Optional) Choose the graph or table name from the drop-down list, then click Print to display the Print dialog box.
(Optional) Choose the graph or table name from the drop-down list, then click Print to display the Print dialog box.
Step 12![]() (Optional) Click OK to print the selected performance statistics.
(Optional) Click OK to print the selected performance statistics.
Monitoring System Resources
This section includes the following topics:
Blocks
To view the free and used memory blocks, perform the following steps:
Step 1![]() In the ASDM main window, choose Monitoring > Properties > System Resources Graphs > Blocks.
In the ASDM main window, choose Monitoring > Properties > System Resources Graphs > Blocks.
Step 2![]() Select one or more entries from the Available Graphs list, then click Add to move them to the Selected Graphs list. To remove an entry from the Selected Graphs list, click Remove. The available options are the following:
Select one or more entries from the Available Graphs list, then click Add to move them to the Selected Graphs list. To remove an entry from the Selected Graphs list, click Remove. The available options are the following:
You can choose up to four types of statistics to show in one graph window. You can open multiple graph windows at the same time.
Step 3![]() To use an existing window title, select one from the drop-down list. To display graphs in a new window, enter a new window title in the Graph Window Title field.
To use an existing window title, select one from the drop-down list. To display graphs in a new window, enter a new window title in the Graph Window Title field.
Step 4![]() Click Show Graphs to view system
Click Show Graphs to view system![]() resource statistics in a new or updated graph window.
resource statistics in a new or updated graph window.
Step 5![]() Click the Table tab to view the same performance statistics in a tabular format.
Click the Table tab to view the same performance statistics in a tabular format.
Step 6![]() From the View drop-down list on either tab, choose to display updates to information in the following time periods: Real-time, data every 10 sec; Last 10 minutes, data every 10 sec; Last 60 minutes, data every 1 min; Last 12 hours, data every 12 minutes; or Last 5 days, data every two hours.
From the View drop-down list on either tab, choose to display updates to information in the following time periods: Real-time, data every 10 sec; Last 10 minutes, data every 10 sec; Last 60 minutes, data every 1 min; Last 12 hours, data every 12 minutes; or Last 5 days, data every two hours.
Step 7![]() (Optional) Click Export to display the Export Graph Data dialog box. The selected memory block statistics to export are already checked.
(Optional) Click Export to display the Export Graph Data dialog box. The selected memory block statistics to export are already checked.
Step 8![]() (Optional) Click Export again to display the Save dialog box.
(Optional) Click Export again to display the Save dialog box.
Step 9![]() (Optional) Click Save to save the memory block statistics to a text file (.txt) on your local drive for future reference.
(Optional) Click Save to save the memory block statistics to a text file (.txt) on your local drive for future reference.
Step 10![]() (Optional) Click Print to display the Print Graph dialog box.
(Optional) Click Print to display the Print Graph dialog box.
Step 11![]() (Optional) Choose the graph or table name from the drop-down list, then click Print to display the Print dialog box.
(Optional) Choose the graph or table name from the drop-down list, then click Print to display the Print dialog box.
Step 12![]() (Optional) Click OK to print the selected memory block statistics.
(Optional) Click OK to print the selected memory block statistics.
CPU
To view the CPU utilization, perform the following steps:
Step 1![]() In the ASDM main window, choose Monitoring > Properties > System Resources Graphs > CPU.
In the ASDM main window, choose Monitoring > Properties > System Resources Graphs > CPU.
Step 2![]() Select one or more entries from the Available Graphs list, then click Add to move them to the Selected Graphs list. To remove an entry from the Selected Graphs list, click Remove.
Select one or more entries from the Available Graphs list, then click Add to move them to the Selected Graphs list. To remove an entry from the Selected Graphs list, click Remove.
You can choose up to four types of statistics to show in one graph window. You can open multiple graph windows at the same time.
Step 3![]() To use an existing window title, select one from the drop-down list. To display graphs in a new window, enter a new window title in the Graph Window Title field.
To use an existing window title, select one from the drop-down list. To display graphs in a new window, enter a new window title in the Graph Window Title field.
Step 4![]() Click Show Graphs to view system
Click Show Graphs to view system![]() resource statistics in a new or updated graph window.
resource statistics in a new or updated graph window.
Step 5![]() Click the Table tab to view the same performance statistics in a tabular format.
Click the Table tab to view the same performance statistics in a tabular format.
Step 6![]() From the View drop-down list on either tab, choose to display updates to information in the following time periods: Real-time, data every 10 sec; Last 10 minutes, data every 10 sec; Last 60 minutes, data every 1 min; Last 12 hours, data every 12 minutes; or Last 5 days, data every two hours.
From the View drop-down list on either tab, choose to display updates to information in the following time periods: Real-time, data every 10 sec; Last 10 minutes, data every 10 sec; Last 60 minutes, data every 1 min; Last 12 hours, data every 12 minutes; or Last 5 days, data every two hours.
Step 7![]() (Optional) Click Export to display the Export Graph Data dialog box. The selected CPU utilization statistics to export are already checked.
(Optional) Click Export to display the Export Graph Data dialog box. The selected CPU utilization statistics to export are already checked.
Step 8![]() (Optional) Click Export again to display the Save dialog box.
(Optional) Click Export again to display the Save dialog box.
Step 9![]() (Optional) Click Save to save the CPU utilization statistics to a text file (.txt) on your local drive for future reference.
(Optional) Click Save to save the CPU utilization statistics to a text file (.txt) on your local drive for future reference.
Step 10![]() (Optional) Click Print to display the Print Graph dialog box.
(Optional) Click Print to display the Print Graph dialog box.
Step 11![]() (Optional) Choose the graph or table name from the drop-down list, then click Print to display the Print dialog box.
(Optional) Choose the graph or table name from the drop-down list, then click Print to display the Print dialog box.
Step 12![]() (Optional) Click OK to print the selected CPU utilization statistics.
(Optional) Click OK to print the selected CPU utilization statistics.
Memory
To view the memory utilization, perform the following steps:
Step 1![]() In the ASDM main window, choose Monitoring > Properties > System Resources Graphs > Blocks.
In the ASDM main window, choose Monitoring > Properties > System Resources Graphs > Blocks.
Step 2![]() Select one or more entries from the Available Graphs list, then click Add to move them to the Selected Graphs list. To remove an entry from the Selected Graphs list, click Remove. The available options are the following:
Select one or more entries from the Available Graphs list, then click Add to move them to the Selected Graphs list. To remove an entry from the Selected Graphs list, click Remove. The available options are the following:
You can choose up to four types of statistics to show in one graph window. You can open multiple graph windows at the same time.
Step 3![]() To use an existing window title, select one from the drop-down list. To display graphs in a new window, enter a new window title in the Graph Window Title field.
To use an existing window title, select one from the drop-down list. To display graphs in a new window, enter a new window title in the Graph Window Title field.
Step 4![]() Click Show Graphs to view system
Click Show Graphs to view system![]() resource statistics in a new or updated graph window.
resource statistics in a new or updated graph window.
Step 5![]() Click the Table tab to view the same performance statistics in a tabular format.
Click the Table tab to view the same performance statistics in a tabular format.
Step 6![]() From the View drop-down list on either tab, choose to display updates to information in the following time periods: Real-time, data every 10 sec; Last 10 minutes, data every 10 sec; Last 60 minutes, data every 1 min; Last 12 hours, data every 12 minutes; or Last 5 days, data every two hours.
From the View drop-down list on either tab, choose to display updates to information in the following time periods: Real-time, data every 10 sec; Last 10 minutes, data every 10 sec; Last 60 minutes, data every 1 min; Last 12 hours, data every 12 minutes; or Last 5 days, data every two hours.
Step 7![]() (Optional) Click Export to display the Export Graph Data dialog box. The selected memory utilization statistics to export are already checked.
(Optional) Click Export to display the Export Graph Data dialog box. The selected memory utilization statistics to export are already checked.
Step 8![]() (Optional) Click Export again to display the Save dialog box.
(Optional) Click Export again to display the Save dialog box.
Step 9![]() (Optional) Click Save to save the memory utilization statistics to a text file (.txt) on your local drive for future reference.
(Optional) Click Save to save the memory utilization statistics to a text file (.txt) on your local drive for future reference.
Step 10![]() (Optional) Click Print to display the Print Graph dialog box.
(Optional) Click Print to display the Print Graph dialog box.
Step 11![]() (Optional) Choose the graph or table name from the drop-down list, then click Print to display the Print dialog box.
(Optional) Choose the graph or table name from the drop-down list, then click Print to display the Print dialog box.
Step 12![]() (Optional) Click OK to print the selected memory utilization statistics.
(Optional) Click OK to print the selected memory utilization statistics.
Monitoring Connections
To view current connections in a tabular format, in the ASDM main window, choose Monitoring > Properties > Connections. Each connection is identified by the following parameters:
Monitoring Per-Process CPU Usage
You can monitor the processes that run on the CPU. You can obtain information about the percentage of CPU that is used by a certain process. CPU usage statistics are sorted in descending order to display the highest consumer at the top. Also included is information about the load on the CPU per process, at 5 seconds, 1 minute, and 5 minutes before the log time. This information is updated automatically every 5 seconds to provide real-time statistics. In ASDM, it is updated every 30 seconds.
To view CPU usage on a per-process basis, perform the following steps:
Step 1![]() In the ASDM main window, choose Monitoring > Properties > Per-Process CPU Usage.
In the ASDM main window, choose Monitoring > Properties > Per-Process CPU Usage.
Step 2![]() To pause the auto-refresh of the screen, click Stop auto-refresh.
To pause the auto-refresh of the screen, click Stop auto-refresh.
Step 3![]() To save the information on the screen to a local text file, click Save log to local file.
To save the information on the screen to a local text file, click Save log to local file.
Step 4![]() Enter the name of the text file, then click Save.
Enter the name of the text file, then click Save.
To color code processes according to their CPU usage range, click Configure CPU usage.
The Color Settings dialog box appears.
Step 5![]() Choose one of the following range options: 49% and below, 50% to 79%, and 80% and above.
Choose one of the following range options: 49% and below, 50% to 79%, and 80% and above.
Step 6![]() Click the foreground or background cell to display the Pick a Color dialog box, and select the foreground and background colors for the given ranges.
Click the foreground or background cell to display the Pick a Color dialog box, and select the foreground and background colors for the given ranges.
Step 7![]() Click one of the following tabs to pick the color palette: Swatches, HSB, or RGB. When you are done, click OK.
Click one of the following tabs to pick the color palette: Swatches, HSB, or RGB. When you are done, click OK.
Step 8![]() Click OK to view the color-coded entries.
Click OK to view the color-coded entries.
Step 9![]() Click Refresh to refresh the data manually at any time.
Click Refresh to refresh the data manually at any time.
 Feedback