Catalog
The Catalog allows you to view all the applications that you have installed or enabled on the Cisco DCNM. Few applications are installed and are operational by default, when you install the Cisco DCNM.
The following applications appears based on the Cisco DCNM Deployments:
-
Health Monitor (2.1)
-
PTP Monitoring (1.1)
-
Kibana (2.0)
-
Programmable report (1.1.0)
-
Elastic Service (1.1)
-
Compliance (4.0.0)
-
Debug Tools (2.1)
-
IPAM Integrator (1.0)
-
Endpoint Locator (2.1)
-
Kubernetes Visualizer (1.1)
-
vmmplugin (4.1)
 Note |
The applications started by default, or also installed on the DCNM utilizes infrastructure services are operational, by default. |
You can install more applications from the App Center, via the Web UI.
For instructions about downloading, adding, starting, stopping, and deleting applications from the Cisco DCNM Web UI, see Installing and Deploying Applications.
Health Monitor
The Health Monitor helps you to monitor the infrastructure health and status. You can monitor the Alerts, Service Utilization, and Compute Utilization using the Health Monitor application. When you install or upgrade to 11.2(1), the Health Monitor application is installed and operational, by default.
To launch the Health Monitor app, on the Cisco DCNM Web UI, choose Applications. On the Catalog tab, click on Health Monitor to launch the application.
Note |
Health Monitor application is installed by default in Cisco DCNM cluster mode. |
Health Monitor app broadly monitors and alerts on the following metrics for Services, Computes and DCNM server:
-
CPU utilization
-
Memory utilization
-
Network I/O (eth0)
-
Disk I/O
You can monitor the following using the Health Monitor application:
Alerts
The Alerts window provides information about the number of alerts that have occurred, from the specified date and time. You can view the alerts, based on the following categories, in the graphical view and the list view.
In the graphical view, the categories are:
-
Severity displays the alerts, based on the severity: Critical/Major/Minor/Info.
-
Type displays the alerts, based on the cluster type.
-
Compute displays the alerts, for each compute node.
-
Service displays the alerts, for all the services running on Cisco DCNM.
Click on the Refresh icon to refresh the alerts. Click on the list view icon to view the alerts in list format.
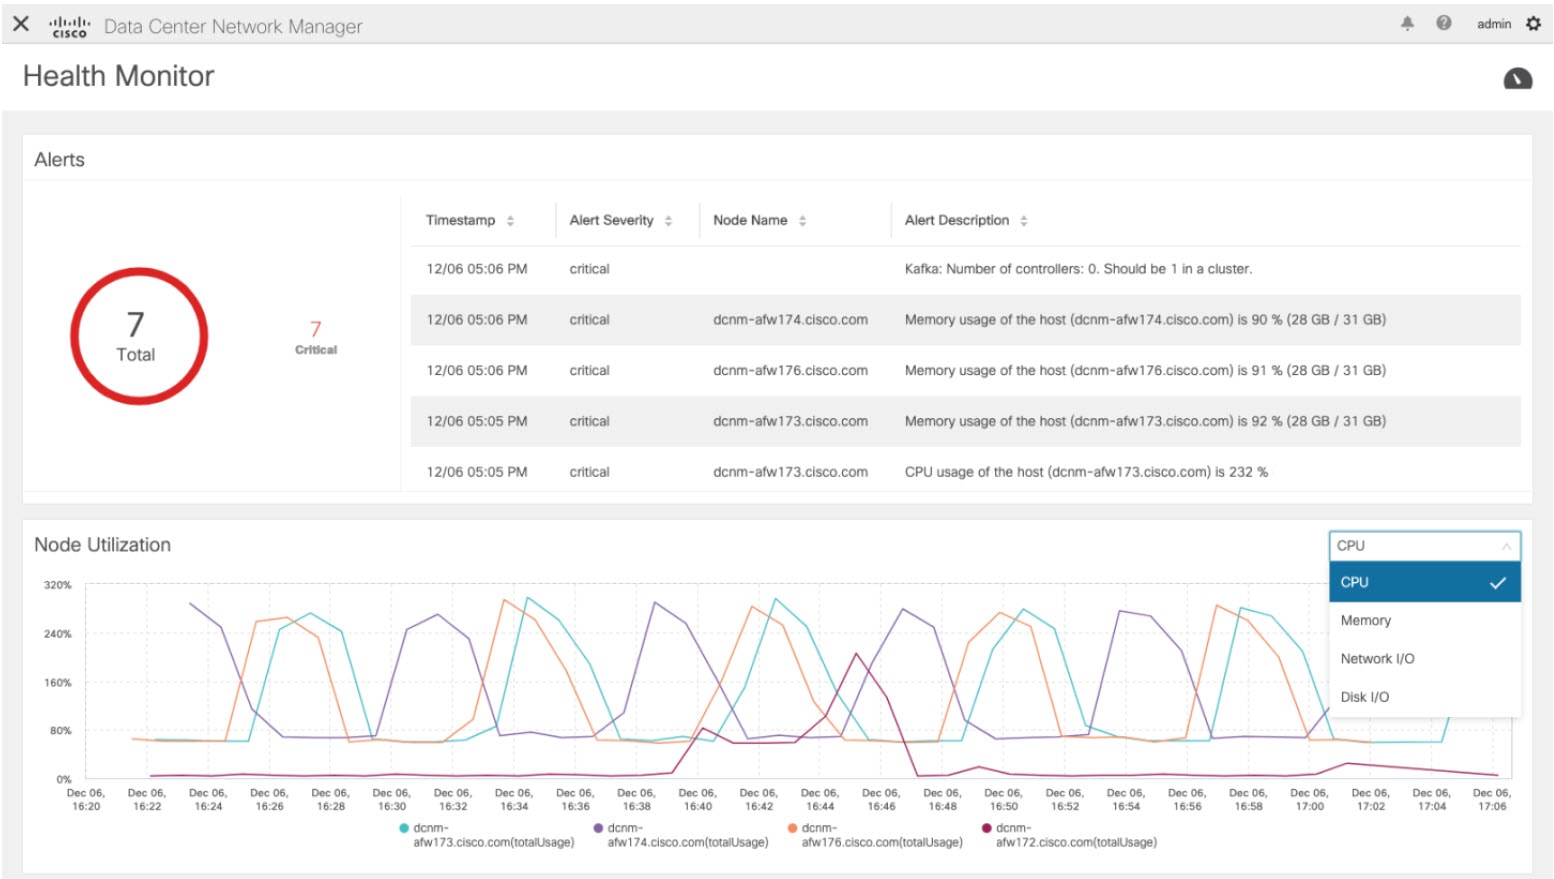
In the List View, alerts are displayed in tabular format with the following categories:
-
Timestamp displays the time when the alert triggers. Format is MM/DD HH:MM AM/PM.
-
Alert Severity displays the severity of alert.
-
Alert Type displays the cluster alert type.
-
Node Name displays the node name where the alert triggers.
-
Alert Description displays the summary of the alert.
Click on the right or left navigation arrows to move to the next or the previous page.
You can also choose to set the number of items to view on page. Select a suitable number from the Objects Per Page drop-down list.
Click on the Graphical representation icon to go to the graphical view. Click on Download Data icon to download alerts information for troubleshooting purposes.
Health Monitor generates alerts for the following metrics:
-
CPU utilization >= 65 %
-
Memory utilization >= 65 %
-
Disk utilization >= 65 %
-
Elasticsearch cluster status: Red/yellow
-
Elasticsearch unassigned shards > 0
-
Elasticsearch JVM heap used >= 65 %
-
Kafka partitions without leader: Controller offline partitions count > 0
-
Kafka controllers count: Controller active controller count != 1
-
Kafka partition leader: Controller unclear leader elections count > 0
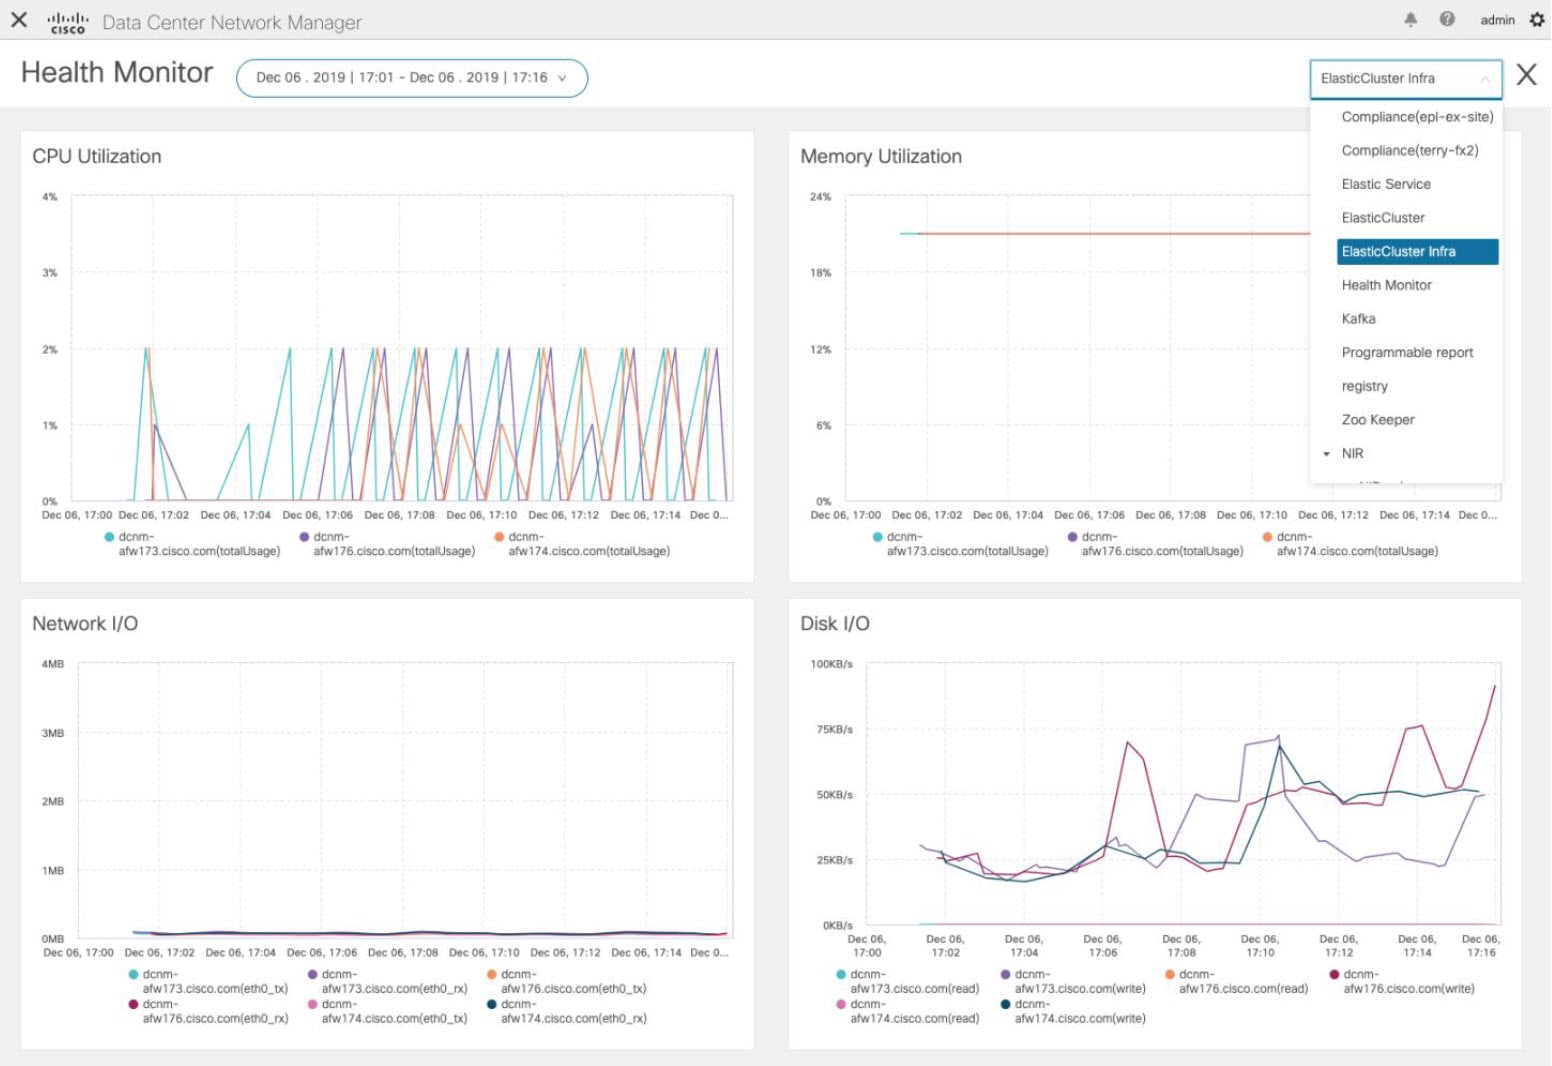
Service Utilization
You can monitor all the services running on the Cisco DCNM on this window. Based on the time range and the service, the graphical view shows the CPU and Memory utilization for service. Click on the Service Utilization icon on the top-right corner to launch the CPU utilization graphical view.
From the Time Range drop-down list, choose the time range for which you want to view the utilization. You can select a specific time interval to view the metrics during that time interval. Click the fields showing the date and time to select the required date and time interval. You can also click the date on the calendar to set range. Click Apply to confirm the time range.
From the Services drop-down list, choose the service to view its Service utilization. This list comprises of all the services that are currently running on the Cisco DCNM.
Select the Time Range to view the Service, the Cpu Utilization, and Memory Utilization graphs. You can hover over specific points on the respective graphs for more information on CPU and Memory utilization at specific time.
The memory utilization graphical view depicts the actual memory consumption (RAM) in Gigabytes (GB).
Click [X] icon on the top-right corner to close the Service Utilization window and revert to the Alerts window.
Guidelines and Limitations for Health Monitor in Service Utilization
-
The CPU utilization for applications without a CPU limit, like Kafka, ElasticSearch, FMserver, and so on, may show 100% utilization in the graphs. 100% utilization is because this application uses one or more cores.
-
The following alerts are triggered for the CPU utilization of applications:
-
Minor alert: 200-400 %
Major alert: 400-600%
Critical: > 600%
-
-
The transient message for Kafka controller counts appears as a severe alert sometimes. You can ignore the alert if it clears within two minutes after refresh.
-
The Disk I/O and Memory Utilization metrics are not available for Kafka and Elastic Service.
-
The Network I/O metric is not available for DCNM: FMServer and DCNM: Postgres.
-
The metrics does not auto-refresh. Navigate between different windows using the options in the drop-down list to refresh the metrics. Additionally, you can change the time range to refresh the metrics for a selected period.
-
There might be duplicate alerts for the same feature.
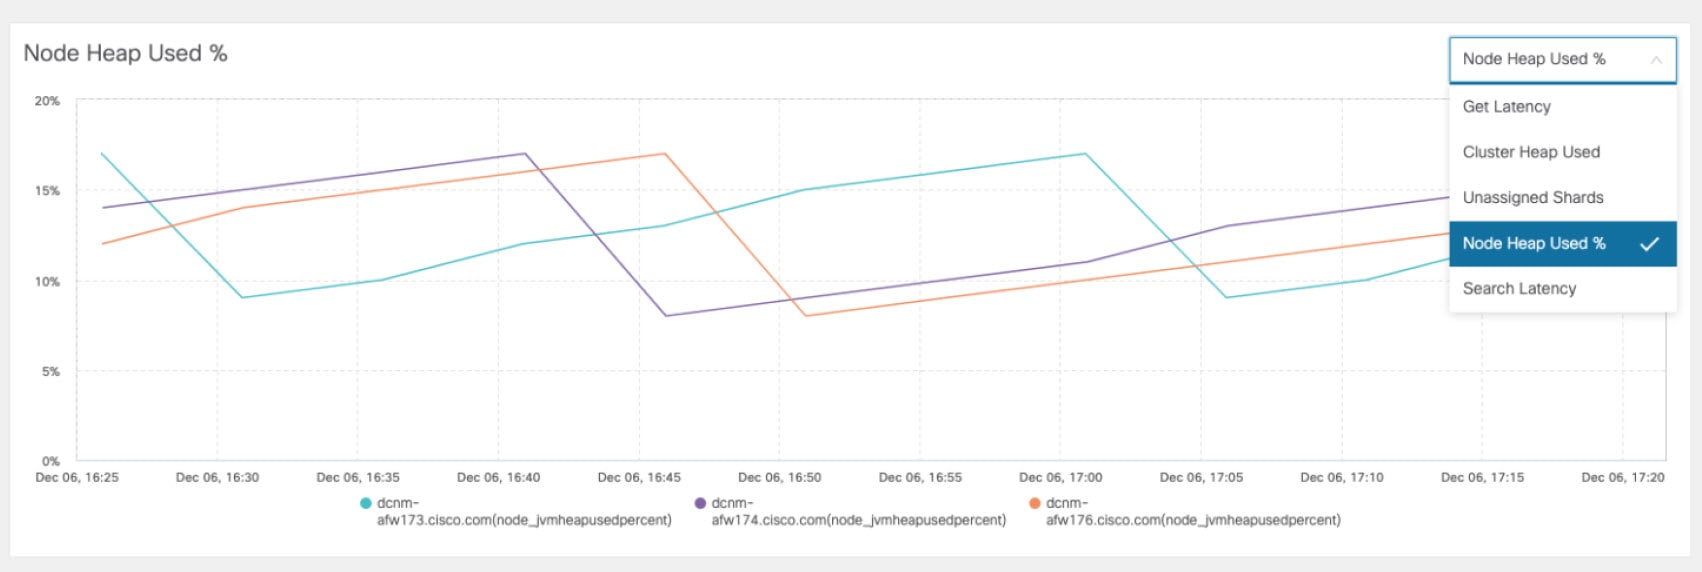
The following additional metrics are collected for Elastic Cluster:
-
Get latency: Latency for getting a single record by id
-
Cluster heap used: Heap memory used by the cluster
-
Unassigned shards: Count of unassigned shards
-
Node heap used percentage: Percentage heap memory used by the node
-
Search latency: Latency for getting a collection of records
The following additional metrics are collected for Kafka broker:
-
CPU: CPU utilization of broker
-
Memory: Memory utilization of broker
-
Heap memory: Heap memory utilized by broker
-
Total time: Network produce, network fetch follower, network fetch consumer time
-
Purgatory size: Server fetch purgatory size, server produce purgatory size of broker
-
Data in: Bytes in for the broker
-
Data out: Bytes out for the broker
-
Messages in: Messages received by the broker
-
Fetch request: Total fetch requests for the broker
-
ISR: In-sync-replicas expands and shrinks for the broker

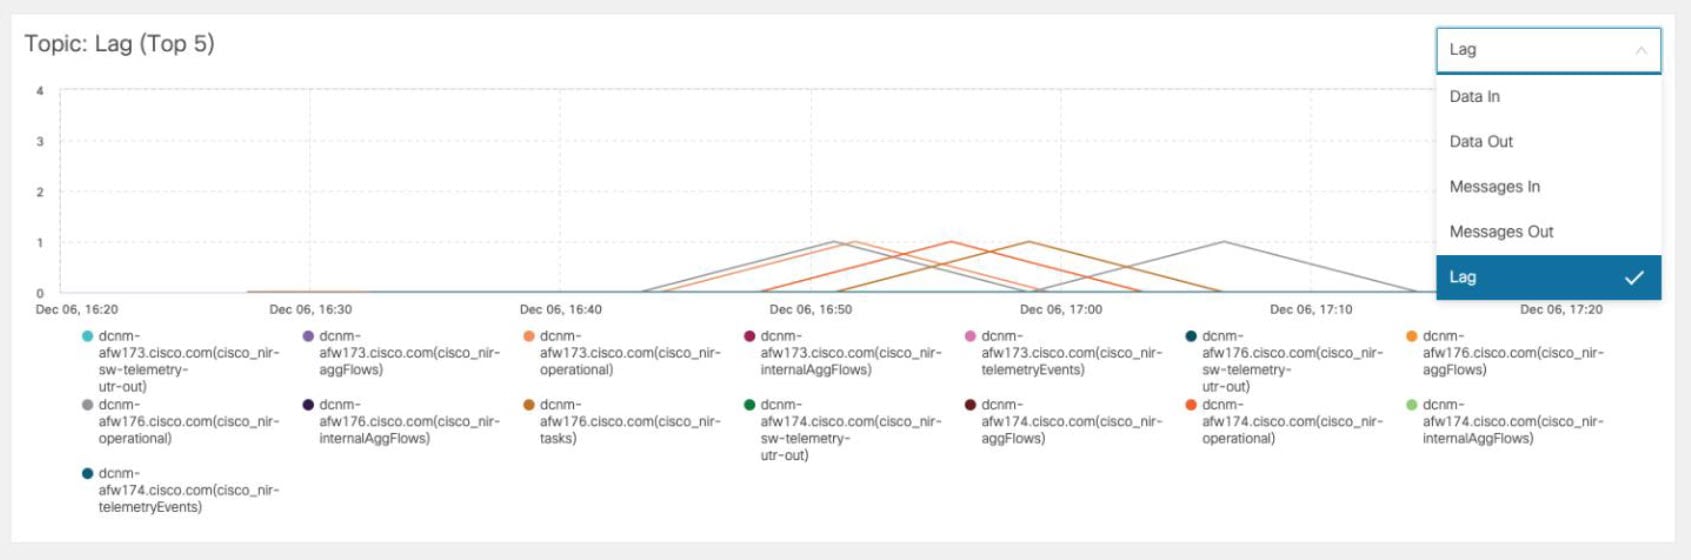
The following additional metrics are collected for top 5 Kafka topics:
-
Data in: Bytes in for the topic
-
Data out: Bytes out for the topic
-
Messages in: Message in count for topic
-
Messages out: Message out count for topic
-
Lag: Lag per topic
Compute Utilization
You can monitor all the computes installed with the Cisco DCNM. Based on the time range and the service, the graphical view shows the CPU and Memory utilization for service. Click on the Compute Utilization icon on the top-right corner to launch the CPU utilization graphical view.
From the Time Range drop-down list, choose the time range for which you want to view the utilization. You can select a specific time interval to view the metrics during that time interval. Click the fields showing the date and time to select the required date and time interval. You can also click the date on the calendar to set range. Click Apply to confirm the time range.
Select the Time Range to view the Service, the Cpu Utilization, and Memory Utilization graphs. You can hover over specific points on the respective graphs for more information on CPU and Memory utilization at specific time.
The memory utilization graphical view depicts the actual memory consumption (RAM) in Gigabytes (GB).
Click [X] icon on the top-right corner to close the Service Utilization window and revert to the Alerts window.
 Feedback