Cisco Data Center Network Manager
Cisco Data Center Network Manager (Cisco DCNM) automates the infrastructure of Cisco Nexus 5000, 6000, 7000, and 9000 Series Switches and Cisco MDS 9000 Series switches. Cisco DCNM enables you to manage multiple devices, while providing ready-to-use capabilities, such as, control, automation, monitoring, visualization, and troubleshooting.
 Note |
The documentation set for this product strives to use bias-free language. For the purposes of this documentation set, bias-free is defined as language that does not imply discrimination based on age, disability, gender, racial identity, ethnic identity, sexual orientation, socioeconomic status, and intersectionality. Exceptions may be present in the documentation due to language that is hardcoded in the user interfaces of the product software, language used based on RFP documentation, or language that is used by a referenced third-party product. |
Configuring the Device Connector is mandatory if you've deployed Cisco DCNM in LAN Fabric mode. If you did not configure Device Connector during installation, a message appears asking you to configure Device Connector everytime you login. If you check the Do not show again, the message will not appear. However, an alarm notification will be added under the Alarms icon.
The Cisco DCNM home page contains a navigation pane to the left, and shortcuts to a few Cisco DCNM features in the middle pane.
This guide provides comprehensive information about the UI functionality for Cisco DCNM LAN Fabric deployment.
The top pane displays the following UI elements:
-
Alerts and Notifications: You can view the alerts and event notifications by clicking the Alerts and Notifications icon, next to the Help icon, in the top pane of Cisco DCNM.
-
Help: Launches the context-sensitive online help.
-
Alarms: The Alarms icon flashes when there is an Alarm or when thresholds exceed for your Cisco DCNM Deployment. Click on the flashing Alarms icon to view the messages. The following alarms are displayed.
-
Interfaces Limit Exceeded for DCNM – If the maximum number of endpoints across all fabrics exceeds 100K, the Alarms icon flashes and displays a message.
-
Device Connector Disconnected – If the Device Connector was not configured during installation, this alarm appears to imply that the Device connector is not connected to Intersight. Choose Administration > Device Connector to configure the Device Connector and remove the alarm.
-
High Availability (HA) State of DCNM – If the Native HA setup is not synchronized. One of the nodes or both nodes may have stopped, failed, or not ready if the Alarms icon flashes. When the HA setup is synchronized, the notification clears out in 30 minutes (during the polling cycle) or when you logout and login to the Cisco DCNM Web UI.
-
Application down – If one or more applications are down, an error appears. An alarm message appears when the applications goes online or offline. Click on the respective alarm to navigate to the application on Web UI > Applications > Catalog.
-
Compute Node disconnected – An alarm message appears when one or more Compute node goes down.
-
-
User Role : Displays the role of the user who is currently logged in, for example, admin.
-
Gear icon: Click on the gear icon to see a drop-down list with the following options:
-
Logged in as: displays the user role of the current logged in user.
-
Change Password: Allows you to change the password for current logged in user.
If you are a network administrator user, you can modify the passwords of the other users.
-
About: Displays the Version, Installation Type, and time since when the Web UI is operational.
-
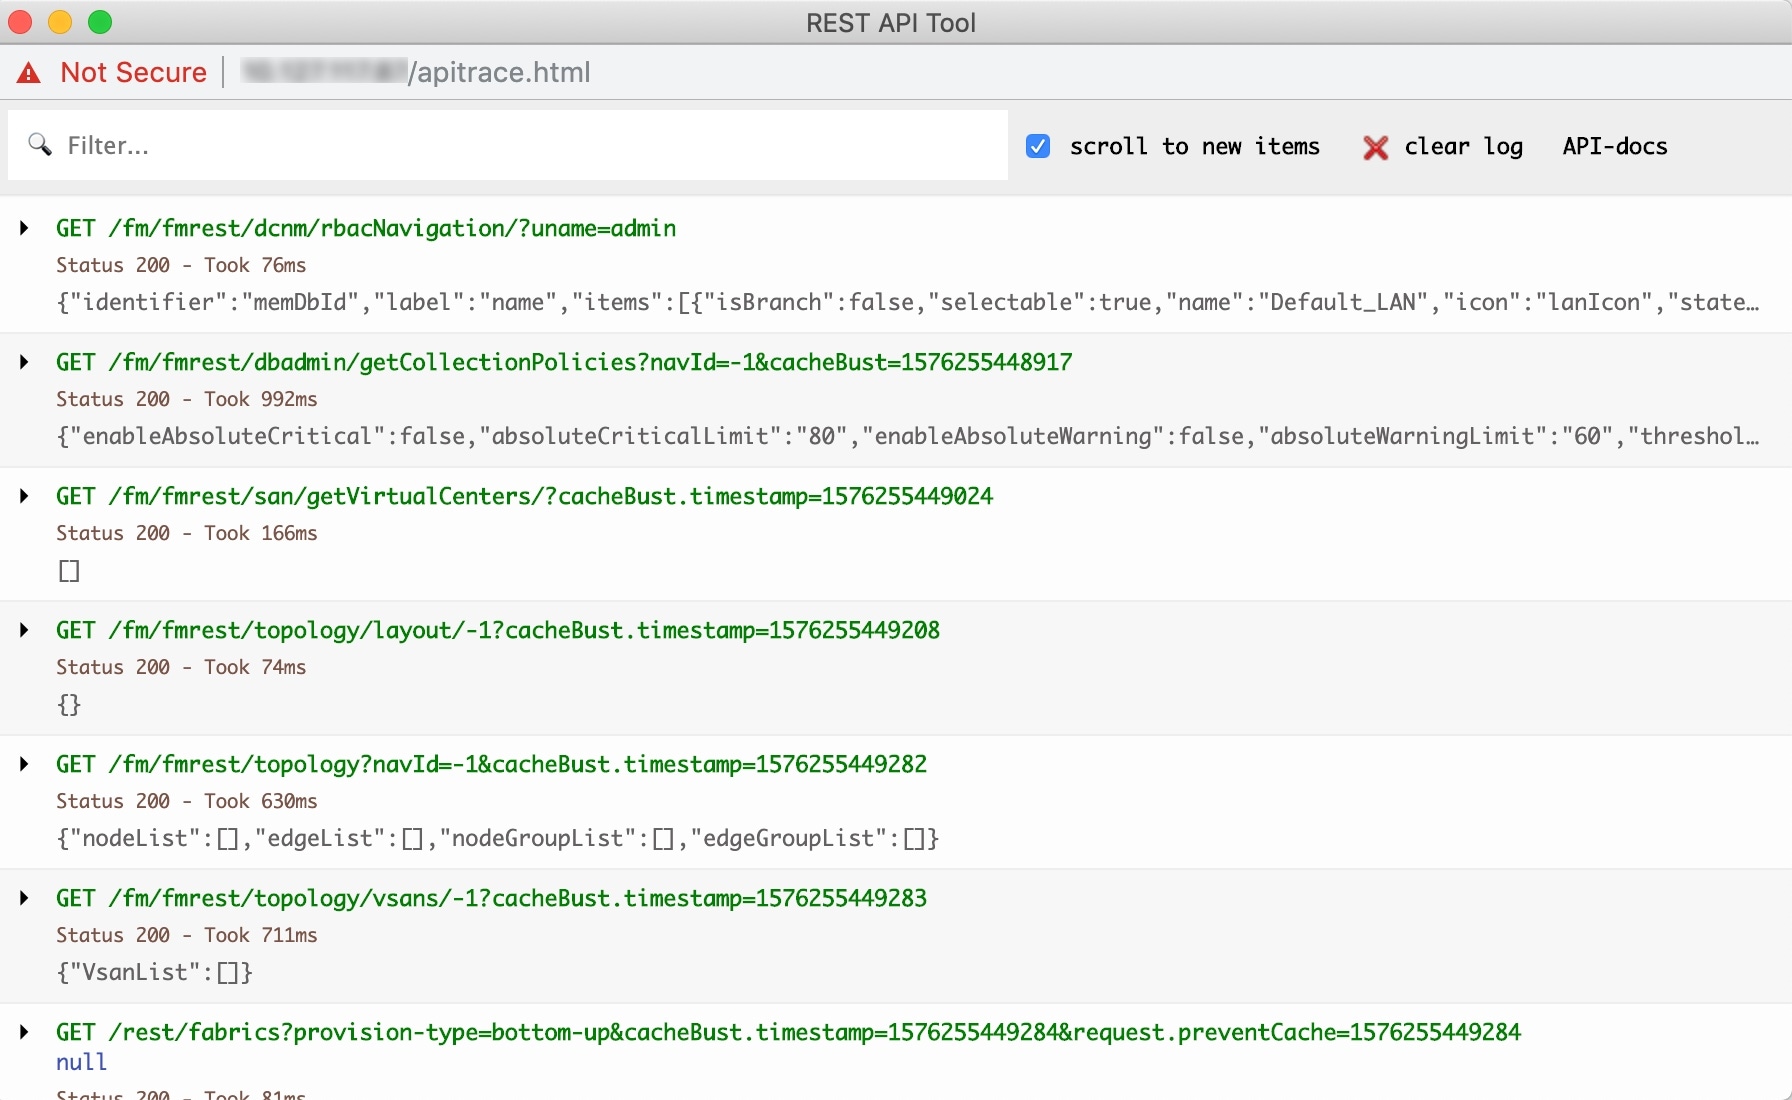
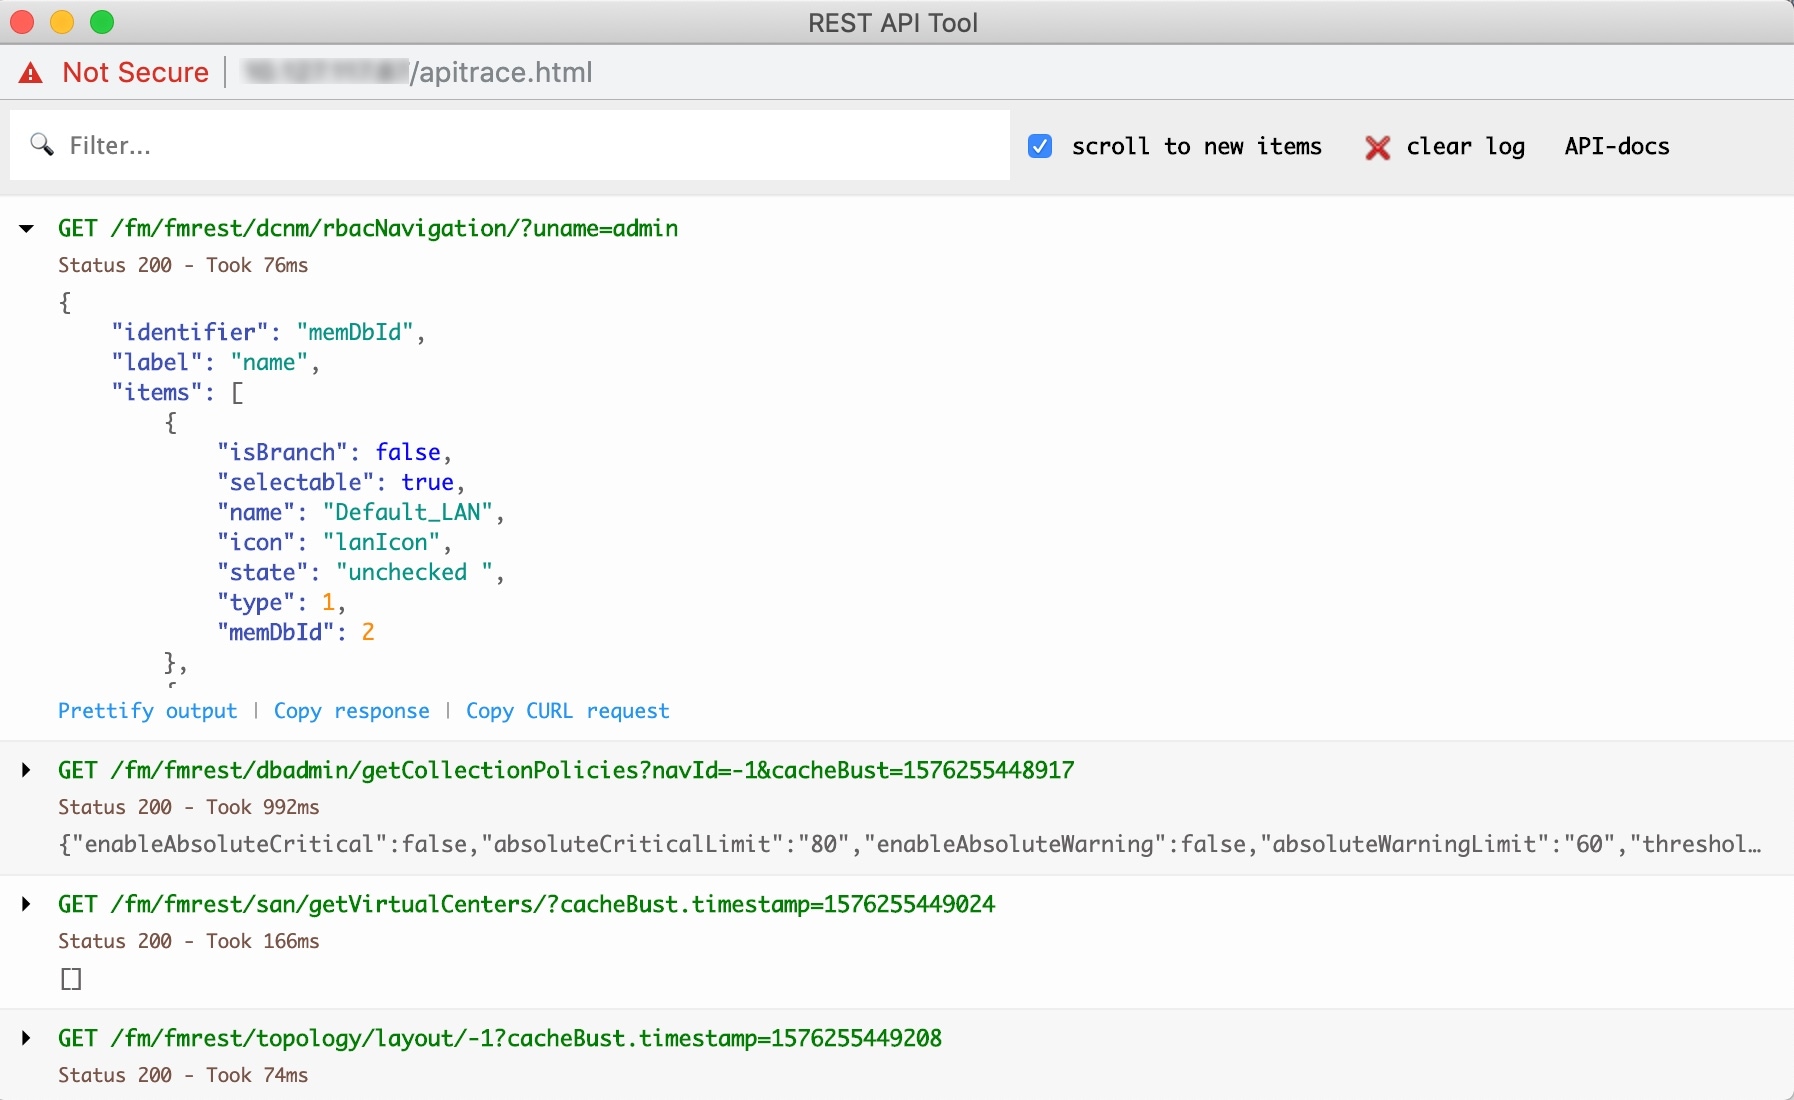
REST API Tool: Allows you to examine the APIs invoked for every operation. See the REST API Tool section for more information about the API inspection.
-
Logout: Allows you to terminate the Web UI and returns to the login screen.
-
For more information about Cisco DCNM, see:
 Feedback