|
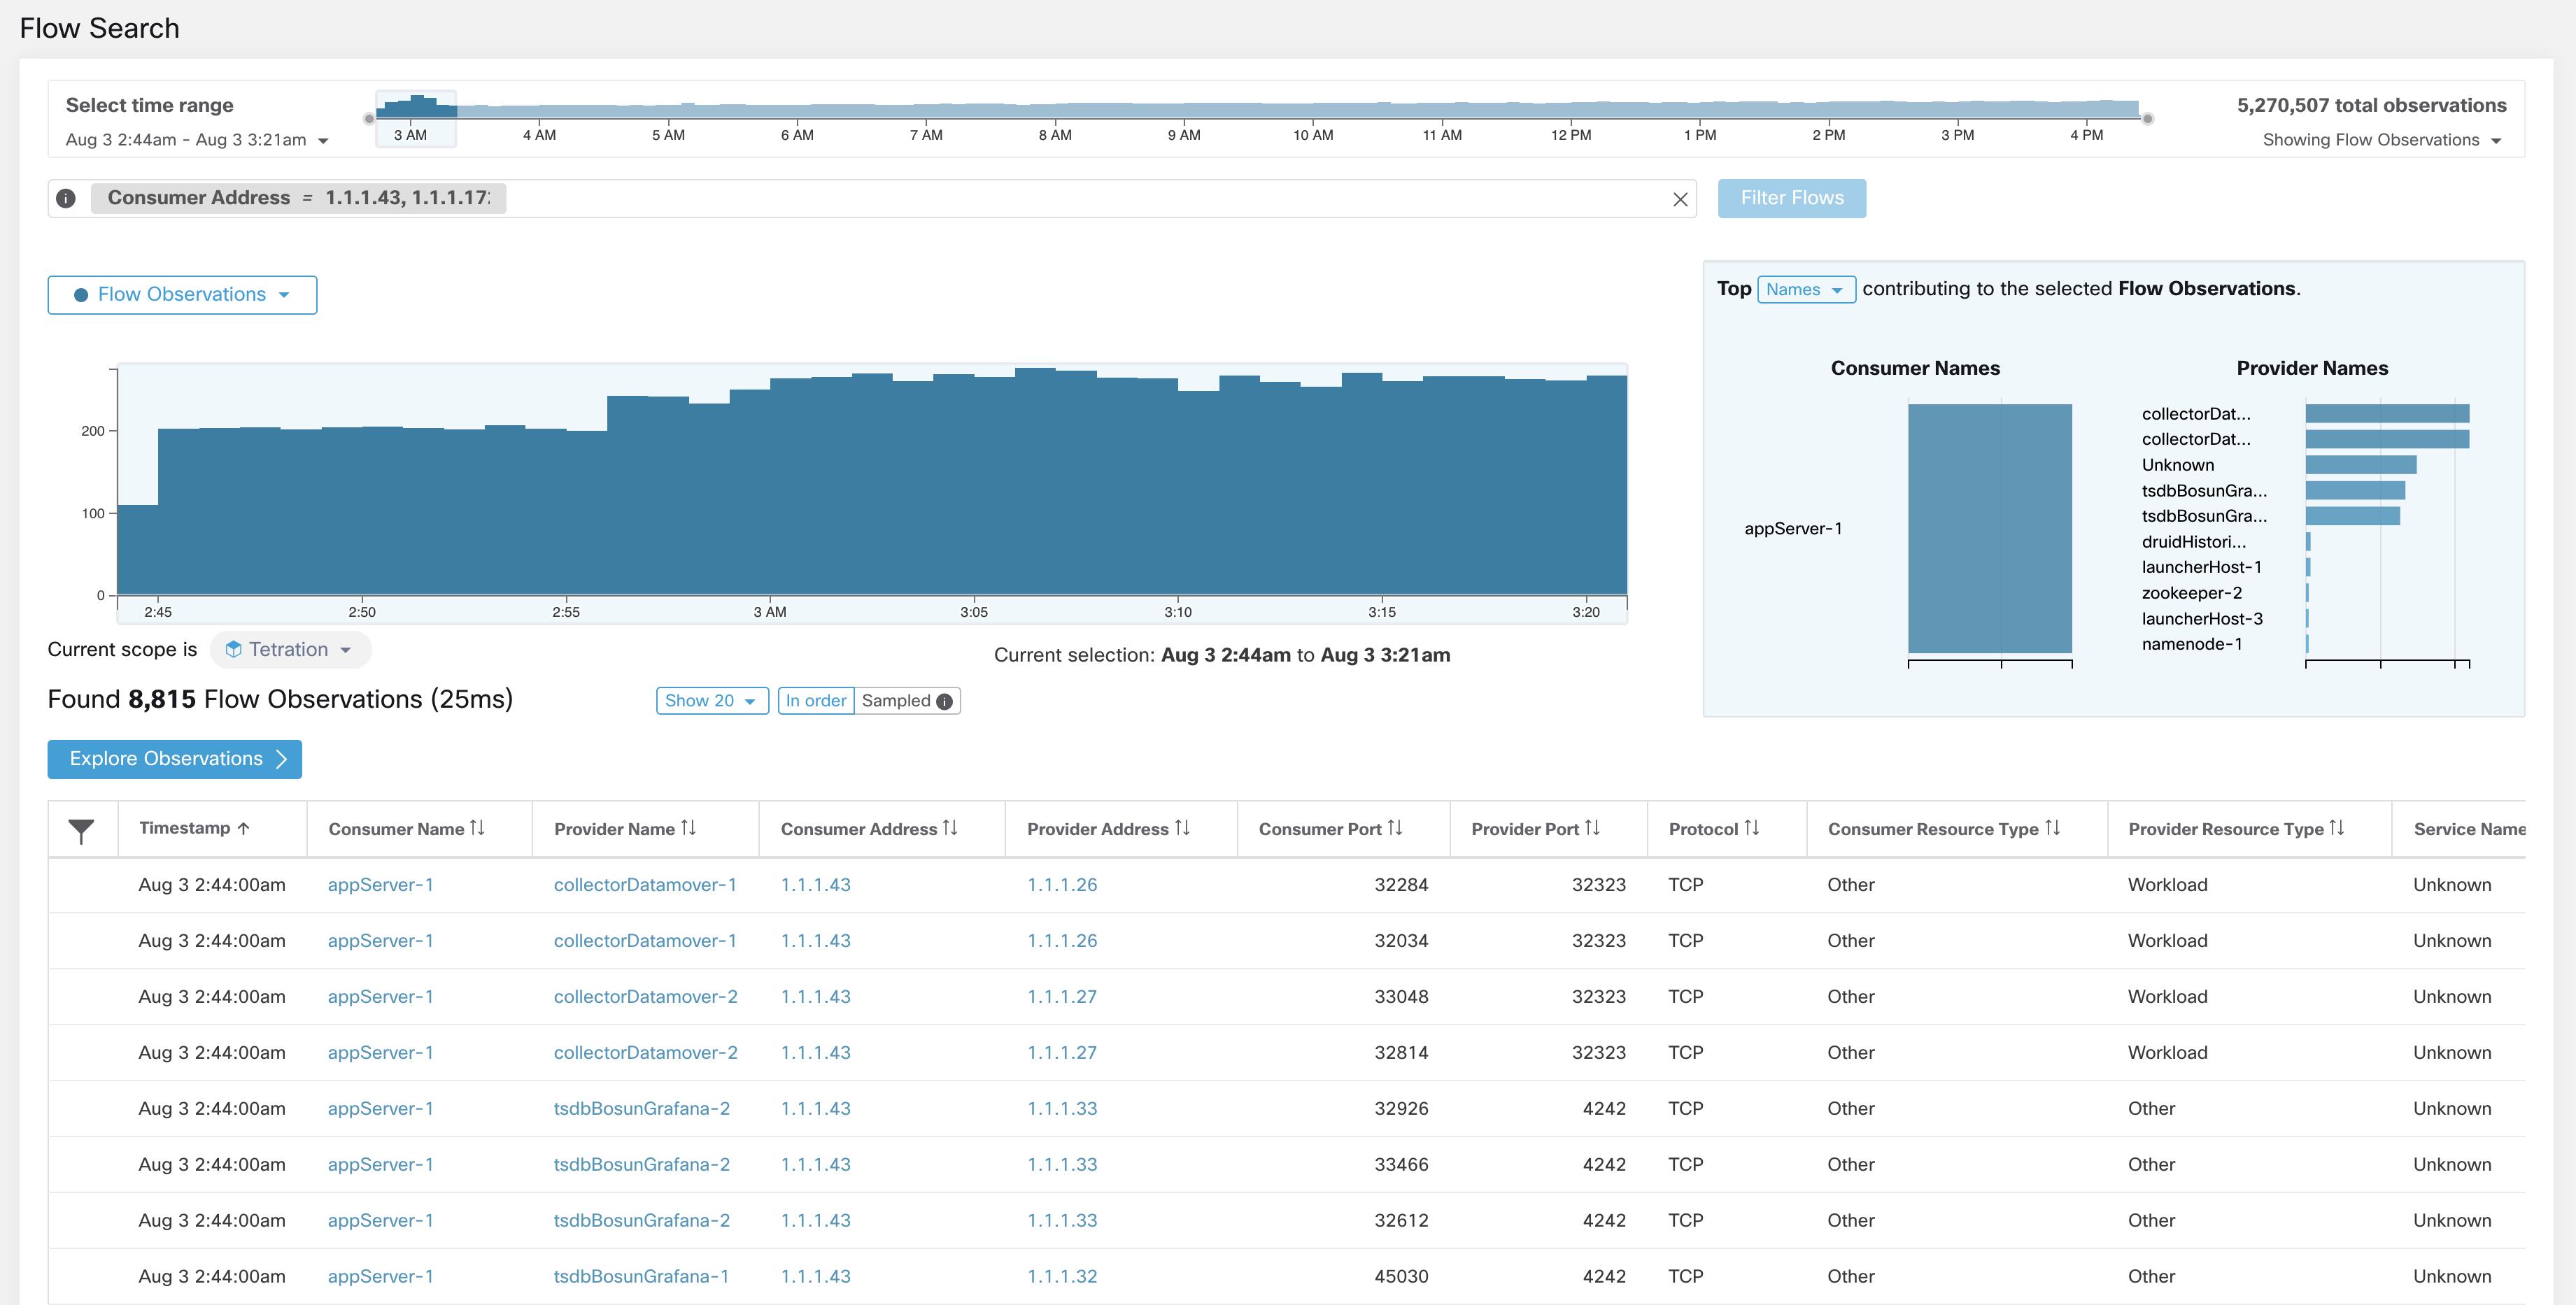
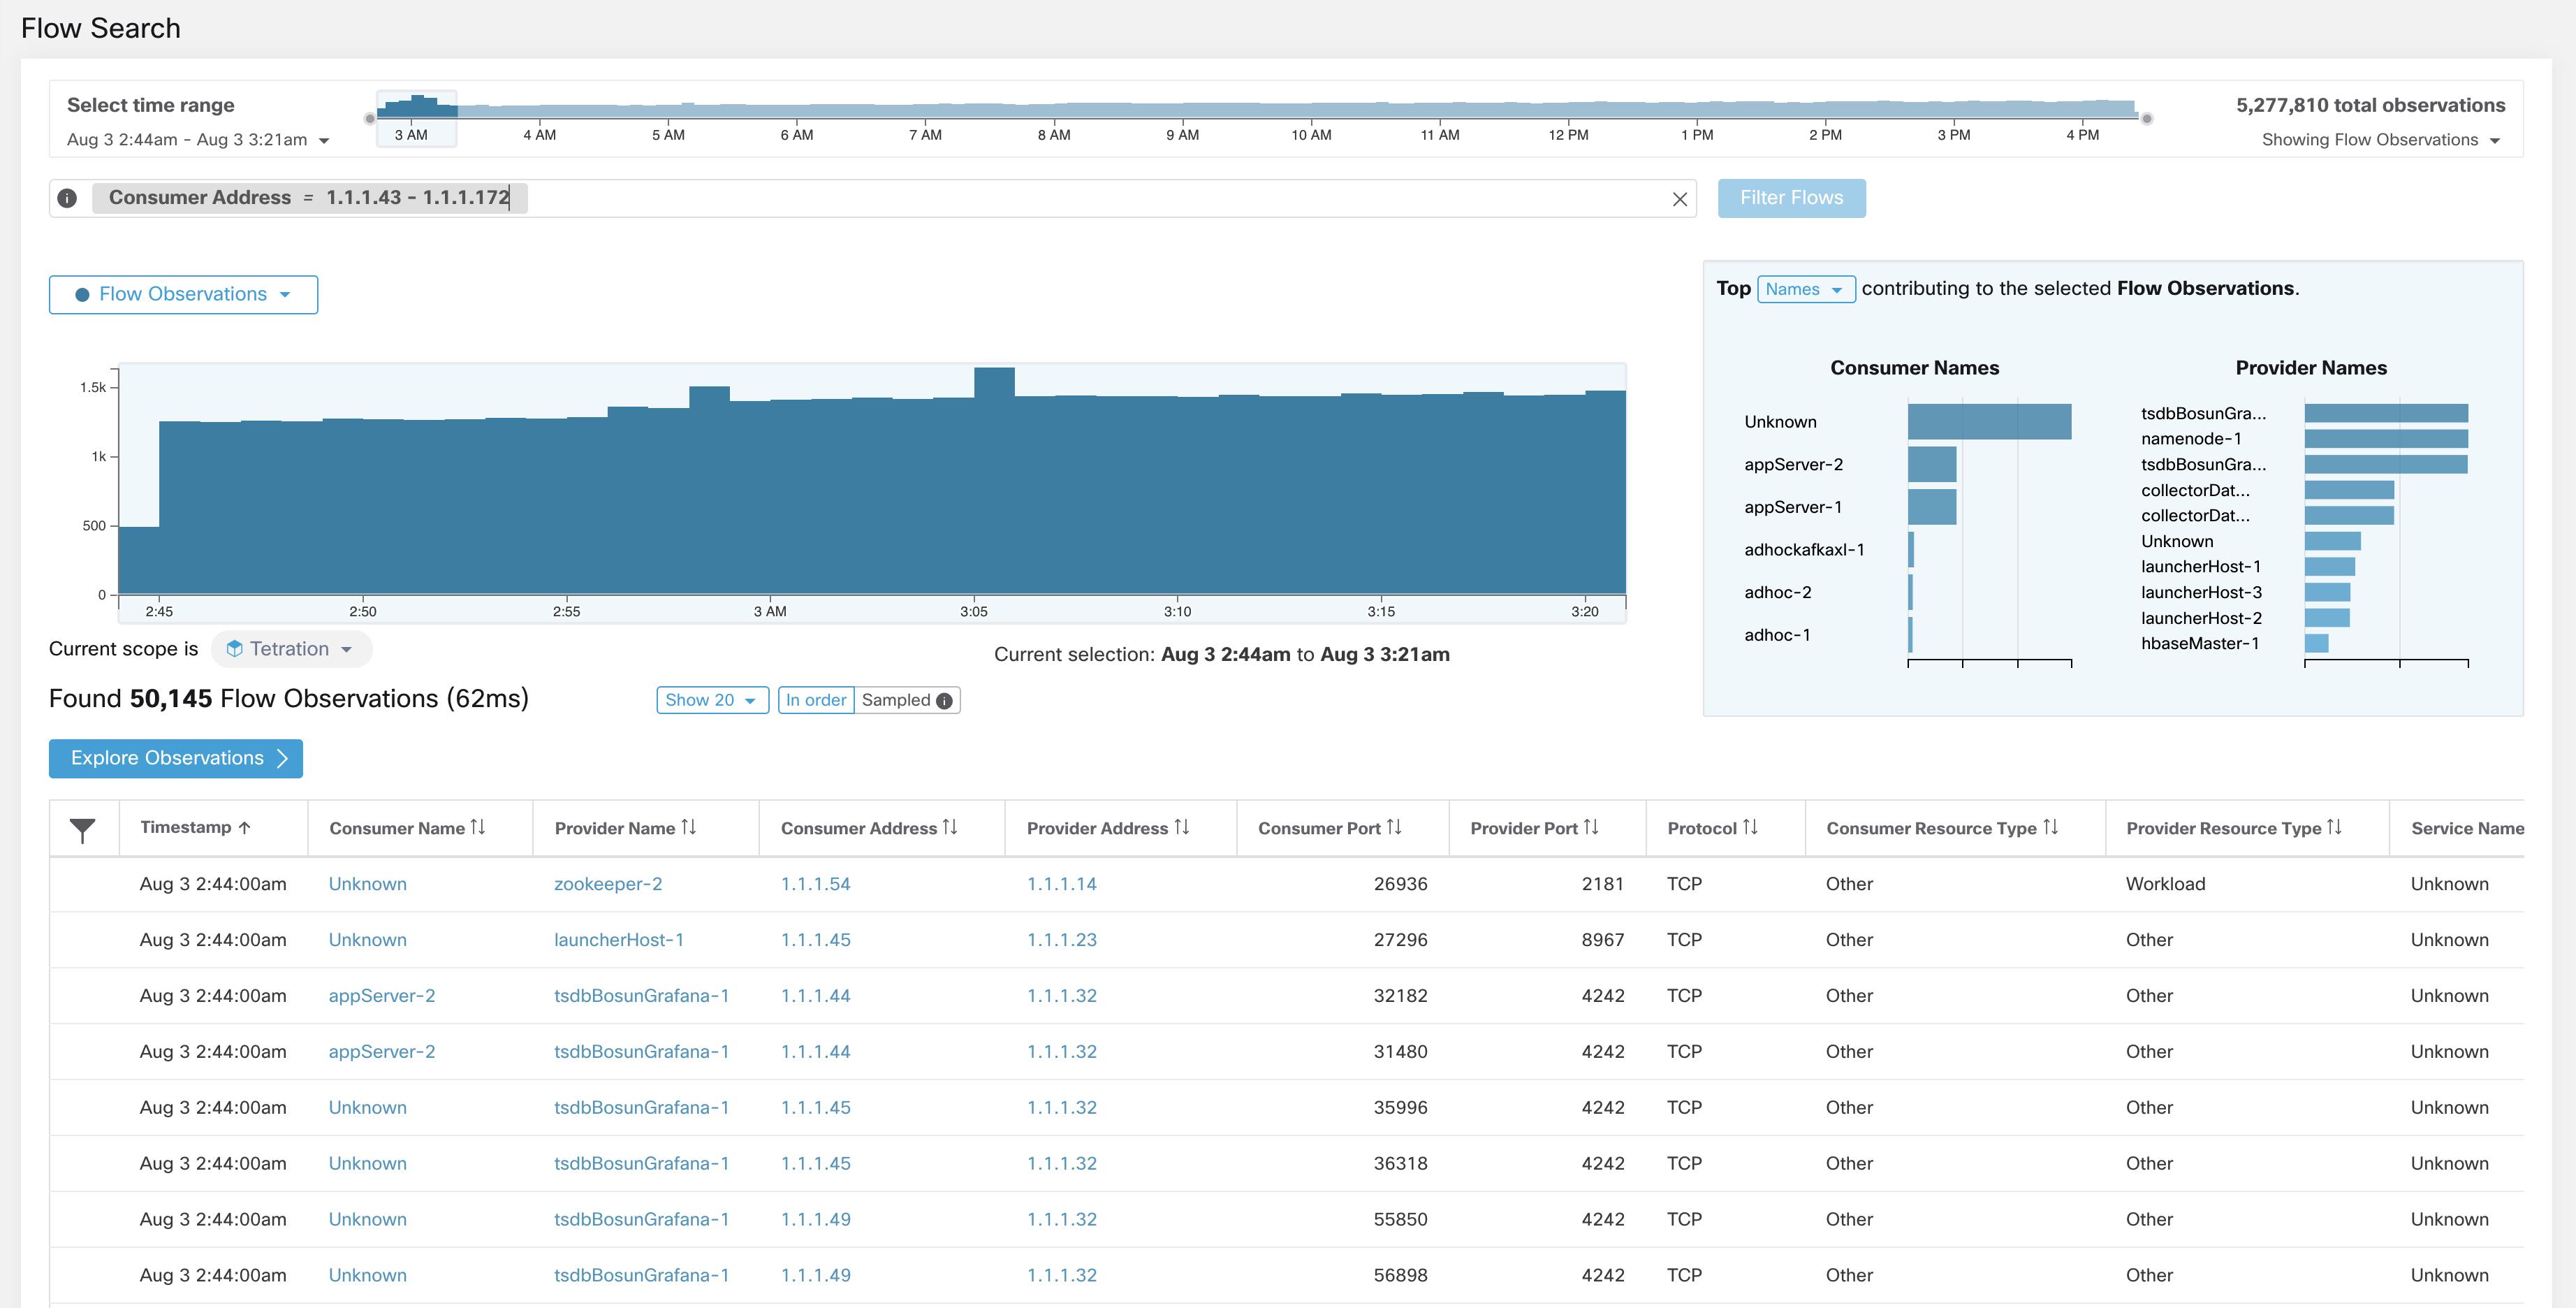
Consumer Address (src_address)
|
Enter a subnet or IP Address using CIDR notation (for example, 10.11.12.0/24). Matches flow observations whose consumer address
overlaps with the provided IP Address or subnet.
|
Software Agents and Ingest Appliances
|
|
Provider Address (dst_address)
|
Enter a subnet or IP Address using CIDR notation (for example, 10.11.12.0/24) Matches flow observations whose provider address
overlaps with the provided IP address or subnet.
|
Software Agents and Ingest Appliances
|
|
Consumer Domain Name
|
Matches flow observations whose consumer domain name (associated with the consumer IP address or subnet) overlaps with the
entered consumer domain name.
|
Software Agents and AnyConnect Connector
|
|
Provider Domain Name
|
Matches flow observations whose provider domain name (associated with the provider IP address/subnet) overlaps with the entered
provider domain name.
|
Software Agents and AnyConnect Connector
|
|
Consumer Hostname (src_hostname)
|
Matches flows whose consumer hostname overlaps with the provided hostname.
|
Software Agents and AnyConnect Connector
|
|
Provider Hostname (dst_hostname)
|
Matches flows whose provider hostname overlaps with the provided hostname.
|
Software Agents and AnyConnect Connector
|
|
Consumer Enforcement Group
(src_enforcement_epg_name)
|
The Consumer Enforcement Group is the name of the filter (Scope, Inventory Filter or Cluster) in the enforced policies that
matches the consumer.
|
Internal
|
|
Provider Enforcement Group
(dst_enforcement_epg_name)
|
The Provider Enforcement Group is the name of the filter (Scope, Inventory Filter or Cluster) in the enforced policies that
matches the provider.
|
Internal
|
|
Consumer Analysis Group
|
The Consumer Analysis Group is the name of the filter (Scope, Inventory Filter, or Cluster) in the analyzed policies that
matches the consumer.
|
Internal
|
|
Provider Analysis Group
|
The Provider Analysis Group is the name of the filter (Scope, Inventory Filter or Cluster) in the analyzed policies that matches
the provider.
|
Internal
|
|
Consumer Scope (src_scope_name)
|
Matches flows whose consumer belongs to the specified Scope.
|
Internal
|
|
Provider Scope (dst_scope_name)
|
Matches flows whose provider belongs to the specified Scope.
|
Internal
|
|
Consumer Port (src_port)
|
Matches flows whose Consumer port overlaps with the provided port.
|
Software Agents, ERSPAN, and NetFlow
|
|
Provider Port (dst_port)
|
Matches flows whose Provider port overlaps with the provided port.
|
Software Agents, ERSPAN, and NetFlow
|
|
Consumer Country (src_country)
|
Matches flows whose Consumer country overlaps with the provided country.
|
Internal
|
|
Provider Country (dst_country)
|
Matches flows whose Provider country overlaps with the provided country.
|
Internal
|
|
Consumer Subdivision (src_subdivision)
|
Matches flows whose Consumer subdivision overlaps with the provided subdivision (state).
|
Internal
|
|
Provider Subdivision (dst_subdivision)
|
Matches flows whose Provider subdivision overlaps with the provided subdivision (state).
|
Internal
|
|
Consumer Autonomous System Organization
(src_ autonomous_system_organization)
|
Matches flows whose Consumer autonomous system organization overlaps with provided autonomous system organization (ASO).
|
Internal
|
|
Provider Autonomous System Organization (dst_autonomous_system_organization)
|
Matches flows whose Provider autonomous system organization overlaps with provided autonomous system organization (ASO).
|
Internal
|
|
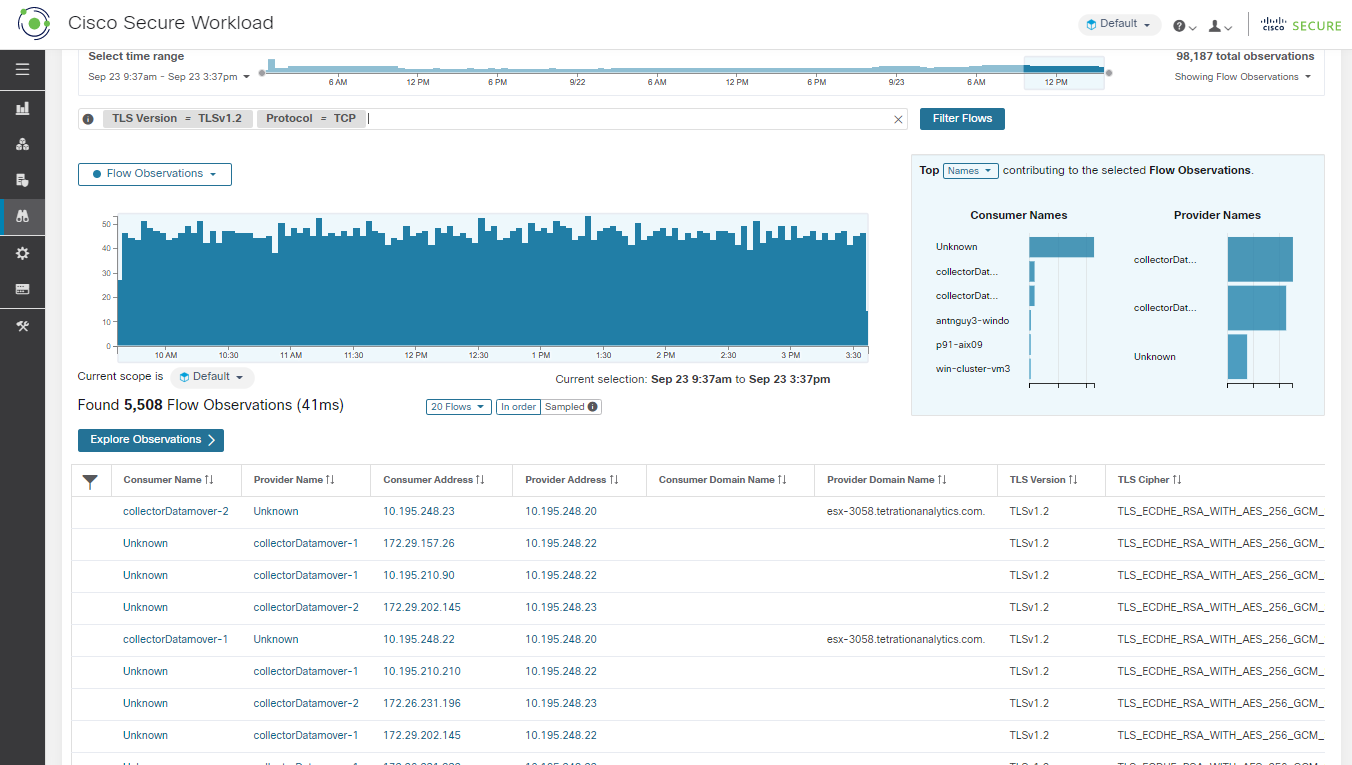
Protocol (proto)
|
Filter flow observations by Protocol type (TCP, UDP, ICMP).
|
Software Agents and Ingest Appliances
|
|
Address Type (key_type)
|
Filter flow observations by Address type (IPv4, IPv6, DHCPv4).
|
Software Agents and Ingest Appliances
|
|
Fwd TCP Flags
|
Filter flow observations by flags (SYN, ACK, ECHO).
|
Software Agents, ERSPAN, and NetFlow
|
|
Rev TCP Flags
|
Filter flow observations by flags (SYN, ACK, ECHO).
|
Software Agents, ERSPAN, and NetFlow
|
|
Fwd Process UID (fwd_process_owner)
|
Filter flow observations by process owner UID (root, admin, yarn, mapred).
|
Software Agents
|
|
Rev Process UID (rev_process_owner)
|
Filter flow observations by process owner UID (root, admin, yarn, mapred).
|
Software Agents
|
|
Fwd Process (fwd_process_string)
|
Filter flow observations by process (java, hadoop, nginx). See Process String Visibility Warning
|
Software Agents
|
|
Rev Process (rev_process_string)
|
Filter flow observations by process (java, hadoop, nginx). See Process String Visibility Warning
|
Software Agents
|
|
Consumer In Collection Rules?
|
Match only internal Consumers.
|
Internal
|
|
Provider In Collection Rules?
|
Match only internal Providers.
|
Internal
|
|
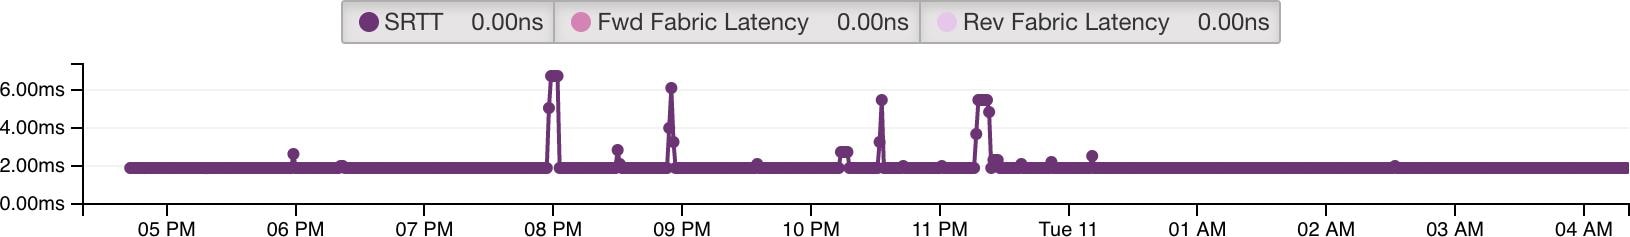
SRTT Available
|
Matches flows which have SRTT measurements available using the values ‘true’ or ‘false’. (This is equivalent to SRTT > 0).
|
Internal
|
|
Bytes
|
Filter flow observations by Byte traffic bucket. Matches flows whichByte traffic bucket values are =, <, > (bucketed by powers
of 2 (0, 2, 64, 1024)).
|
Software Agent and Ingest Appliances
|
|
Packets
|
Filter flow observations by Packet traffic bucket. Matches flows which Packet traffic bucket values are =, <, > (bucketed
by powers of 2 (0, 2, 64, 1024)).
|
Software Agent and Ingest Appliances
|
|
Flow Duration (µs)
|
Filter flow observations by Flow Duration bucket. Matches flows which Flow Duration bucket values are =, <, > (bucketed by
powers of 2 (0, 2, 64, 1024).
|
Internal
|
|
Data Duration (µs)
|
Filter flow observations by Data Duration bucket. Matches flows which Data Duration bucket values are =, <, > (bucketed by
powers of 2 (0, 2, 64, 1024).
|
Internal
|
|
SRTT (µs) (srtt_dim_usec)
|
Filter flow observations by SRTT bucket. Matches flows which SRTT bucket values are =, <, > (bucketed by powers of 2 (0, 2,
64, 1024)).
|
Software Agent
|
|
Fwd Packet Retransmissions
(fwd_tcp_pkts_retransmitted)
|
Filter flow observations by Packet Retransmissions bucket. Matches flows which Packet Retransmissions bucket values are =,
<, > (bucketed by powers of 2 (0, 2, 64, 1024)).
|
Software Agent
|
|
Rev Packet Retransmissions
(rev_tcp_pkts_retransmitted)
|
Filter flow observations by Packet Retransmissions bucket. Matches flows which Packet Retransmissions bucket values are =,
<, > (bucketed by powers of 2 (0, 2, 64, 1024)).
|
Software Agent
|
|
User Labels (* or user_ prefix)
|
User-defined data that is associated to the manually uploaded custom labels that are prefixed with * in the UI and user_ in OpenAPI.
|
CMDB
|
|
TLS Version
|
SSL protocol version used in the flow.
|
Software Agent
|
|
TLS Cipher
|
Algorithm type used by the SSL protocol in the flow.
|
Software Agent
|
|
Consumer Agent Type
|
Specify the consumer agent type.
|
Internal
|
|
Provider Agent Type
|
Specify the provider agent type.
|
Internal
|
|
Consumer Resource Type
|
Represents the flow of resources from a source to a consumer. It can be either workload, pods, services, or others
|
Internal
|
|
Provider Resource Type
|
Represents the flow of resources from a provider to a consumer. . It can be either workload, pods, services, or others.
|
Internal
|


 Feedback