-
Cisco MDS 9000 Family Fabric Manager Configuration Guide, Release 2.x
-
New and Changed Information
-
Index
-
Preface
- Part 1 - Fabric Manager Applications
- Part 2 - Cisco MDS SAN-OS Installation and Configuration Files
-
Part 3 - Switch Configuration
-
Cisco Fabric Services
-
VSAN Configuration
-
Dynamic VSAN Configuration
-
Zone Configuration
-
Inter-VSAN Routing Configuration
-
PortChannel Configuration
-
Interface Configuration
-
FCIP Configuration
-
Configuring the SAN Extension Tuner
-
iSCSI configuration
-
FICON Configuration
-
Configuring Intelligent Storage Services
-
Additional Configuration
-
- Part 4 - Security Configuration
- Part 5 - Network and Performance Monitoring
- Part 6 - Troubleshooting
-
GUI/CLI Usage Chart
-
Interface Nonoperational Reason Codes
-
Managing Cisco FabricWare
-
 Feedback
Table Of Contents
Fabric Manager Web Services Overview
Installing Fabric Manager Web Services
Using Fabric Manager Web Services with SSL
Launching and Using Fabric Manager Web Services
Monitoring Fabrics from Fabric Manager Web Services
Recovering a Web Services Password
Creating Custom Report Templates
Viewing Existing Custom Reports
Fabric Manager Web Services
With Fabric Manager Web Services you can monitor Cisco MDS switch events, performance, and inventory from a remote location using a web browser. This chapter contains the following sections:
•
Fabric Manager Web Services Overview
•
•
Fabric Manager Web Services Overview
Using Fabric Manager Web Services, you can monitor MDS switch events, performance, and inventory, and perform minor administrative tasks.
Fabric Manager Web Services provides the following features:
•
•
Fabric Manager Web Services displays in a web browser as shown in Figure 5-1.
Figure 5-1 Fabric Manager Web Services.
This section contains the following features:
Filter Tree
Fabric Manager Web Services uses a filter navigation tree on the left pane to control the scope of the features in Fabric Manager Web Services. The filter tree expands or collapses based on clicking the + or - icons. Select the scope you want to access by expanding or collapsing the filter tree and then clicking on the file or folder that represents your desired scope. You can select All, or a specific SAN, fabric or VSAN from the filter tree in the left pane. The features accessible from the tabs are limited to the scope of what you select in the filter tree.
Events
The Events tab shows events and issues for the selected items, persistent across user sessions.
The Events tab contains the following subtabs:
•
•
•
Performance
The Performance tab shows an overview of the average throughput and link utilization of SAN components. You see pie charts for the throughput and utilization. You can click on a pie chart to view a table of the data. In these tables, clicking on a blue link will display a graph of that data, if applicable. The Filter drop-down menu at the top right of the screen allows you to filter the data based on various periods of time.
The Performance tab contains the following subtabs:
•
•
•
•
•
•
Note
Inventory
The Inventory tab shows an inventory of the selected SAN, fabric, or switch. You can export this information to an ASCII file in comma-separated value format, that can be read by applications such as Microsoft Excel. You can set the number of rows and columns per page.
The Inventory tab contains the following subtabs:
•
•
•
•
•
•
•
Custom
The Custom tab allows you to create customized reports based on the historical performance, events, and inventory information gathered by Fabric Manager Server. You can create aggregate reports with summary and detailed views. You can also view previously saved reports.
The Custom tab contains the following subtabs:
•
•
•
•
See the "Creating Custom Report Templates" section.
Admin
The Admin tab allows you to perform minor administrative and configuration tasks on the Fabric Manager Server sending data to your web client.
The Admin tab contains the following subtabs:
•
•
•
•
•
Note
Installing Fabric Manager Web Services
If you are installing the Fabric Manager Web Services software for the first time, or if you want to update or reinstall the software, you access the supervisor module of the switch using a web browser. Install Fabric Manager Web Services on the same workstation where you installed Fabric Manager Server.
You must install Fabric Manager Web Services to view Performance Manager reports through a web browser.
For switches running Cisco MDS 9000 FabricWare, you need to install the Fabric Manager Web Services software from the CD-ROM included with your switch, or download Fabric Manager from Cisco.com.
To install Fabric Manager Web Services from the CD-ROM, navigate to the Fabric Manager installation notes and follow the directions.
To download the software from from Cisco.com, go to the following website:
http://cisco.com/cgi-bin/tablebuild.pl/mds-fm
To download and install the software on your workstation, follow these steps:
Step 1
When you connect to the server for the first time, it checks to see if you have the correct Sun Java Virtual Machine version installed on your workstation. If you do not have the correct version installed, a link is provided to the appropriate web page on the Sun Microsystems website so you can install it.
a.
b.
Note
Step 2
Step 3
Note
Unless you specify a different directory on a Windows PC, the software is installed in the default location of C:\Program Files\Cisco Systems\MDS 9000. A Cisco MDS 9000 program group is created under
Start > Programs. This program group contains shortcuts to Fabric Manager and Device manager.On a UNIX (Solaris or Linux) machine, the installation path is /usr/local/cisco_mds9000. If this directory is not writable by the user, which is the case for non-root users, the default is set to $HOME/cisco_mds9000. Shell scripts are created in the bin directory.
Note
Using Fabric Manager Web Services with SSL
Fabric Manager Web Services uses TCP port 80 by default. If you want to install SSL certificates and use Fabric Manager Web Services over HTTPS (using TCP port 443 or another custom port), you need a certificate for each external IP address that accepts secure connections. You can purchase these certificates from a well-known Certificate Authority (CA).
To modify Fabric Manager Web Services to use SSL, follow these steps:
Step 1
Step 2
<Connector className="org.apache.catalina.connector.http.HttpConnector"port="80" minProcessors="5" maxProcessors="75"enableLookups="false" redirectPort="8443"acceptCount="10" debug="0" connectionTimeout="60000"/><!-- Define an SSL HTTP/1.1 Connector on port 8443 --><!--<Connector className="org.apache.catalina.connector.http.HttpConnector"port="8443" minProcessors="5" maxProcessors="75"enableLookups="true"acceptCount="10" debug="0" scheme="https" secure="true"><Factory className="org.apache.catalina.net.SSLServerSocketFactory"clientAuth="false" protocol="TLS"/></Connector>-->Step 3
<!--<Connector className="org.apache.catalina.connector.http.HttpConnector"port="80" minProcessors="5" maxProcessors="75"enableLookups="false" redirectPort="8443"acceptCount="10" debug="0" connectionTimeout="60000"/>--><!-- Define an SSL HTTP/1.1 Connector on port 8443 --><Connector className="org.apache.catalina.connector.http.HttpConnector"port="443" minProcessors="5" maxProcessors="75"enableLookups="true"acceptCount="10" debug="0" scheme="https" secure="true"><Factory className="org.apache.catalina.net.SSLServerSocketFactory"clientAuth="false" protocol="TLS"keystoreFile="C:\Program Files\Cisco Systems\MDS 9000\keystore"keystorePass="changeit"/></Connector>Step 4
Step 5
Launching and Using Fabric Manager Web Services
Before you can use Fabric Manager Web Services to monitor a switch, the service must be started on the server you are connecting through. The browser does not have to be on the same workstation where Fabric Manager Web Services is installed.
To launch Fabric Manager Web Services, follow these steps:
Step 1
If you are on a different workstation from where you installed Fabric Manager Web Services, then open your browser and in the location field enter http://<yourServerAddress>:PORT, where <yourServerAddress> is the address where you installed Fabric Manager Web Services, and PORT is 80 by default. Enter your port number if you specified a different port during installation.
Tip
On a UNIX workstation, use the following command:
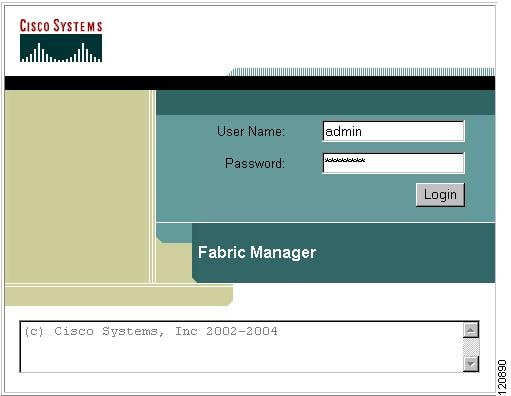
$ /usr/local/cisco_mds9000/bin/FMWebClient.sh statusYou see the login screen for Fabric Manager Web Services (see Figure 5-2). The text field at the bottom shows the Message of the Day from the server you log into.
Figure 5-2 Fabric Manager Web Services Login Screen
Step 2
Step 3
Note
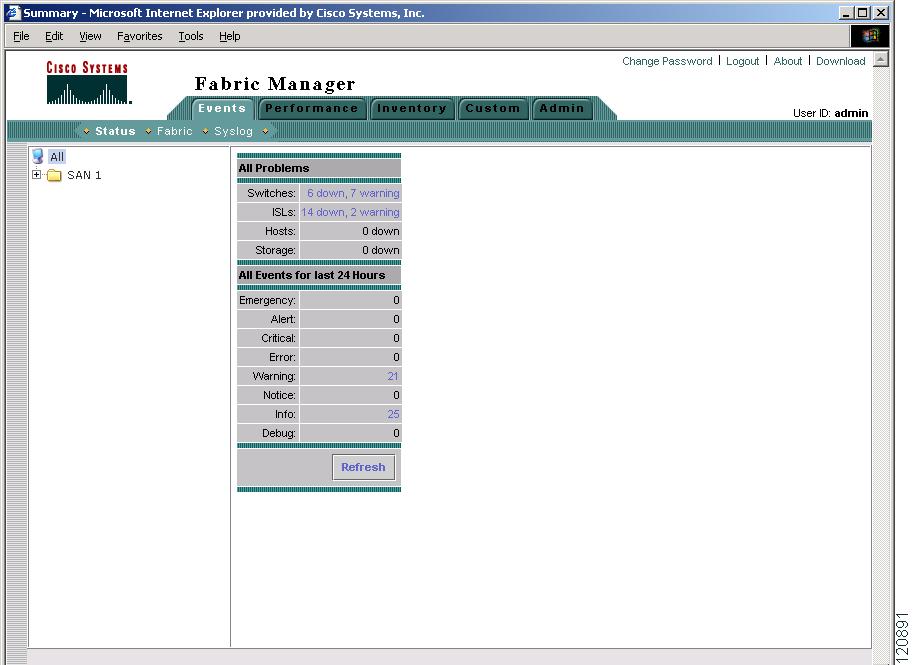
After launching Fabric Manager Web Services, you see the initial screen, which is the Events > Summary screen (see Figure 5-3). Fabric Manager Web Services polls the Fabric Manager Server database to display the managed devices in the left pane.
Figure 5-3 Events > Summary Screen
Monitoring Fabrics from Fabric Manager Web Services
Fabric Manager Web Services reports information gathered by Fabric Manager server on any fabrics known to Fabric Manager server.
To start or stop monitoring a fabric from Fabric Manager server using Fabric Manager Web Services, follow these steps:
Step 1
Step 2
Step 3
Step 4
Step 5
Setting Up a Guest User
You may want a separate guest user account to access the reports available in Fabric Manager Web Services. You can create a user named "guest" (case-insensitive) that can only view reports. The guest user cannot change the guest password, nor can the guest user access the Admin tab on Fabric Manager Web Services. You can set up a guest user either remotely in the AAA server, or locally using local authentication.
To create a guest user in the local database, follow these steps:
Step 1
Step 2
Step 3
Step 4
Step 5
Note
Step 6
Recovering a Web Services Password
Web Services user passwords are encrypted and stored locally on the workstation where you installed Web Services. If you forget a password, you can create a new network-admin user locally on the workstation where you installed Web Services and then log in and delete the old user account under the Admin tab.
To create a new user on the workstation where you installed Web Services and delete the old user, follow these steps:
Step 1
Step 2
webAddUser <userName> <password>Step 3
Step 4
Step 5
Step 6
Step 7
Creating Custom Report Templates
You can create custom reports from all or any subset of information gathered by Fabric Manager Server. You create a report template by selecting events, performance, and inventory statistics that you want in your report and set the the desired SAN, fabric or VSAN to limit the scope of the template. You can generate a report of your fabric based on this template immediately or at a later time. Fabric Manager Web Services saves each report based on the report template used and the time you generate the report. You can view the generated report by clicking Custom > View and navigating to the report template and report name.
To create a custom report template using Fabric Manager Web Services, follow these steps:
Step 1
Step 2
Step 3
Step 4
Step 5
Step 6
To edit a custom report template using Fabric Manager Web Services, follow these steps:
Step 1
Step 2
Step 3
Step 4
Step 5
Step 6
Generating Custom Reports
You can generate custom reports from any previously saved report template.
To create a custom report using Fabric Manager Web Services, follow these steps:
Step 1
Step 2
Step 3
Step 4
Step 5
Viewing Existing Custom Reports
Reports you generate are saved by Fabric Manager Server and viewable from the Custom > View tab.
To view a custom report using Fabric Manager Web Services, follow these steps:
Step 1
Step 2