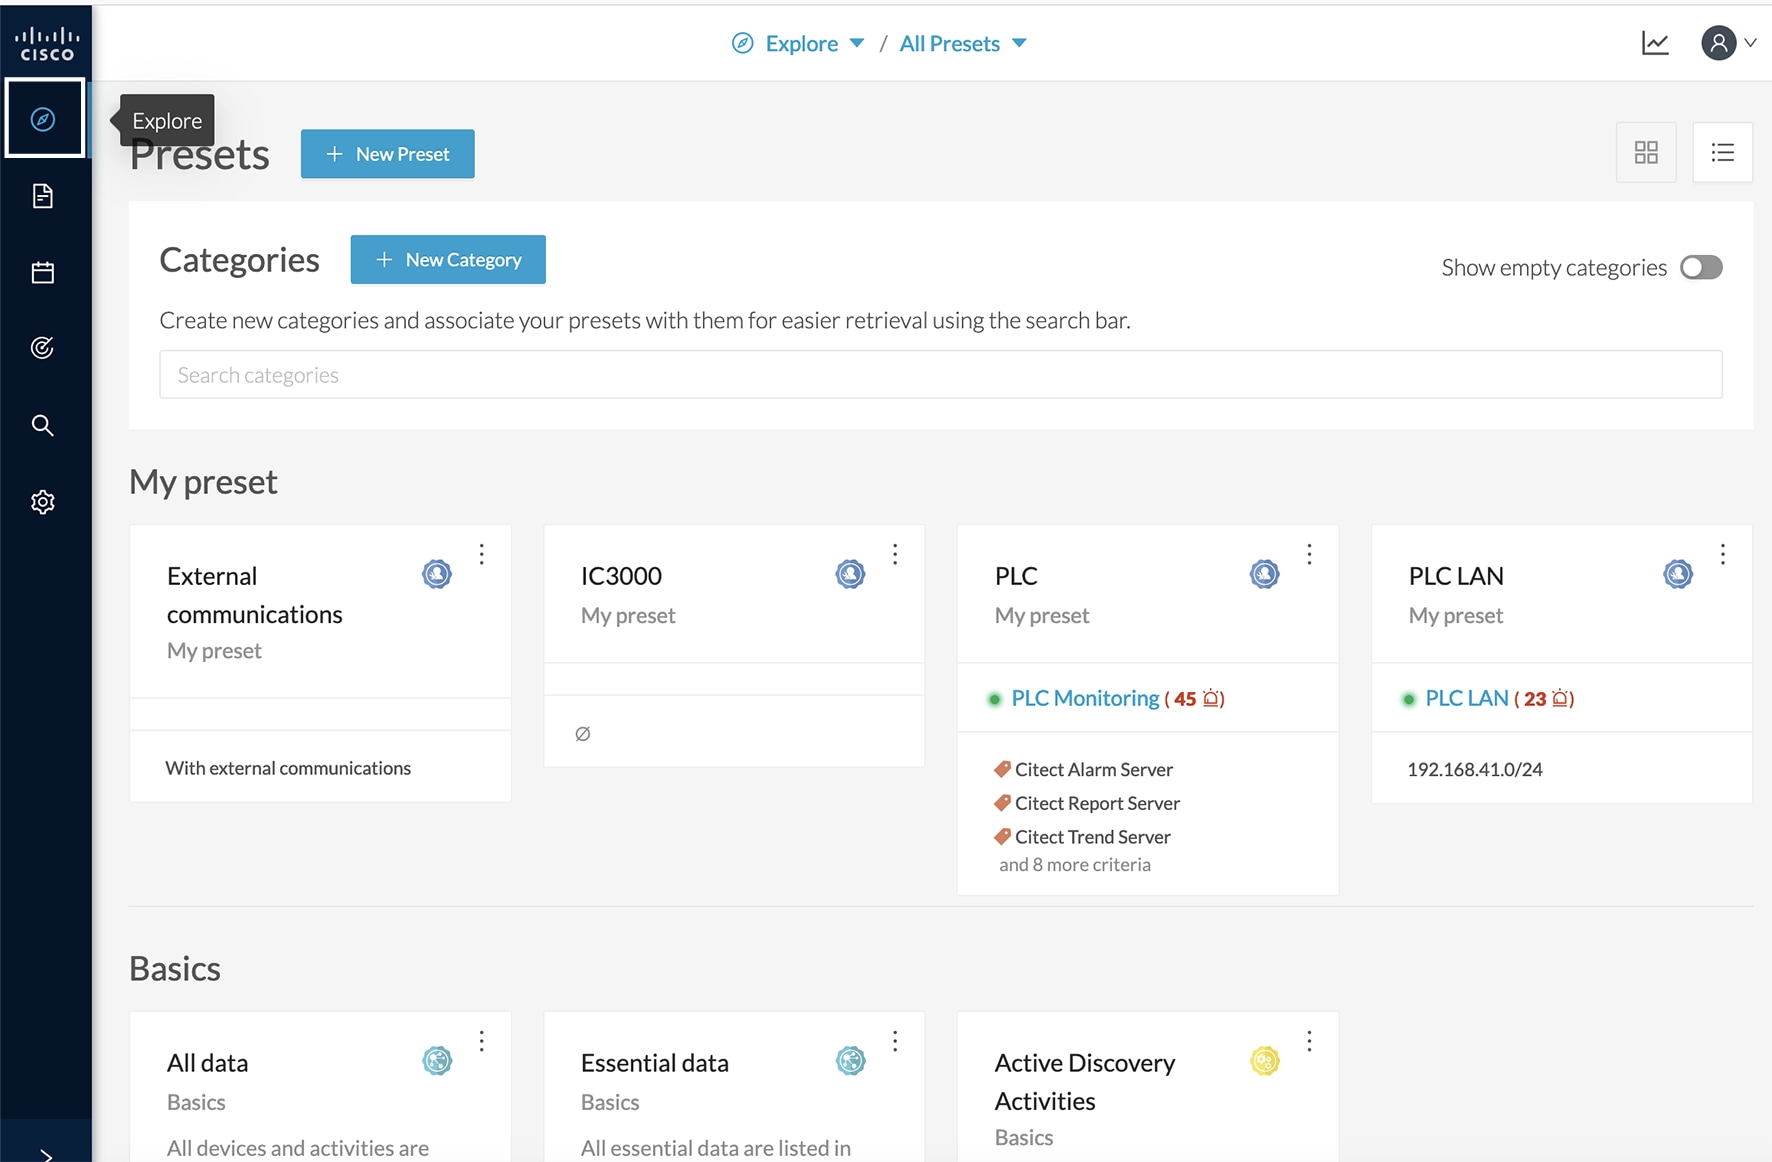
Preset views
There are several types of views which relate to different perspectives. Using the top navigation bar to access the views, click Explore > All Data. The Dashboard menu adds.
-
Dashboard view is the default which gives the preset data overview. It is a tag-oriented view showing general insight of the network, without going into deep and technical details.
-
Map is visual data of the industrial network that gives you a broad insight of how components are connected to each other.
-
Lists, Device list or Activity list, show classic but powerful data filtering to match what you are looking for. For more information, refer to the device and activity lists.
-
Purdue Model shows how the components of a preset are distributed among the layers of the Purdue model architecture.
Views are always structured as shown below:
-
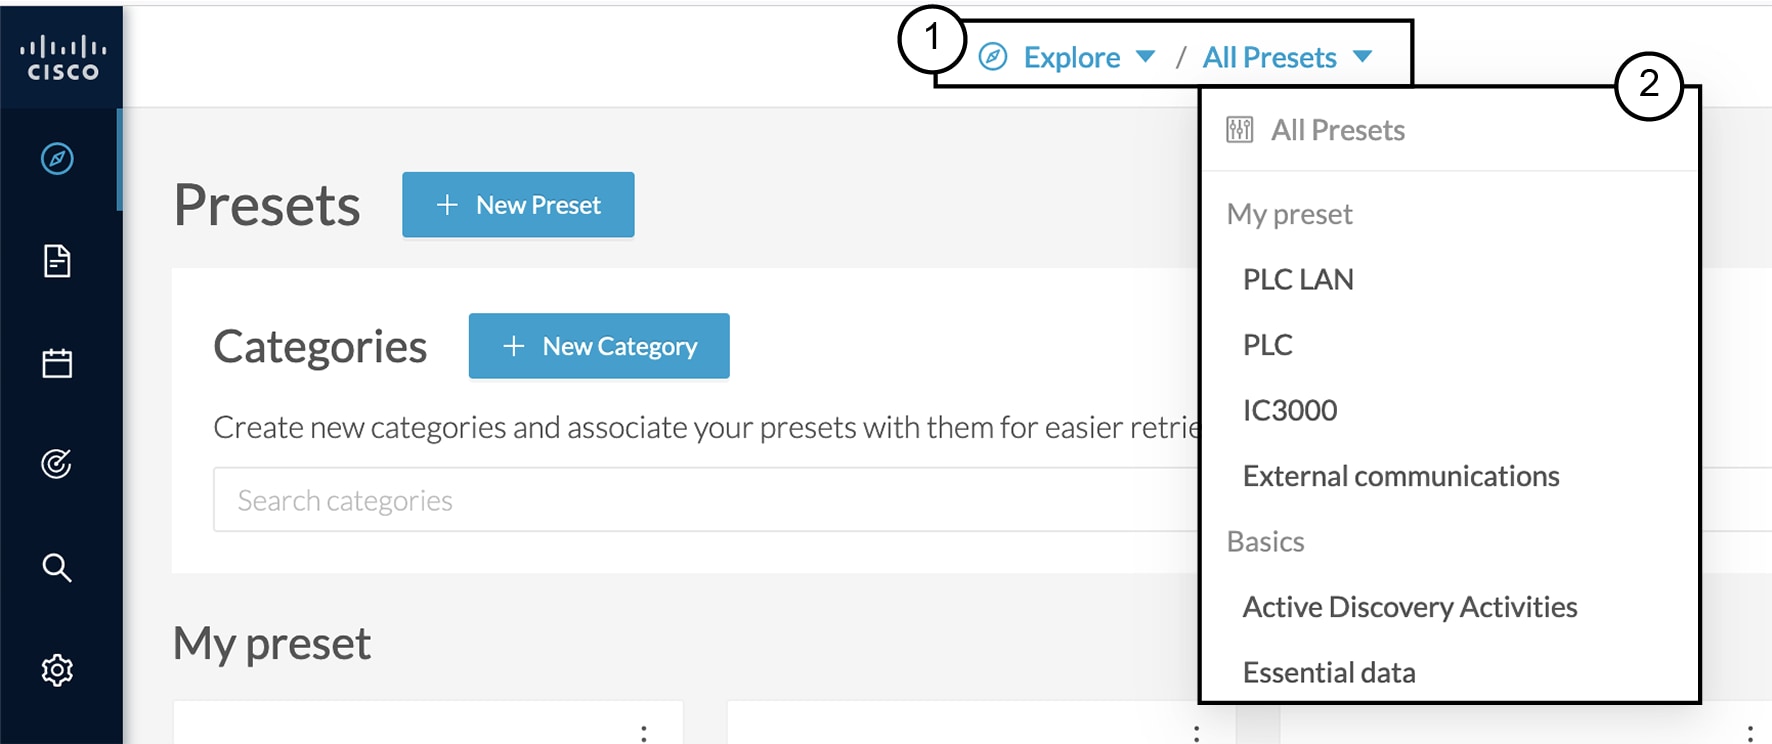
Use the top navigation bar (1) pull-down menus to easily switch between the different views.
-
Use the left panel (2) to filter, modify, and manage the preset data by adapting criteria and registering changes.
-
The center panel (3) dynamically changes as you save criteria.
Below is an example of the OT Devices preset on the Dashboard view.

The preset view is optimized to avoid lags, to solve performance issues, and to prevent the application from crashing, especially in case of large data flow. Since Cisco Cyber Vision version 4.0.0, data elements such as components, tags and activities are stored, instead of being directly displayed in the preset views. Preset views refresh occurs only when necessary or requested. This prevents overloading the application display. The elements visible in the preset views are actually data from the previous computation. This means that data displayed in the GUI and data stored in the database are asynchronous, which lightens data load on preset views.
In addition, data computation adapts to the frequency of the preset consultations. That is, a preset often viewed by users computes accordingly. Conversely, the system does not compute presets that are never used.
When on a preset, data is regularly computed by an automatized data computation running in the background. However, this does not refresh the preset view. Two buttons are available in the preset view to act independently whether on the database or on the preset view to lighten the load on the system:
-
The New data button (4) appears each time a new computation is done. Click it to update the view. The new view may not show new data.
-
The Refresh button (5) forces data computation and refreshes the preset view. This task requires more resources. Use Refresh for the following cases:
-
If you suspect that new data was found during the most recent computation (e.g., a new device plugged into the network).
-
If custom data such as groups or names has been changed (e.g., if adding a device into a group).
-

In many cases, computation is forced and the view refreshes as you navigate in the application. For example, refresh happens when you access another preset or move from one view to another.
 Note |
New preset view optimization also has an impact on how criteria are handled in preset views. Save new data in a new or custom preset. |
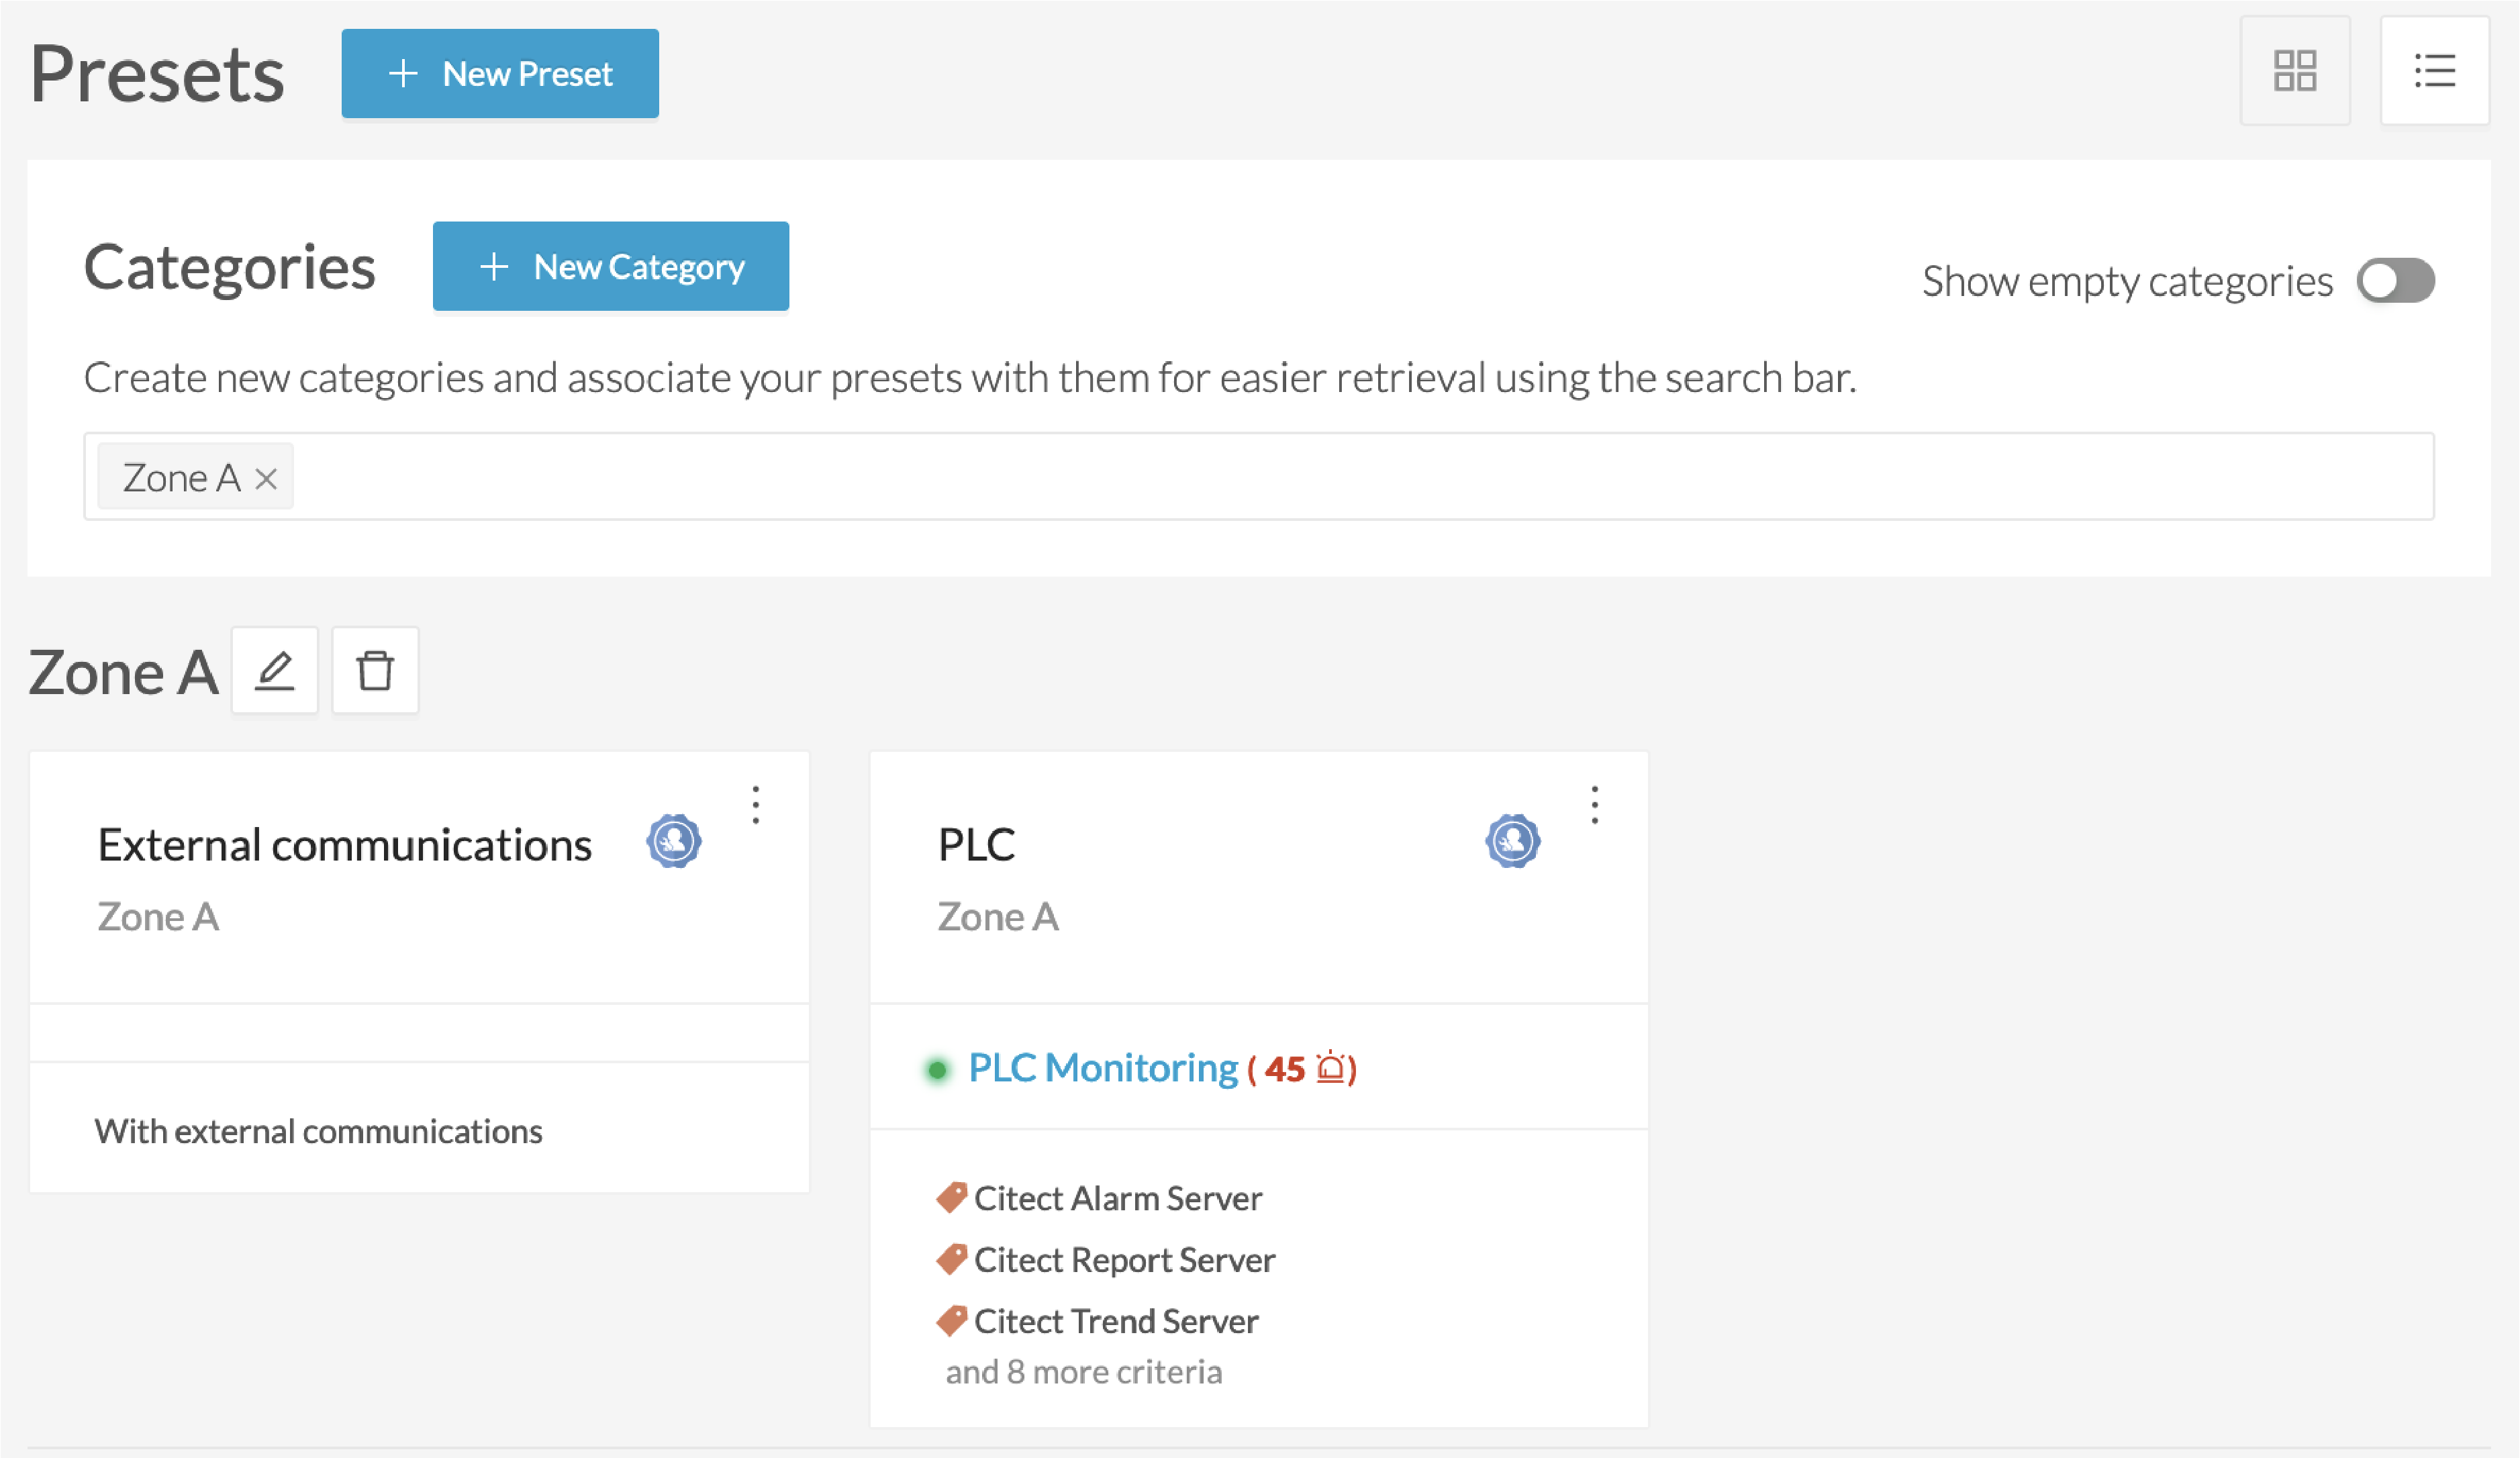
Dashboard
Dashboard is the preset default view. Dashboard shows an overview of the preset's global risk score, the number of devices, activities, vulnerabilities, events, variables and credentials.
Dashboard also shows Tags. The Tag pane shows all tags found, including tags set as criteria and shows the number of devices and activities found per tag.

For example:
-
Click Explore > All Data > Dashboard from the top navigator menu.
-
Click Device Tags from the left panel.
-
Select the Controller tag as criteria (under Device - Level 2), and save the selection as "Example: Controller tag."
Devices per tag: The number in brackets indicates there are 7 devices tagged as Controller (1). On the Dashboard, you see this result (2). One device is tagged as Web Server (3). This means that one of the Controllers is a Web Server. Following this logic, we can say that five of the Controllers are Rockwell Automation devices. That leaves one remaining as "unknown."

For more details on these devices, switch to the device list view and access them using the filter available in the Tags column.
Activities per tag: As for activities, there is no activity tags set as criteria in the example below (4). Yet, you can see that many activities have been found (5). This is because the dashboard view collects all activities involved with the Controller devices found.

For details on these activities, switch to the activity list view and access them using the filter available in the Tags column.
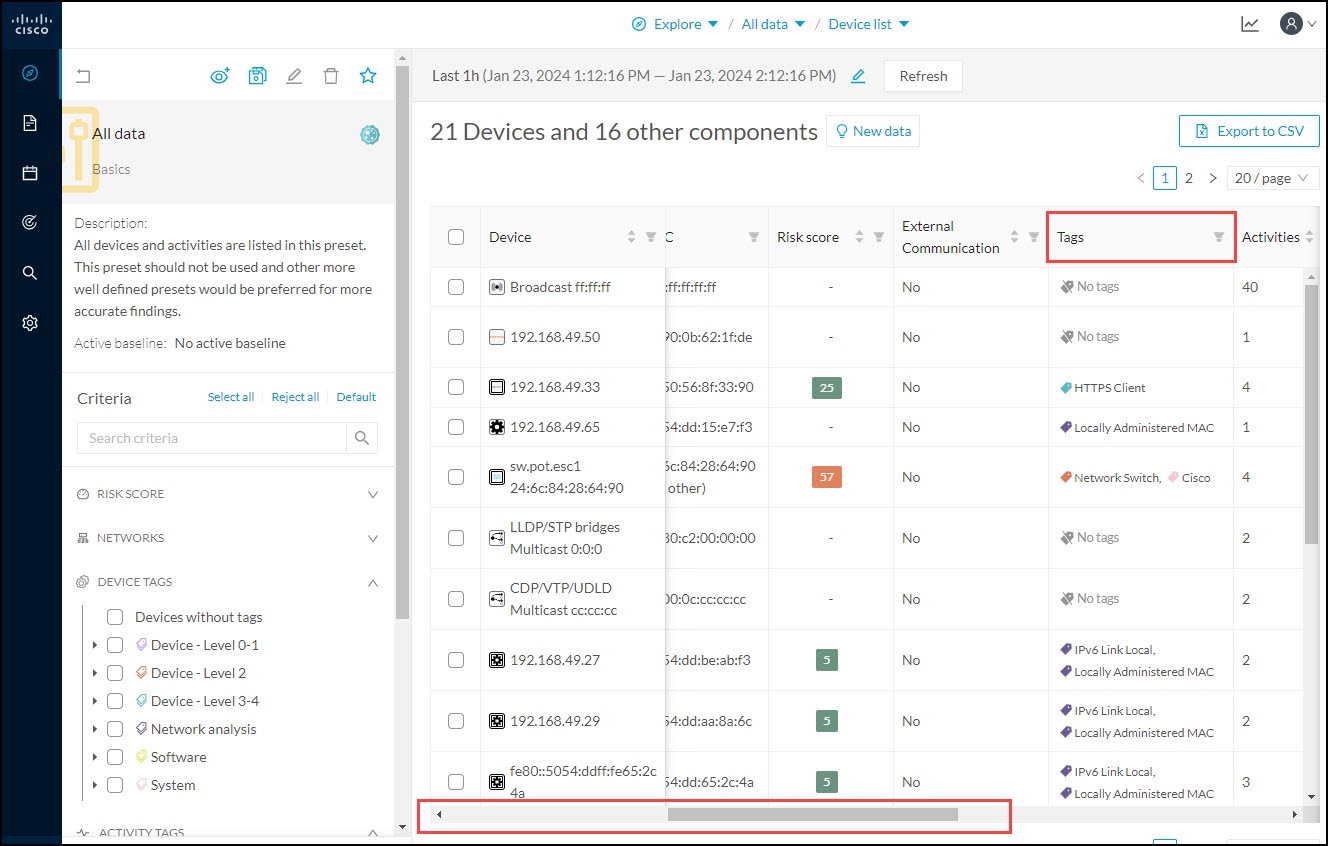
Device and activity lists
The Device list and Activity list are two specialized views. These views provide general information and advanced technical data about each element in the preset.
Below is an example of the Controllers preset in the Device list view.

Below is an example of the Controllers preset in the Activity list view.

Lists can provide an in-depth exploration of the network. Use the Search function to find very specific data. Use the Filter icons in the list columns to sort data.
-
The Sort arrows (1) list data by alphabetical order or by ascending/descending order. Click again to cancel the Sort.
-
The Filter icon (2) opens a field to type specific data in or a multiple-choice menu (3) to filter Tags.

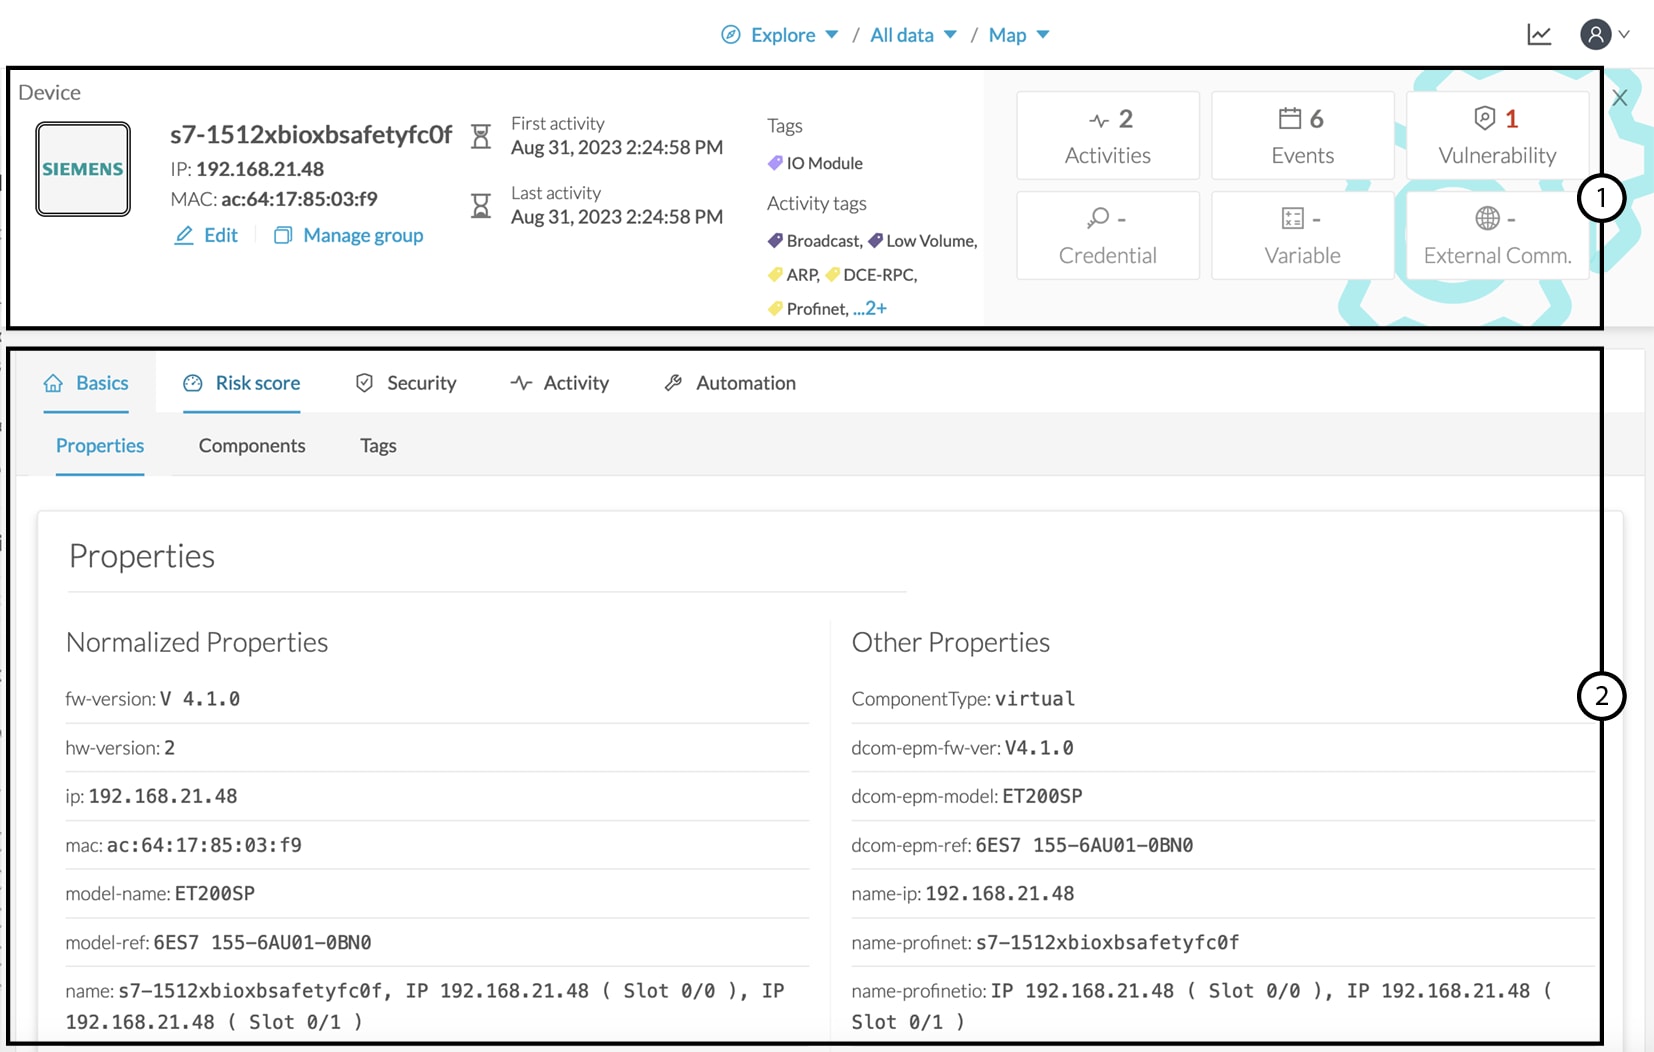
Clicking an element in the lists opens its detail panel which displays more data.
Map
The Map view is a visual representation of data of the industrial network that gives you the broadstrokes on how devices and components are interconnected. It shows how the network is structured. Map helps you organize components in a way that makes sense to you by creating groups.
Maps displays devices, components, and activities according to criteria set in a preset. Grayed out devices and components are displayed because, even if they don't correspond to the preset's criteria, they are necessary to represent the activities of the preset.

Note |
The Map view is self-organizing, that is, elements are redistributed as devices, components, conduits and activities appear or disappear, and as groups are created or deleted. The Map automatically adapts over time and when you change a preset. This guarantees that the Map is always well organized and components never overlap. |
By default, activities between groups are merged and displayed as conduits (A). Select Show network activities for a more detailed view (B). To enhance visibility, elements here are also automatically reorganized on the Map .

Vulnerabilities
Click Explore > All Data > Vulnerabilities to see a visual representation and a list of the vulnerabilities detected within a preset.
Important |
If you receive a notification about a new version, update the Knowledge DB in Cisco Cyber Vision as soon as possible. This protects your network against vulnerabilities. Refer to the corresponding documentation. |

The pie chart shows the 10 most-matched vulnerabilities within the preset and the affected devices (1). The legend below gives you the color code of severity (2). The center panel shows a list of the ten most vulnerabilities (3). Click the hyperlink for an affected device to see the details panel. The right panel shows the total number of devices that are vulnerable in the preset selected (4).
Below is a list of all the vulnerabilities found in the preset. It has Sort icons to sort data by alphabetical order or by ascending/descending order, and Filter icons, which open a field to type specific data.
For each vulnerability, the following data is displayed in columns:
-
Vulnerability title
-
CVE ID (unique identifier for a Common Vulnerability Exposure)
-
CVSS score (Common Vulnerability Scoring System)
-
Affected devices (by the vulnerability)

Click an element in the list to open the detail panel, which includes a link to the National Vulnerability Database.

You can Export to CSV using the corresponding button on top of the vulnerability list. A report will be generated for the time period defined.

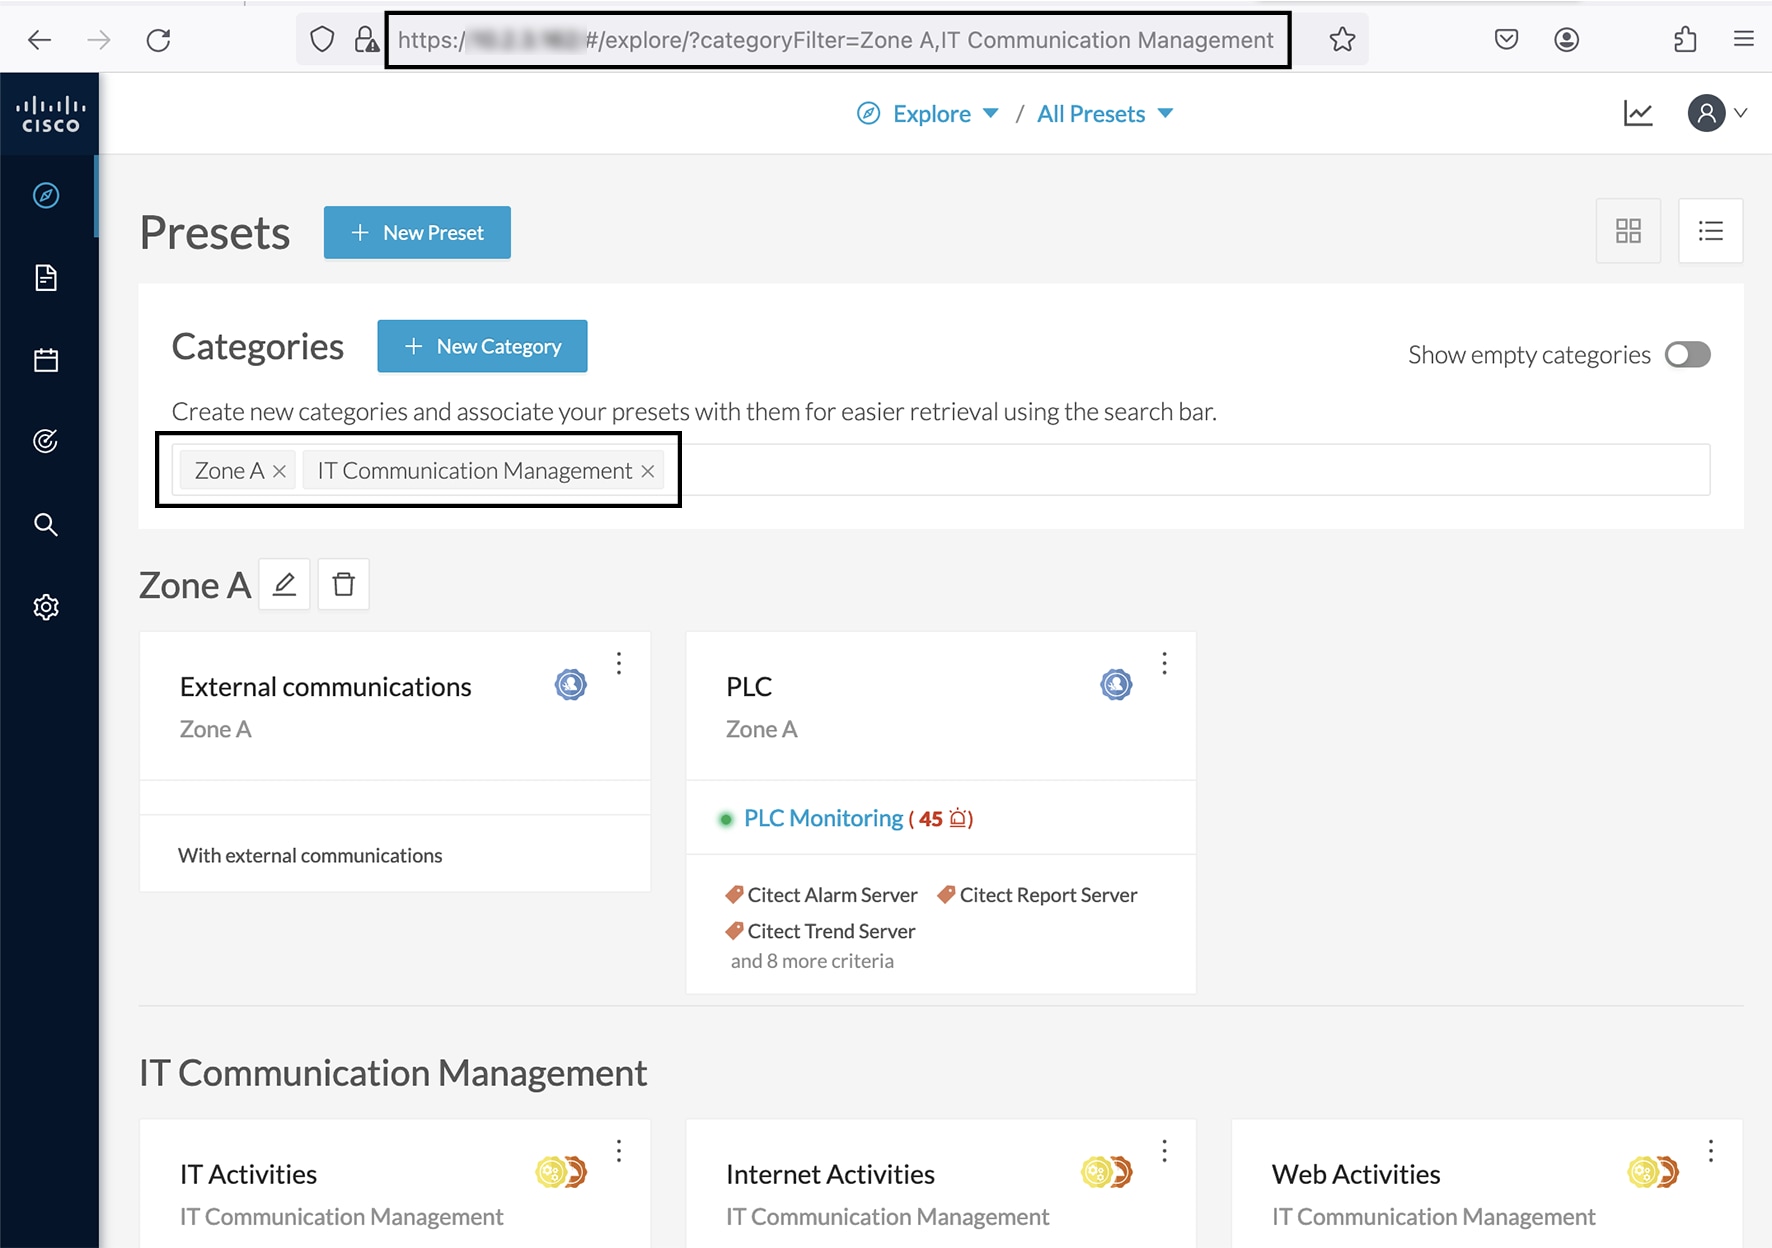
Security Insights
To access Security Insights, click Explore > All data > Dashboard > Security Insights. Security Insights provides statistics for DNS requests, HTTP requests, SMB Tree names and Flows with no tag.

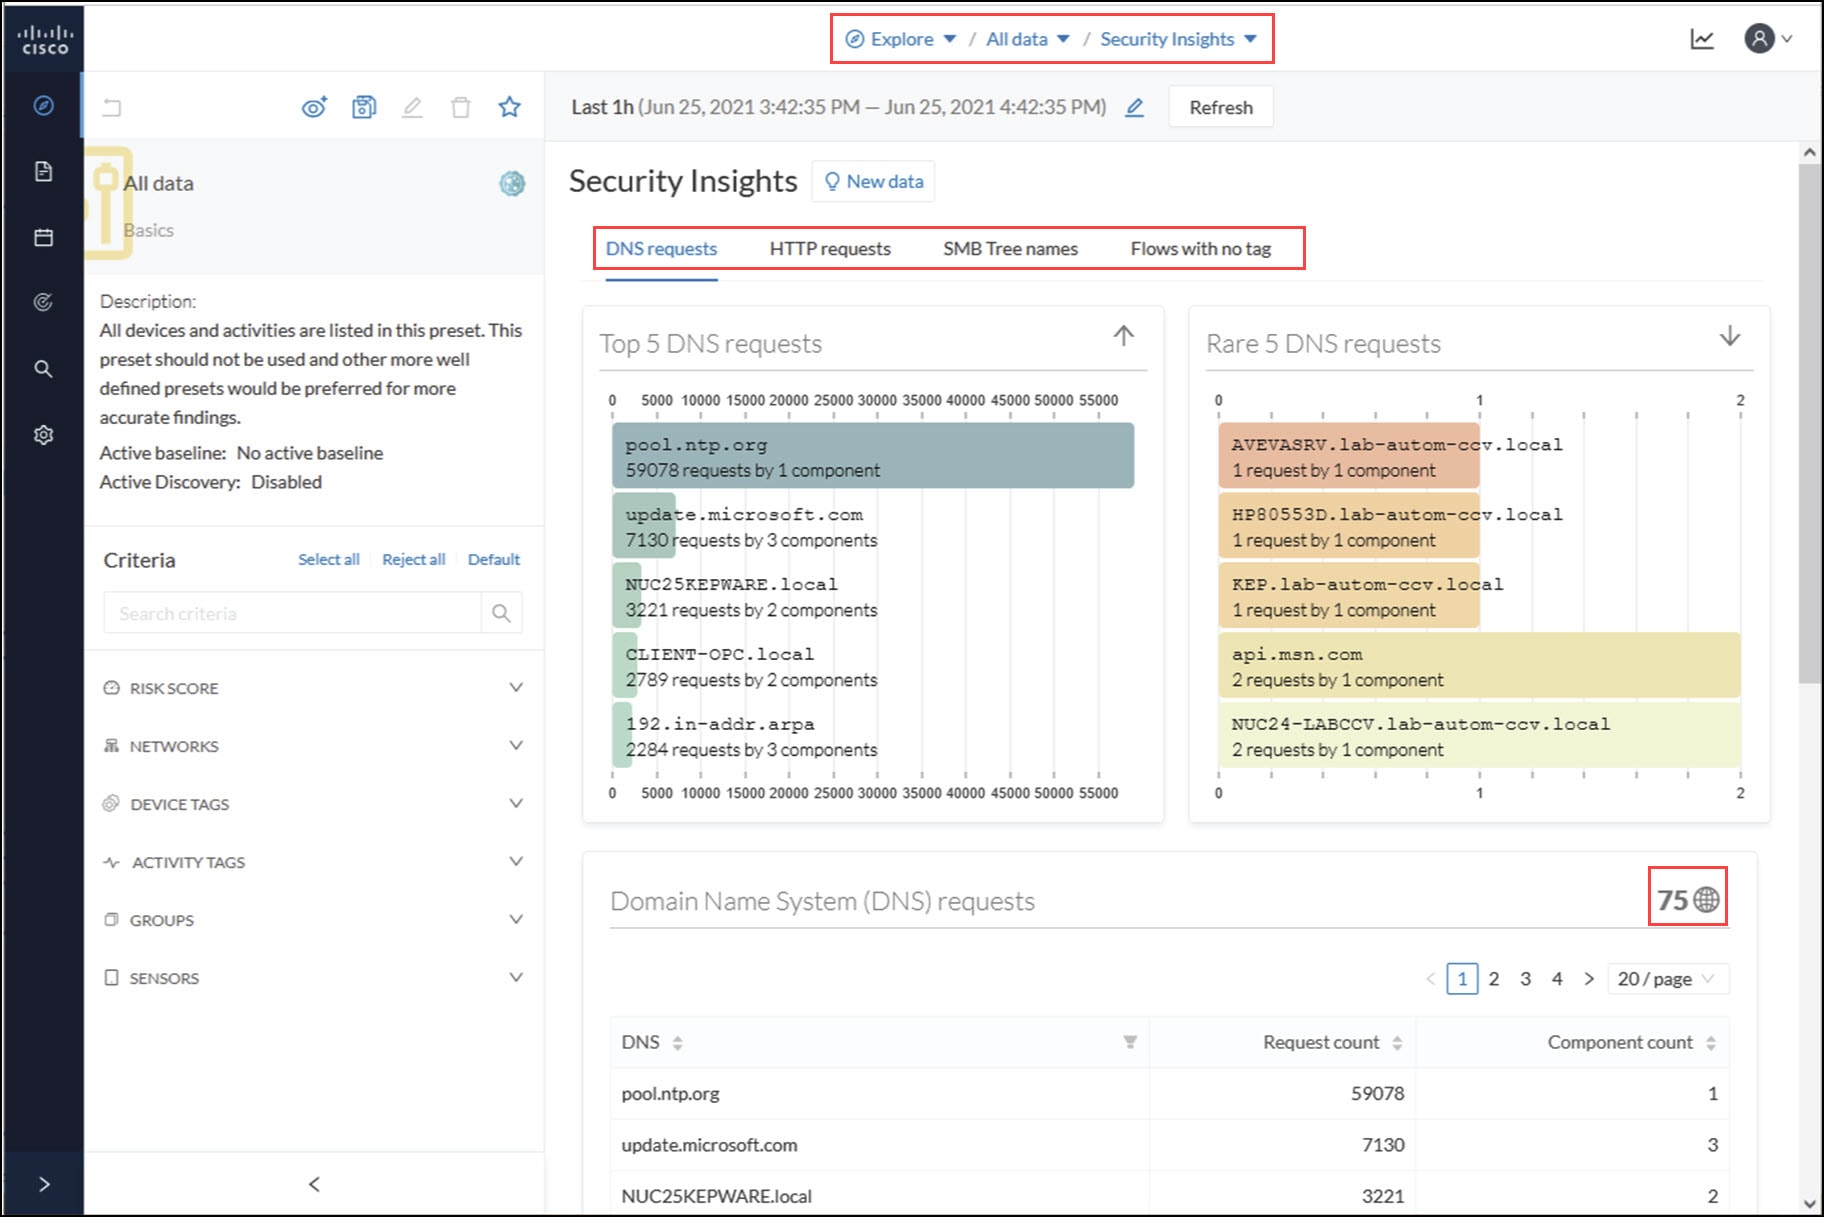
Each tab shows the top (most frequent), rarest requests, and lists all the requests. In the bottom panel, you can change the number of requests that show per page. You can see how many pages and the current page displaying. The total appears in the top right (75 in this example).
Flows with no tag

This information shows a list of all traffic that Cisco Cyber Vision was not able to analyze. There are various reasons for this, such as the protocol is not supported yet.
Next steps:
-
Make sure the content is supposed to be on the network.
-
Troubleshoot why it cannot be inspected.
-
Check flows with higher number of packets.
Purdue Model
This map displays the assets of a preset according to the Purdue Model architecture. Components are distributed among the layers by considering their tags. The Purdue Model view doesn't undergo any aggregation and is self-organizing. To access Purdue Model, click Explore > All data > Dashboard > Purdue Model.
Assets of the preset All Controllers distributed among the layers of the Purdue model

Components are distributed according to the following different layers of the Purdue model:
-
Level 0-1: Process and basic control (IO Modules).
-
Level 2: Area supervisory control (PLCs, SCADA stations).
-
Level 3-4: Manufacturing zone and DMZ (all others).


 Feedback