Events

Cisco Cyber Vision provides many events significant to network security, especially the events which relate to the industrial activity (such as New program downloaded/uploaded, New start/stop CPU command, New init command, etc.). Many other events related to vulnerabilities, comparison results, sensors activity, etc. are also available.

Go to Admin > Events to see all available Events. See the Cisco Cyber Vision Administration Guide.

The Events interface provides high visibility on events with the following two views:

  • Dashboard: Shows a visual and continuously-updated view of the current state of the installation, based on the number of events (by severity and over time).

  • Calendar: Shows a chronological and continuously-updated view of the events within which you can search events.

The Dashboard

The Dashboard shows Event doughnut and line charts. Doughnut charts show color-coded, event severity categories and percentages. You can filter the Events on Day, Week, Month or Year. Use the arrows for exact dates.

Doughnut charts present events numbers and percentages per categories and severities.

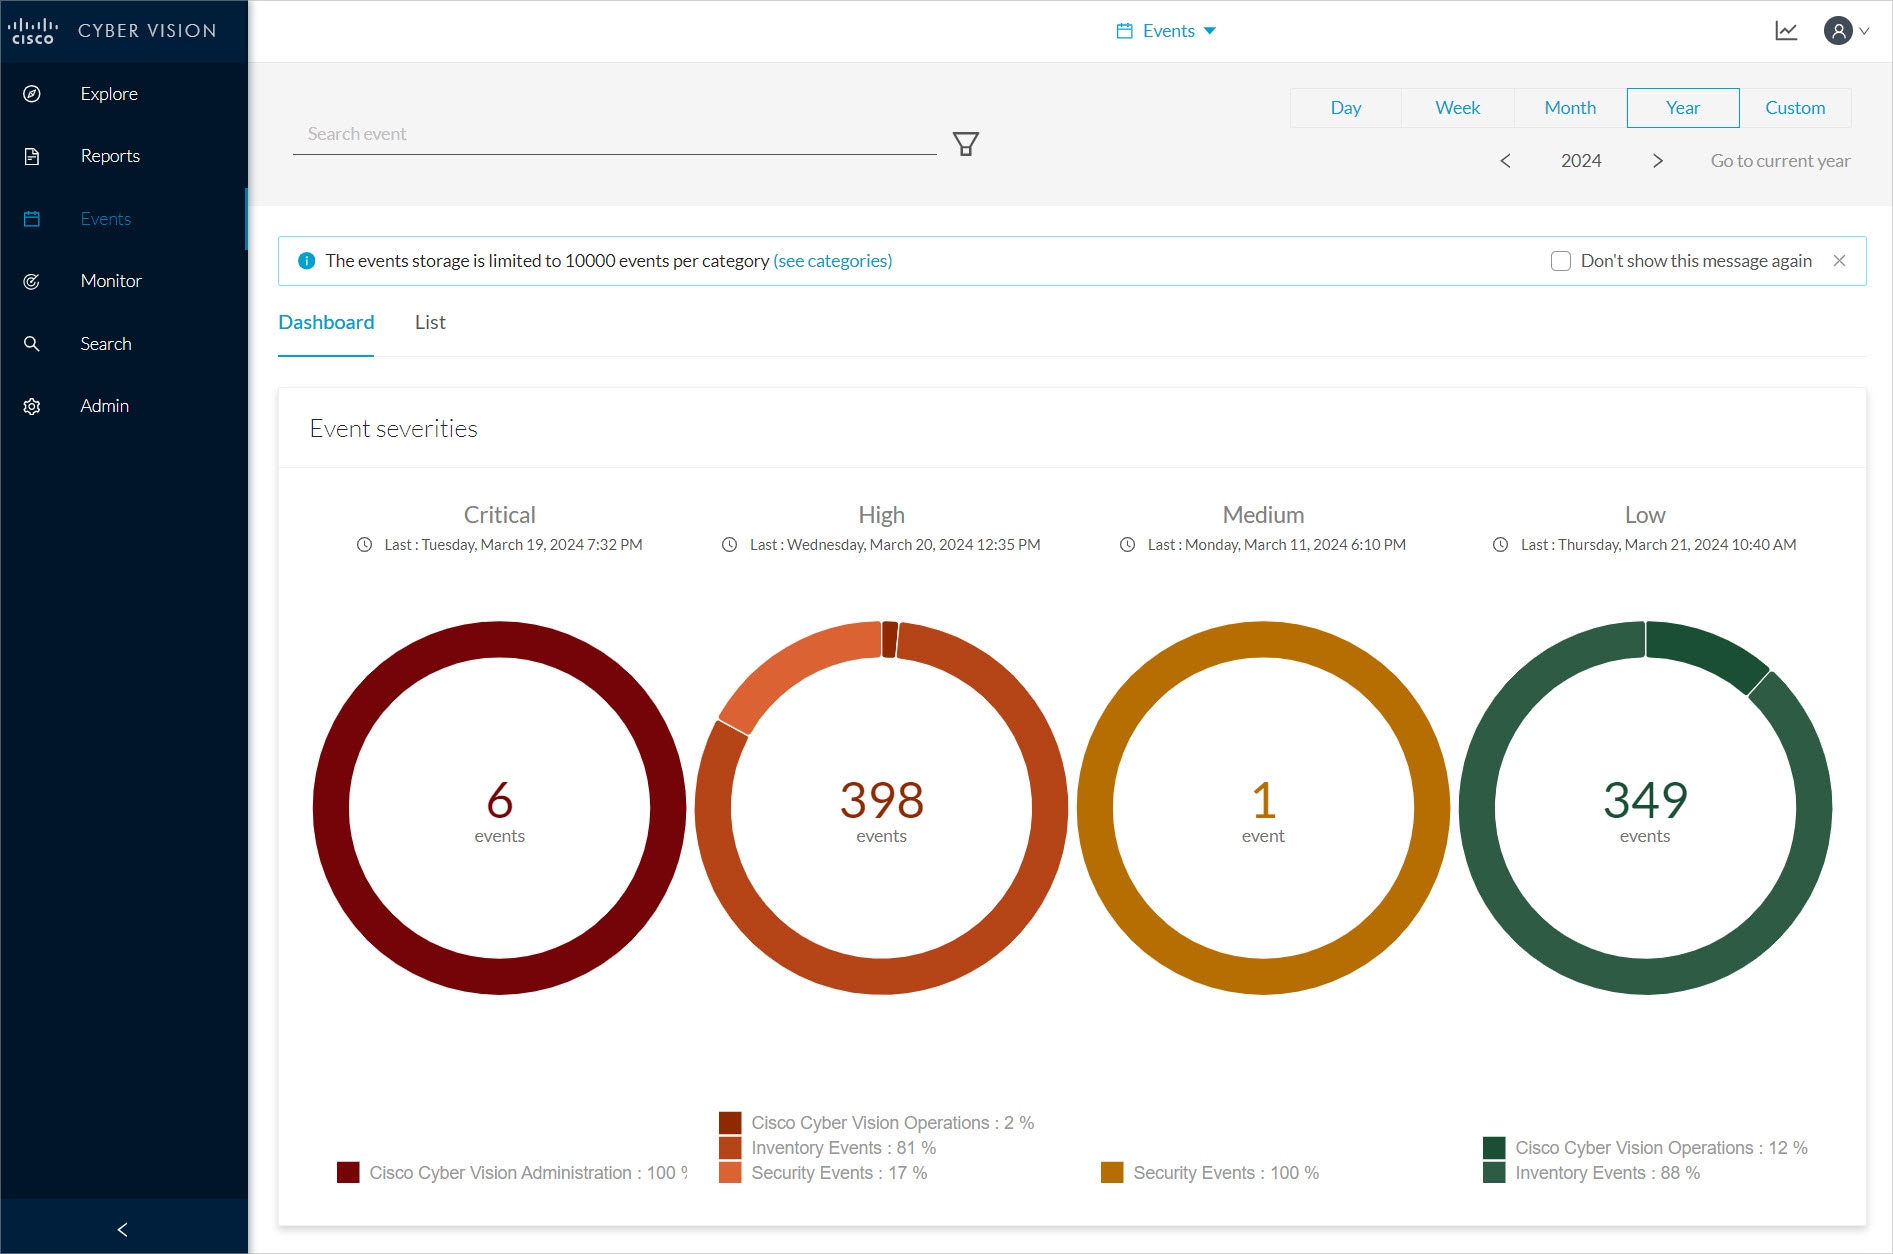
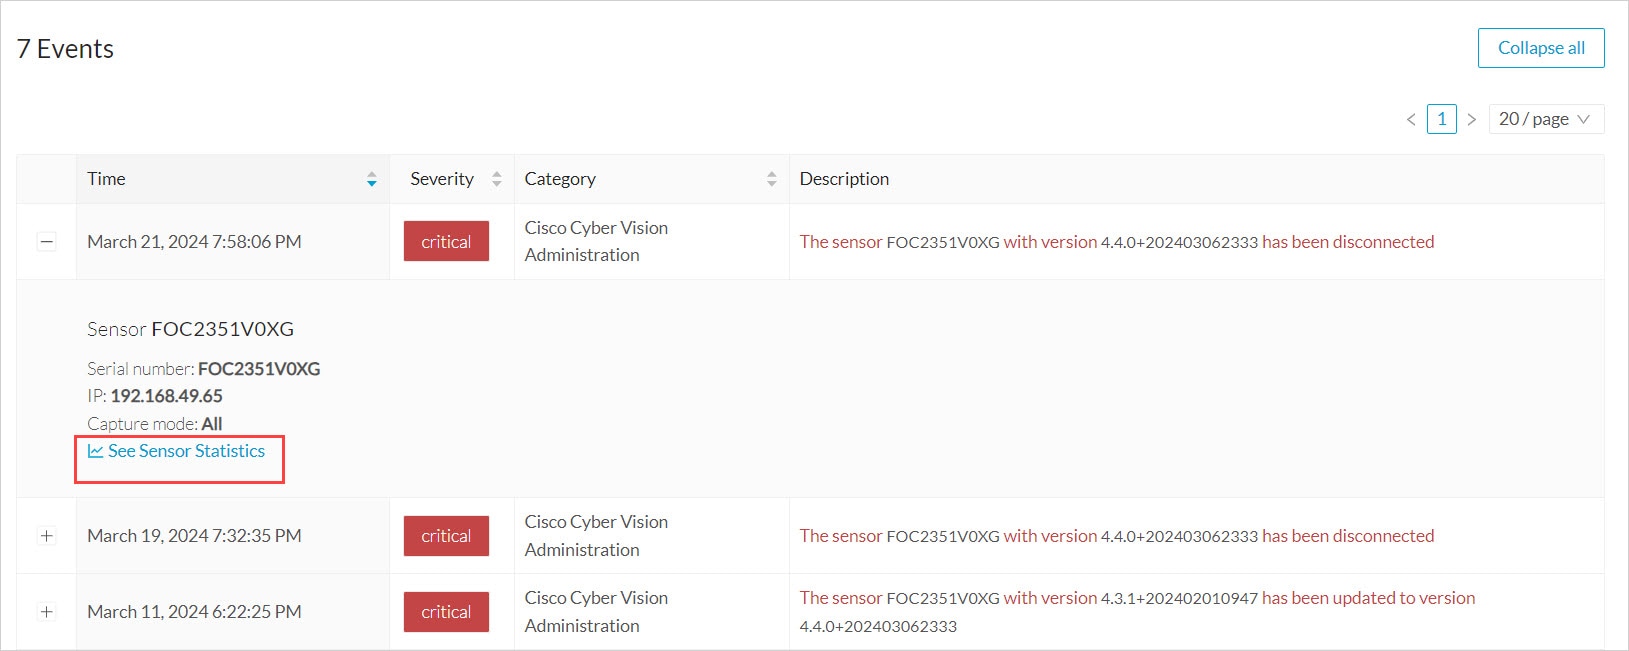
Click a doughnut. The screen toggles to a detailed Calendar view list filtered with the corresponding category and severity so you can quickly access more events details.

To see the list of Events per categories, click Admin > Events. See the Cisco Cyber Vision Administration Guide.

The line chart shows the number of events per severity over time. Click the event marker circle to see the number of events per category at a specific time.

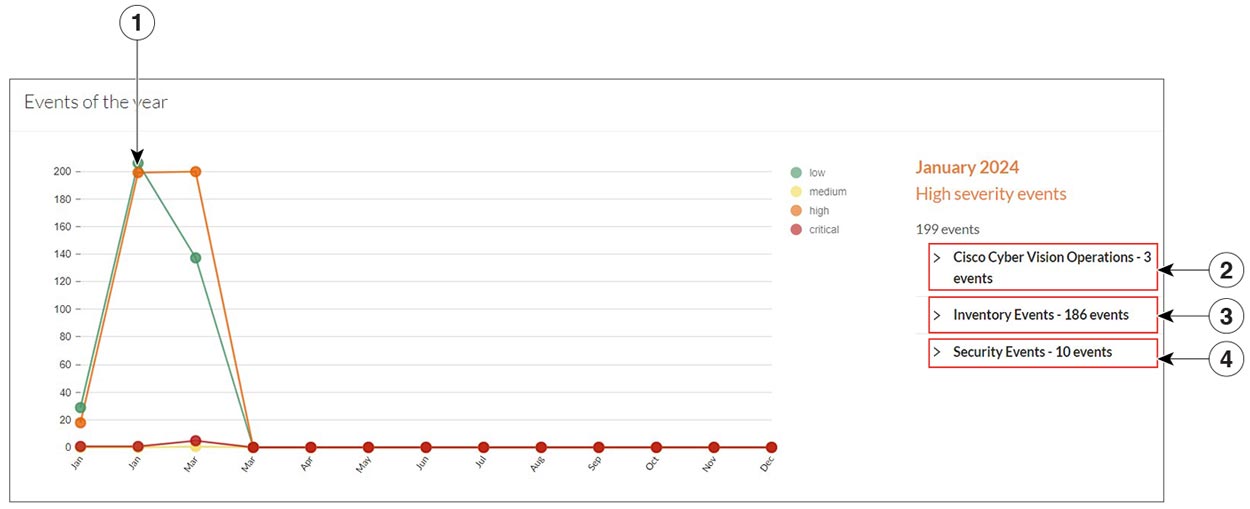
Click event markers (1) on the line to see the number of events per category according to a specific date. Click tab (2) for Cisco Cyber Vision Operations events details, tab (3) for Inventory Events details and tab (4) for Security Events details.

The List

List is a chronological view in which you can see and search events. Use the search bar to find events by MAC and IP addresses, component name, destination and source flow, severity and category. You can search the Events on Day, Week, Month or Year. Use the arrows for exact dates.

Click an event result for more details about the event.

When an event is related to sensors, click See Sensor Statistics for more details.

When an event is related to component or an activity, click see Technical Sheet for more details.