Getting Started with Network Analysis Policies

The following topics describe how to get started with network analysis policies:

Network Analysis Policy Basics

Network analysis policies govern many traffic preprocessing options, and are invoked by advanced settings in your access control policy. Network analysis-related preprocessing occurs after Security Intelligence matching and SSL decryption, but before intrusion or file inspection begins.

By default, the system uses the Balanced Security and Connectivity network analysis policy to preprocess all traffic handled by an access control policy. However, you can choose a different default network analysis policy to perform this preprocessing. For your convenience, the system provides a choice of several non-modifiable network analysis policies, which are tuned for a specific balance of security and connectivity by the Talos Intelligence Group. You can also create a custom network analysis policy with custom preprocessing settings.


Tip


System-provided intrusion and network analysis policies are similarly named but contain different configurations. For example, the Balanced Security and Connectivity network analysis policy and the Balanced Security and Connectivity intrusion policy work together and can both be updated in intrusion rule updates. However, the network analysis policy governs mostly preprocessing options, whereas the intrusion policy governs mostly intrusion rules. Network analysis and intrusion policies work together to examine your traffic.


You can also tailor traffic preprocessing options to specific security zones, networks, and VLANs by creating multiple custom network analysis policies, then assigning them to preprocess different traffic.

License Requirements for Network Analysis Policies

Threat Defense License

IPS

Classic License

Protection

Requirements and Prerequisites for Network Analysis Policies

Model Support

Any.

Supported Domains

Any

User Roles

  • Admin

  • Intrusion Admin

Managing Network Analysis Policies

In a multidomain deployment, the system displays policies created in the current domain, which you can edit. It also displays policies created in ancestor domains, which you cannot edit. To view and edit policies created in a lower domain, switch to that domain.

Procedure


Step 1

Choose Policies > Access Control, then click Network Analysis Policy or Policies > Access Control > Intrusion, then click Network Analysis Policies.

Note


If your custom user role limits access to the first path listed here, use the second path to access the policy.

Step 2

Manage your network analysis policy:

  • Compare—Click Compare Policies; see Comparing policies.

  • Create — If you want to create a new network analysis policy, click Create Policy.

    Two versions of the network analysis policy are created, a Snort 2 Version and a Snort 3 Version.

  • Delete — If you want to delete a network analysis policy, click Delete (delete icon), then confirm that you want to delete the policy. You cannot delete a network analysis policy if an access control policy references it.

    If the controls are dimmed, the configuration belongs to an ancestor domain, or you do not have permission to modify the configuration.

  • Deploy—Choose Deploy > Deployment; see Deploy Configuration Changes.

  • Edit — If you want to edit an existing network analysis policy, click Edit (edit icon) and proceed as described in Network Analysis Policy Settings and Cached Changes.

    If View (View button) appears instead, the configuration belongs to an ancestor domain, or you do not have permission to modify the configuration.

  • Report—Click Report (Report icon) ; see Generating Current Policy Reports.


Custom Network Analysis Policy Creation for Snort 3

The default network analysis policy is tuned for typical network requirements and optimal performance. Usually, the default network analysis policy suffices most network requirements and you might not need to customize the policy. However, when you have a specific network requirement or when you are facing performance issues, the default network analysis policy can be customized. Note that customising the network analysis policy is an advanced configuration that should be done only by advanced users or Cisco support.

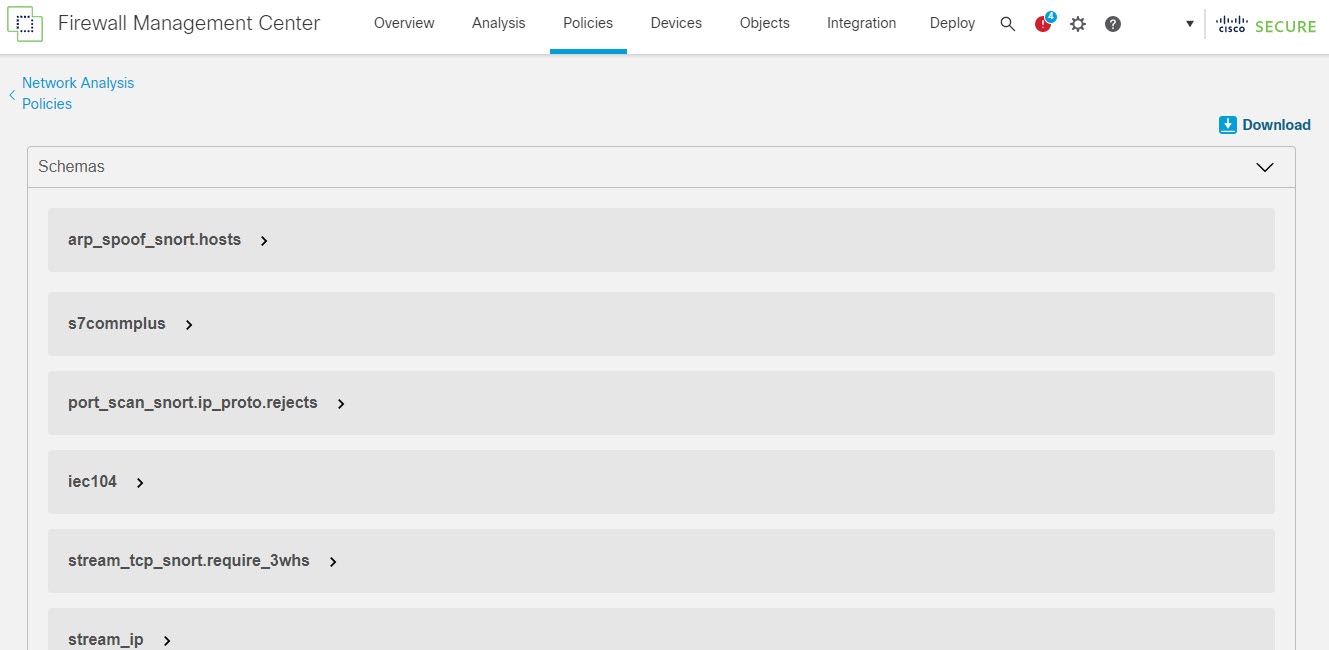
Network analysis policy configuration for Snort 3 is a data-driven model, which is based on JSON and JSON Schema. Schema is based on the OpenAPI specification, and it helps you get a view of the supported inspectors, settings, settings type, and valid values. The Snort 3 inspectors are plugins that process packets (similar to the Snort 2 preprocessor). Network analysis policy configuration is available to download in the JSON format.

In Snort 3, the list of inspectors and settings are not in a one-to-one mapping with the Snort 2 list of preprocessors and settings. Also, the number of inspectors and settings available in management center is a subset of the inspectors and settings that Snort 3 supports. See https://snort.org/snort3 for more information on Snort 3. See https://www.cisco.com/go/snort3-inspectors for more information on the inspectors available in management center.


Note


  • While upgrading the management center to the 7.0 release, the changes that were done in the Snort 2 version of the network analysis policy are not migrated to Snort 3 after the upgrade.

  • Unlike the intrusion policy, there is no option to synchronize Snort 2 network analysis policy settings to Snort 3.


Default Inspector Updates

Lightweight Security Package (LSP) updates may contain new inspectors or modifications to integer ranges for existing inspector configurations. Following the installation of an LSP, new inspectors and/or updated ranges will be available under Inspectors in the Snort 3 Version of your network analysis policy.

Binder Inspector

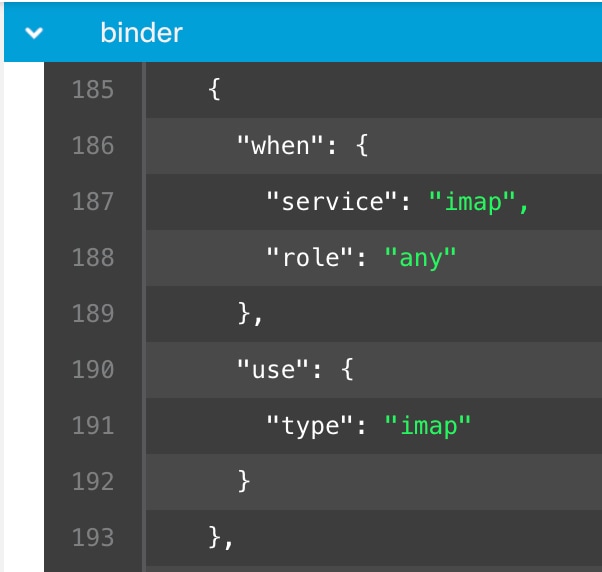
Binder inspector defines the flow when a particular inspector has to be accessed and taken into consideration. When the traffic matches the conditions defined in the binder inspector, only then the values/configurations for that inspector come into effect. For example:

For the imap inspector, the binder defines the following condition when it has to be accessed. That is when:

  • Service is equal to imap.

  • Role is equal to any.

If these conditions are met, then use the type imap.
Singleton Inspectors

Singleton inspectors contain a single instance. These inspectors do not support adding more instances like multiton inspectors. Settings of singleton inspector are applied to the entire traffic and not to a specific traffic segment.

For example:

{
   "normalizer":{
      "enabled":true,
      "type":"singleton",
      "data":{
         "ip4":{
            "df":true
         }
      }
   }
}

Multiton Inspectors

Multiton inspectors contain multiple instances which you can configure as needed. These inspectors support configuring settings based on specific conditions, such as network, port, and VLAN. One set of supported settings is called an instance. There is a default instance, and you can also add additional instances based on specific conditions. If the traffic matches that condition, the settings from that instance are applied. Otherwise, the settings from the default instance are applied. Also, the name of the default instance is the same as the inspector's name.

For a multiton inspector, when you upload the overridden inspector configuration, you also need to include/define a matching binder condition (conditions under when the inspector has to be accessed or used) for each instance in the JSON file, otherwise, the upload will result in an error. You can also create new instances, but make sure that you include a binder condition for every new instance that you create to avoid errors.

For example:

  • Multiton inspector where the default instance is modified.

    {
       "http_inspect":{
          "enabled":true,
          "type":"multiton",
          "instances":[
             {
                "name":"http_inspect",
                "data":{
                   "response_depth":5000
                }
             }
          ]
       }
    }
  • Multiton inspector where the default instance and default binder is modified.

    {
       "http_inspect":{
          "enabled":true,
          "type":"multiton",
          "instances":[
             {
                "name":"http_inspect",
                "data":{
                   "response_depth":5000
                }
             }
          ]
       },
       "binder":{
          "type":"binder",
          "enabled":true,
          "rules":[
             {
                "use":{
                   "type":"http_inspect"
                },
                "when":{
                   "role":"any",
                   "ports":"8080",
                   "proto":"tcp",
                   "service":"http"
                }
             }
          ]
       }
    }
  • Multiton inspector where a custom instance and a custom binder is added.

    {
       "http_inspect":{
          "enabled":true,
          "type":"multiton",
          "instances":[
             {
                "name":"http_inspect1",
                "data":{
                   "response_depth":5000
                }
             }
          ]
       },
       "binder":{
          "type":"binder",
          "enabled":true,
          "rules":[
             {
                "use":{
                   "type":"http_inspect",
                   "name":"http_inspect1"
                },
                "when":{
                   "role":"any",
                   "ports":"8080",
                   "proto":"tcp",
                   "service":"http"
                }
             }
          ]
       }
    }

Network Analysis Policy Mapping

For network analysis policies, Cisco Talos provides mapping information, which is used to find the corresponding Snort 2 version of the policies for the Snort 3 version.

This mapping ensures that the Snort 3 version of policies has its equivalent Snort 2 version.

View Network Analysis Policy Mapping

Procedure

Step 1

Go to Policies > Intrusion > Network Analysis Policies.

Step 2

Click NAP Mapping.

Step 3

Expand the arrow for View Mappings.

The Snort 3 network analysis policies that are automatically mapped to a Snort 2 equivalent policy are displayed.

Step 4

Click OK.


Create a Network Analysis Policy

All the existing network analysis policies are available in management center with their corresponding Snort 2 and Snort 3 versions. When you create a new network analysis policy, it is created with both the Snort 2 version and the Snort 3 version.

Procedure

Step 1

Go to Policies > Intrusion > Network Analysis Policies.

Step 2

Click Create Policy.

Step 3

Enter the Name and Description.

Step 4

Choose the Inspection Mode from the available choices.

  • Detection
  • Prevention

Step 5

Select a Base Policy and click Save.

Note


Configure Network Analysis Policy (NAP) in Prevention mode if you are using Snort 3 and SSL Decryption or TLS Server Identity.


The new network analysis policy is created with its corresponding Snort 2 Version and Snort 3 Version.

Modify the Network Analysis Policy

You can modify the network analysis policy to change its name, description, or the base policy.

Procedure

Step 1

Go to Policies > Intrusion > Network Analysis Policies.

Step 2

Click Edit to change the name, description, inspection mode, or the base policy.

Note


If you edit the network analysis policy name, description, base policy, and inspection mode, the edits are applied to both the Snort 2 and Snort 3 versions. If you want to change the inspection mode for a specific version, then you can do that from within the network analysis policy page for that respective version.

Step 3

Click Save.


Customize the Network Analysis Policy

You can customize the Snort 3 version of the network analysis policy according to your requirements.

Procedure

Step 1

Click the Actions drop-down menu in the Snort 3 Version of the network analysis policy.

The following options are displayed:

  • View Schema

  • Download

    • Schema

    • Sample File / Template

    • Full Configuration

    • Overridden Configuration

  • Upload

    • Overridden Configuration

Step 2

Click View Schema to open the schema file directly in a browser.

Step 3

Under Download, you can make use of the following options to download the schema file, sample file, full configuration, or overridden configuration as needed.

These options provide you an insight about the allowed values, range, and patterns, existing and default inspector configurations, and overridden inspector configurations.

  1. Click Schema to download the schema file.

    The schema file validates the content that you upload or download.You can download the schema file and open it using any third-party JSON editor. The schema file helps you to identify what parameters can be configured for inspectors with their corresponding allowed values, range, and accepted patterns to be used.

    For example, for the arp_spoof_snort inspector, you can configure the hosts. The hosts include the mac and ip address values. The schema file shows the following accepted pattern for these values.

    • macpattern: ^([0-9A-Fa-f]{2}[:-]){5}([0-9A-Fa-f]{2})$

    • ippattern: ^([0-9]{1,3}.[0-9]{1,3}.[0-9]{1,3}.[0-9]{1,3}(/[0-9]{1,2}){0,1})$

    You must provide the values, range, patterns according to the accepted ones in the schema file to be able to successfully override the inspector configuration, otherwise, you get an error message.

  2. Click Sample File / Template to use a pre-existing template that contains example configurations to help you with configuring the inspectors.

    You can refer to the example configurations included in the sample file and make any changes that you may require. See for information.

  3. Click Full Configuration to download the entire inspector configurations in a single file.

    Instead of expanding the inspectors separately, you can download the full configuration to look out for the information you need. All information regarding the inspector configuration is available in this file.

  4. Click Overridden Configuration to download the inspector configuration that has been overridden.

    If you have not overridden any inspector configuration, then this option is disabled. When you override the inspector configuration, then this option is enabled automatically to allow you to download.

Step 4

To override the existing configuration, follow the steps.

You can choose to override an inspector configuration using the following ways.

  • Make inline edits for an inspector directly on the management center. See for steps on how you can make inline edits.
  • Continue to follow the current procedure of using the Actions drop-down menu to upload the overridden configuration file.

If you chose to make inline edits directly on the management center, then you don't need to follow the current procedure further. Otherwise, you must follow this procedure completely.

  1. Under Inspectors, expand the required inspector for which you want to override the default configuration.

    The default configuration is displayed on the left column and the overridden configuration is displayed on the right column under the inspector.

    You may need to search for an inspector by entering any relevant text in in the search bar.

  2. Click the Copy to clipboard icon to copy the default inspector configuration to the clipboard.

  3. Create a JSON file and paste the default configuration in it.

  4. Keep the inspector configuration that you want to override, and remove all the other configuration and instances from the JSON file.

    You can also use the Sample File / Template to understand how to override the default configuration. This is a sample file that includes JSON snippets explaining how you can customize the network analysis policy for Snort 3.See for more information.

  5. Make changes to the inspector configuration as needed.

    Validate the changes and make sure they conform to the schema file. For multiton inspectors, make sure that the binder conditions for all instances are included in the JSON file. See Multiton Inspectors in Custom Network Analysis Policy Creation for Snort 3for more information.

  6. If you are copying any further default inspector configurations, append that inspector configuration to the existing file that contains the overridden configuration.

    Note


    The copied inspector configuration must comply with the JSON standards.

  7. Save the overridden configuration file to your system.

  8. Upload the overridden configuration to the management center as described in the next step.

Step 5

Under Upload, you can click Overridden Configuration to upload the JSON file that contains the overridden configuration.

Caution


Upload only the changes that you require. You should not upload the entire configuration as it makes the overrides sticky in nature and therefore, any subsequent changes to the default configuration as part of the LSP updates would not be applied.

You can drag and drop a file or click to browse to the JSON file saved in your system that contains the overridden inspector configuration.

  • Merge inspector overrides – Content in the uploaded file is merged with the existing configuration if there is no common inspector. If there are common inspectors, then the content in the uploaded file (for common inspectors) takes precedence over the previous content, and it replaces the previous configuration for those inspectors.
  • Replace inspector overrides – Removes all previous overrides and replaces them with the new content in the uploaded file.

    Attention


    As choosing this option deletes all the previous overrides, make an informed decision before you override the configuration using this option.

If any error occurs while uploading the overridden inspectors, you see the error on the Upload Overridden Configuration File pop-up window. You can also download the file with the error, then fix the error and reupload the file.

Step 6

In the Upload Overridden Configuration File pop-up window, click the Import button to upload the overridden inspector configuration.

After you upload the overridden inspector configuration, you will see an Orange-colored circle next to the inspector that signifies that it’s an overridden inspector.

Also, the Overridden Configuration column under the inspector shows the overridden value.

You can also view all the overridden inspectors using the Show Overrides Only checkbox adjacent to the Search bar.

Note


Make sure that you always download the Overridden Configurations under Download, then open the JSON file and append any new changes/overrides to the inspector configurations to this file. This action is needed so that you don’t lose the old overridden configurations.

Step 7

(Optional) Take a backup of the overridden configuration file on your system before making any new inspector configuration changes.

Tip


We recommend that you take the backup from time to time as you override the inspector configuration.


Custom Network Analysis Policy Creation for Snort 2

When you create a new network analysis policy you must give it a unique name, specify a base policy, and choose an inline mode.

The base policy defines the network analysis policy’s default settings. Modifying a setting in the new policy overrides—but does not change—the settings in the base policy. You can use either a system-provided or custom policy as your base policy.

The network analysis policy’s inline mode allows preprocessors to modify (normalize) and drop traffic to minimize the chances of attackers evading detection. Note that in passive deployments, the system cannot affect traffic flow regardless of the inline mode.

Creating a Custom Network Analysis Policy

In a multidomain deployment, the system displays policies created in the current domain, which you can edit. It also displays policies created in ancestor domains, which you cannot edit. To view and edit policies created in a lower domain, switch to that domain.

Procedure

Step 1

Choose Policies > Access Control, then click Network Analysis Policy or Policies > Access Control > Intrusion, then click Network Analysis Policies.

Note


If your custom user role limits access to the first path listed here, use the second path to access the policy.

Step 2

Click Create Policy. If you have unsaved changes in another policy, click Cancel when prompted to return to the Network Analysis Policy page.

Step 3

Enter a unique Name.

In a multidomain deployment, policy names must be unique within the domain hierarchy. The system may identify a conflict with the name of a policy you cannot view in your current domain.

Step 4

Optionally, enter a Description.

Step 5

Choose the initial Base Policy. You can use either a system-provided or custom policy as your base policy.

Attention


While configuring your custom NAP, if you select Maximum Detection as the Base Policy, you might experience performance degrade. It is recommended to review and test this setting before deploying to production environment.

Step 6

If you want to allow preprocessors to affect traffic in an inline deployment, enable Inline Mode.

Step 7

To create the policy:

  • Click Create Policy to create the new policy and return to the Network Analysis Policy page. The new policy has the same settings as its base policy.
  • Click Create and Edit Policy to create the policy and open it for editing in the advanced network analysis policy editor.

Network Analysis Policy Management for Snort 2

On the Network Analysis Policy page ( or Policies > Access Control, then click Network Analysis Policy or Policies > Access Control > Intrusion, then click Network Analysis Policies) you can view your current custom network analysis policies, along with the following information:

  • the time and date the policy was last modified (in local time) and the user who modified it

  • whether the Inline Mode setting is enabled, which allows preprocessors to affect traffic

  • which access control policies and devices are using the network analysis policy to preprocess traffic

  • whether a policy has unsaved changes, as well as information about who (if anyone) is currently editing the policy

In addition to custom policies that you create, the system provides two custom policies: Initial Inline Policy and Initial Passive Policy. These two network analysis policies use the Balanced Security and Connectivity network analysis policy as their base. The only difference between them is their inline mode, which allows preprocessors to affect traffic in the inline policy and disables it in the passive policy. You can edit and use these system-provided custom policies.

Note that you can create and edit network analysis as well as intrusion policies if your system user account’s role is restricted to Intrusion Policy or Modify Intrusion Policy.

Network Analysis Policy Settings and Cached Changes

When you create a new network analysis policy, it has the same settings as its base policy.

When tailoring a network analysis policy, especially when disabling preprocessors, keep in mind that some preprocessors and intrusion rules require that traffic first be decoded or preprocessed in a certain way. If you disable a required preprocessor, the system automatically uses it with its current settings, although the preprocessor remains disabled in the network analysis policy web interface.


Note


Because preprocessing and intrusion inspection are so closely related, the network analysis and intrusion policies examining a single packet must complement each other. Tailoring preprocessing, especially using multiple custom network analysis policies, is an advanced task.


The system caches one network analysis policy per user. While editing a network analysis policy, if you select any menu or other path to another page, your changes stay in the system cache even if you leave the page.

Editing Network Analysis Policies

In a multidomain deployment, the system displays policies created in the current domain, which you can edit. It also displays policies created in ancestor domains, which you cannot edit. To view and edit policies created in a lower domain, switch to that domain.

Procedure

Step 1

Choose Policies > Access Control, then click Network Analysis Policy or Policies > Access Control > Intrusion, then click Network Analysis Policies.

Note


If your custom user role limits access to the first path listed here, use the second path to access the policy.

Step 2

Click Snort 2 Version next to the policy you want to edit.

Step 3

Click Edit (edit icon) next to the network analysis policy you want to configure.

If View (View button) appears instead, the configuration belongs to an ancestor domain, or you do not have permission to modify the configuration.

Step 4

Edit your network analysis policy:

  • Change the base policy — If you want to change the base policy, choose a base policy from the Base Policy drop-down list on the Policy Information page.
  • Manage policy layers — If you want to manage policy layers, click Policy Layers in the navigation panel.
  • Modify a preprocessor — If you want to enable, disable, or edit the settings for a preprocessor, click Settings in the navigation panel.
  • Modify traffic — If you want to allow preprocessors to modify or drop traffic, check the Inline Mode check box on the Policy Information page.
  • View settings — If you want to view the settings in the base policy, click Manage Base Policy on the Policy Information page.

Step 5

To save changes you made in this policy since the last policy commit, choose Policy Information, then click Commit Changes. If you leave the policy without committing changes, changes since the last commit are discarded if you edit a different policy.


What to do next
  • If you want a preprocessor to generate events and, in an inline deployment, drop offending packets, enable rules for the preprocessor. For more information, see Setting Intrusion Rule States.

  • Deploy configuration changes.

Preprocessor Configuration in a Network Analysis Policy for Snort 2

Preprocessors prepare traffic to be further inspected by normalizing traffic and identifying protocol anomalies. Preprocessors can generate preprocessor events when packets trigger preprocessor options that you configure. The base policy for your network analysis policy determines which preprocessors are enabled by default and the default configuration for each.


Note


In most cases, preprocessors require specific expertise to configure and typically require little or no modification. Tailoring preprocessing, especially using multiple custom network analysis policies, is an advanced task. Because preprocessing and intrusion inspection are so closely related, the network analysis and intrusion policies examining a single packet must complement each other.


Modifying a preprocessor configuration requires an understanding of the configuration and its potential impact on your network.

Note that some advanced transport and network preprocessor settings apply globally to all networks, zones, and VLANs where you deploy your access control policy. You configure these advanced settings in an access control policy rather than in a network analysis policy.

Note also that you configure the sensitive data preprocessor, which detects sensitive data such as credit card numbers and Social Security numbers in ASCII text, in intrusion policies.

Preprocessor Traffic Modification in Inline Deployments

In an inline deployment (that is, where relevant configurations are deployed to devices using routed, switched, or transparent interfaces, or inline interface pairs), some preprocessors can modify and block traffic. For example:

  • The inline normalization preprocessor normalizes packets to prepare them for analysis by other preprocessors and the intrusion rules engine. You can also use the preprocessor’s Allow These TCP Options and Block Unresolvable TCP Header Anomalies options to block certain packets.

  • The system can drop packets with invalid checksums.

  • The system can drop packets matching rate-based attack prevention settings.

For a preprocessor configured in the network analysis policy to affect traffic, you must enable and correctly configure the preprocessor, as well as correctly deploy managed devices inline. Finally, you must enable the network analysis policy’s Inline Mode setting.

Preprocessor Configuration in a Network Analysis Policy Notes

When you select Settings in the navigation panel of a network analysis policy, the policy lists its preprocessors by type. On the Settings page, you can enable or disable preprocessors in your network analysis policy, as well as access preprocessor configuration pages.

A preprocessor must be enabled for you to configure it. When you enable a preprocessor, a sublink to the configuration page for the preprocessor appears beneath the Settings link in the navigation panel, and an Edit link to the configuration page appears next to the preprocessor on the Settings page.


Tip


To revert a preprocessor’s configuration to the settings in the base policy, click Revert to Defaults on a preprocessor configuration page. When prompted, confirm that you want to revert.


When you disable a preprocessor, the sublink and Edit link no longer appear, but your configurations are retained. Note that to perform their particular analysis, many preprocessors and intrusion rules require that traffic first be decoded or preprocessed in a certain way. If you disable a required preprocessor, the system automatically uses it with its current settings, although the preprocessor remains disabled in the network analysis policy web interface.

If you want to assess how your configuration would function in an inline deployment without actually modifying traffic, you can disable inline mode. In passive deployments or inline deployments in tap mode, the system cannot affect traffic regardless of the inline mode setting.


Note


Disabling inline mode can affect intrusion event performance statistics graphs. With inline mode enabled in an inline deployment, the Intrusion Event Performance page (Overview > Summary > Intrusion Event Performance) displays graphs that represent normalized and blocked packets. If you disable inline mode, or in a passive deployment, many of the graphs display data about the traffic the system would have normalized or dropped.


Note


In an inline deployment, we recommend that you enable inline mode and configure the inline normalization preprocessor with the Normalize TCP Payload option enabled. In a passive deployment, we recommend that you use adaptive profile updates.