Configuration Deployment

The following topics describe how to manage various policies on the Secure Firewall Management Center:

Requirements and Prerequisites for Policy Management

Model Support

Any.

Supported Domains

Any

User Roles

  • Admin

  • Network Admin

  • Security Approver

Policy Deployment


Caution


Do NOT push the management center deployments over a VPN tunnel that is terminating directly on the threat defense. Pushing the management center deployments can potentially inactivate the tunnel and disconnect the management center and the threat defense.

Recovering the device from this situation can be very disruptive and require executing the disaster recovery procedure. This procedure resets the threat defense configuration to factory defaults by changing manager from management center to local and configuring the device from beginning. For more information, see Deploying the Management Center Policy Configuration over VPN Tunnel.


After you configure your deployment, and any time you change that configuration, you must deploy the changes to affected devices. You can view deployment status in the Message Center.

Deploying updates the following components:

  • Device and interface configurations

  • Device-related policies: NAT, VPN, QoS, platform settings

  • Access control and related policies: DNS, file, identity, intrusion, network analysis, prefilter, SSL

  • Network discovery policy

  • Intrusion rule updates

  • Configurations and objects associated with any of these elements

You can configure the system to deploy automatically by scheduling a deploy task or by setting the system to deploy when importing intrusion rule updates. Automating policy deployment is especially useful if you allow intrusion rule updates to modify system-provided base policies for intrusion and network analysis. Intrusion rule updates can also modify default values for the advanced preprocessing and performance options in your access control policies.

In a multidomain deployment, you can deploy changes for any domain where your user account belongs:

  • Switch to an ancestor domain to deploy changes to all subdomains at the same time.

  • Switch to a leaf domain to deploy changes to only that domain.

Best Practices for Deploying Configuration Changes

The following are guidelines for deploying configuration changes.

Deploying the Management Center Policy Configuration over VPN Tunnel

You can deploy the management center policy configuration over a VPN tunnel, only if the deployment is for a device that does not terminate the tunnel. The management center to threat defense management traffic should be its own secure transport SF tunnel and does not need to be over S2S VPN tunnel for any connectivity.

For policy-based VPN tunnel, choose the protected networks on both side to exclude the management center to threat defense management traffic. For route-based VPN tunnel, configure the routing to exclude the management center to threat defense management traffic to the VTI interface.

When you push the management center deployments over the VPN tunnel with the management traffic that is also passing through the tunnel, in the event of any VPN misconfiguration, it inactivates the tunnel and results in disconnecting the management center and the threat defense.

To reinstantiate the tunnel configuration, you can either:

  • Remove the sensor from the threat defense and the management center (resulting in losing all of its configuration), and then add the sensor again to the management center.

    Or

  • Contact Cisco TAC.


    Note


    Reinstantiating the tunnel configuration requires overhauling of the system.


Inline vs Passive Deployments

Do not apply inline configurations to devices deployed passively, and vice versa.

Time to Deploy and Memory Limitations

The time it takes to deploy depends on multiple factors, including (but not limited to):

  • The configurations you send to the device. For example, if you dramatically increase the number of Security Intelligence entries you block, deploy can take longer.

  • Device model and memory. On lower-memory devices, deploying can take longer.

Do not exceed the capability of your devices. If you exceed the maximum number of rules or policies supported by a target device, the system displays a warning. The maximum depends on a number of factors—not only memory and the number of processors on the device, but also on policy and rule complexity. For information on optimizing policies and rules, see Best Practices for Access Control Rules.

Interruptions to Traffic Flow and Inspection During Deploy

When you deploy, resource demands may result in a small number of packets dropping without inspection. Additionally, deploying some configurations restarts the Snort process, which interrupts traffic inspection. Whether traffic drops during this interruption or passes without further inspection depends on how the target device handles traffic. See Snort Restart Traffic Behavior and Configurations that Restart the Snort Process When Deployed or Activated.

For the threat defense devices, the Inspect Interruption column in the Deploy dialog warns you when deploying might interrupt traffic flow or inspection. You can either proceed with, cancel, or delay deployment; see Restart Warnings for the Threat Defense Devices for more information.


Caution


We strongly recommend you deploy in a maintenance window or at a time when interruptions will have the least impact.

Auto-Enabling Application Detectors

If you are performing application control but disable required detectors, the system automatically enables the appropriate system-provided detectors upon policy deploy. If none exist, the system enables the most recently modified user-defined detector for the application.

Asset Rediscovery with Network Discovery Policy Changes

When you deploy changes to a network discovery policy, the system deletes and then rediscovers MAC address, TTL, and hops information from the network map for the hosts in your monitored networks. Also, the affected managed devices discard any discovery data that has not yet been sent to the management center.

Restart Warnings for the Threat Defense Devices

When you deploy, the Inspect Interruption column in the deploy page specifies whether a deployed configuration restarts the Snort process on the threat defense device. When the traffic inspection engine referred to as the Snort process restarts, inspection is interrupted until the process resumes. Whether traffic is interrupted or passes without inspection during the interruption depends on how the device handles traffic. Note that you can proceed with the deployment, cancel the deployment and modify the configuration, or delay the deployment until a time when deploying would have the least impact on your network.

When the Inspect Interruption column indicates Yes and you expand the device configuration listing, the system indicates any specific configuration type that would restart the Snort process with an Inspect Interruption (inspect interruption icon). When you hover your mouse over the icon, a message informs you that deploying the configuration may interrupt traffic.

The following table summarizes how the deploy page displays inspection interruption warnings.

Table 1. Inspection Interruption Indicators

Type

Inspect Interruption

Description

Threat Defense

Inspect Interruption (inspect interruption icon)Yes

At least one configuration would interrupt inspection on the device if deployed, and might interrupt traffic depending on how the device handles traffic. You can expand the device configuration listing for more information.

--

Deployed configurations will not interrupt traffic on the device.

Undetermined

The system cannot determine if a deployed configuration may interrupt traffic on the device.

Undetermined status is displayed before the first deployment after a software upgrade, or in some cases during a Support call.

Errors (error icon)

The system cannot determine the status due to an internal error.

Cancel the operation and click Deploy again to allow the system to redetermine the Inspect Interruption status. If the problem persists, contact Support.

sensor

--

The device identified as sensor is not the threat defense device; the system does not determine if a deployed configuration may interrupt traffic on this device.

For information on all configurations that restart the Snort process for all device types, see Configurations that Restart the Snort Process When Deployed or Activated.

Deployment Status

On the Deployment page, the Status column provides the deployment status for each device. If a deployment is in progress, then the live status of the deployment progress is displayed, else one of the following statuses is displayed:

  • Pending—Indicates that there are changes in the device that are to be deployed.

  • Warnings or errors—Indicates that the pre-deployment checks have identified warnings or errors for the deployment, and you have not proceeded with the deployment. You can continue with the deployment if there are any warnings, but not if there are any errors.


    Note


    The status column provides the warning or error status only for a single user session on the deployment page. If you navigate away from the page or refresh the page, the status changes to pending.


  • Failed—Indicates that the previous deployment attempt failed. Click on the status to view the details.

  • In queue—Indicates that deployment is initiated, and the system is yet to start the deployment process.

  • Completed—Indicates that deployment has completed successfully.

Deployment Estimate

The Estimate link is available on the Deployment page after you select a device, a policy, or a configuration. Click the Estimate link to get an estimate of the deployment duration. The time duration is a rough estimate (having around 70% accuracy), and the actual time taken for deployment may vary for a few scenarios. Refer to the deployment duration estimate for deployments to a few the threat defense devices. The estimate is dependable for deployments of up to 20 threat defense devices.

When an estimate is not available, it indicates that the data is not available, since the first successful deployment on the selected device is pending. This situation could occur after the management center reimage, version upgrade, or after a high availability failover.


Note


The estimate is incorrect and unreliable for bulk policy changes (in case of bulk policy migrations), and selective deployments because the estimate is based on the heuristic technique.


Deployment Notes

Deployment notes are custom notes that a user can add as part of the deployment, and these notes are optional.

You can view the deployment notes in the Deployment History page. On the management center menu bar, click Deploy and then select Deployment History to view the Deployment Notes column for each job.

Use the Search option on the Deployment History page to search using job name, device name, user name, status, deployment notes, or 'Bookmarked' keyword.

Deployment Preview

Preview provides a snapshot of all the policy and object changes to be deployed on the device. The policy changes include the new policies, changes in the existing policies, and the deleted policies. The object changes include the added and modified objects which are used in policies. The unused object changes are not displayed because they are not deployed on the device.

On the Deployment page, the Preview column provides a Preview (preview icon) icon for each listed device. On clicking the preview icon, the management center displays a UI page listing all the policy and object changes. The left pane on the preview page lists all the different policy types that have changed on the device, organized in a tree structure.

The Filter icon () provided on the Preview page provides an option to filter the policies at the user level and policy level. Click the Filter icon (). Select the policy or user name, or both, and then click Apply to restrict the displayed listing to only the selected items. To view all the pending deployments, ensure that you click the Filter icon () and select Reset.

The right pane lists all the additions, changes, or deletions in the policy, or the object selected in the left pane. The two columns on the right pane provide the last deployed configuration settings (in the Deployed Version column) versus the changes that are due for deployment (in the Version on Firewall Management Center column). The last deployed configuration settings are derived from a snapshot of the last saved deployment in the management center and not from the device. The background colors of the settings are color-coded as per the legend available on the top-right of the page.

The Modified By column lists the users who have modified, or added the configuration settings. At the policy level, the management center displays all the users who have modified the policy, and at the rule level, the management center displays only the last user who has modified the rule.

Deployment preview of changes to Security Intelligence, Geolocation, Sinkhole, and File List objects is supported. For an explanation of these and other reusable objects supported in the management center, see Object Management.

You can download a copy of the change log by clicking the Download as PDF button.


Note


  • To preview the deploy changes, you require access from the REST API to the management center. To enable the REST API access, follow the steps in Enabling REST API Access in the Cisco Secure Firewall Management Center Administration Guide.

  • The preview does not show the reordering of rules across policies.

    For DNS policies, reordered rules appear in the preview list as rule additions and deletions. For example, moving a rule from position 1 to position 3 in the rule order is displayed as if the rule was deleted from position 1 and added as a new rule in position 3. Similarly, when a rule is deleted, the rules under it are listed as edited rules as they have changed their positions. The changes are displayed in the final order in which they appear in the policy.

  • The preview shows all the default values, even when they are not altered, along with the other configured settings when an interface or a platform settings policy is added for the first time. Similarly, the high availability-related policies and default values for settings are shown, even when they are not altered, in the first preview after a high availability pair is configured or disrupted.

  • Preview is not supported for some objects.

  • Object additions and attribute changes are displayed in the preview only if the objects are associated with any device or interface. Object deletions are not displayed.

  • Preview is not supported for the following policies:

    • High availability

    • Network discovery

    • Network analysis

    • Device settings

  • User information at rule level is not available for intrusion policies.

  • The management center displays the username as system for the following operations:

    • Rollback

    • Upgrade

    • Threat Defense backup and restore

    • SRU update

    • LSP update

    • VDB update

  • If you change the management center name in System (system gear icon) > Configuration > Information, the deployment preview does not specify this change, yet it requires deploy.

  • To view changes due to an auto rollback, see Edit Deployment Settings.


Filter Support for Deployment

The Filter icon (filter) provided on the Deployment page provides an option to filter the device listings that are pending deployment. The filter icon provides options to filter the listings based on selected devices and user names. You can use the filter along with the search option to narrow down to the required listing.

Click the Filter icon (filter). Select the device or user name, or both, and then click Apply to restrict the displayed listing to only the selected items. To view all the pending deployments, ensure that you click the Filter icon (filter) and select Reset.

Selective Policy Deployment


Caution


Do NOT push the management center deployments over a VPN tunnel that is terminating directly on the threat defense. Pushing the management center deployments can potentially inactivate the tunnel and disconnect the management center and the threat defense.

Recovering the device from this situation can be very disruptive and require executing the disaster recovery procedure. This procedure resets the threat defense configuration to factory defaults by changing manager from management center to local and configuring the device from beginning. For more information, see Deploying the Management Center Policy Configuration over VPN Tunnel.


The management center allows you to select a specific policy within the list of all the changes on the device that are due for deployment and deploy only the selected policy. Selective deployment is available only for the following policies:

  • Access control policies

  • Intrusion policies

  • Malware and file policies

  • DNS policies

  • Identity policies

  • SSL policies

  • QoS policies

  • Prefilter policies

  • Network discovery

  • NAT policies

  • Routing policies

  • VPN policies

On the deployment page, after you click Expand Arrow (expand arrow icon) to view device-specific configuration changes, Policy selection (policy selection icon) icon is visible. The policy selection icon allows you to select individual policies or configurations to deploy while withholding the remaining listed changes without deploying them. You can also view the interdependent changes for a certain policy or configuration using this option. The management center dynamically detects dependencies in-between policies (for example, between an access control policy and an intrusion policy), and between the shared objects and the policies. Interdependent changes are indicated using color-coded tags to identify a set of interdependent deployment changes. When one of the deployment changes is selected, the interdependent changes are automatically selected.


Note


  • When the changes in shared objects are deployed, the impacted policies should also be deployed along with them. When you select a shared object during deployment, the impacted policies are automatically selected.

  • Selective deployment is not supported for scheduled deployments and deployments using REST APIs. You can only opt for complete deployment of all the changes in these cases.

  • The pre-deployment checks for warnings and errors are performed not only on the selected policies, but on all the policies that are out-of-date. Therefore, the warnings or errors list shows the deselected policies as well.

  • Similarly, the Inspect Interruption column indication on the Deployment page considers all out-of-date policies and not just the selected policies. For information on the Inspect Interruption column, see Restart Warnings for the Threat Defense Devices.


There are certain limitations to selectively deploying policies. Follow the contents in the table below to understand when selective policy deployment can be used.

Table 2. Limitations for Selective Deployment

Type

Description

Scenarios

Full deployment

Full deployment is necessary for specific deploy scenarios, and the management center does not support selective deployment in such scenarios. If you encounter an error in such scenarios, you may choose to proceed by selecting all the changes for deployment on the device.

Scenarios wherein a full deployment is required are:

  • The first deployment after you have upgraded the threat defense or the management center.

  • The first deployment after you have restored the threat defense.

  • The first deployment after modifications in the threat defense interface settings.

  • The first deployment after modifications in the virtual router settings.

  • When the threat defense device is moved to a new domain (global to sub-domain or sub-domain to global).

Associated policy deployment

The management center identifies interdependent policies which are interlinked. When one of the interlinked policies is selected, the remaining interlinked policies are automatically selected.

Scenarios wherein an associated policy is automatically selected:

  • When a new object is associated with an existing policy.

  • When an existing policy's object is modified.

Scenarios wherein multiple policies are automatically selected:

  • When a new object is associated with an existing policy, and the same object is already associated with other policies, all the associated policies are automatically selected.

  • When a shared object is modified, all the associated policies are automatically selected.

Interdependent policy changes (shown using color-coded tags)

The management center dynamically detects dependencies in-between policies, and between the shared objects and the policies. The interdependency of the objects or policies is shown using color-coded tags.

Scenarios wherein color-coded interdependent policies or objects are automatically selected:

  • When all the out-of-date policies have interdependent changes.

    For example, when an access control policy, an intrusion policy, and a NAT policy are out-of-date. Since access control policy and NAT policy share an object, all policies are selected together for deployment.

  • When all out-of-date policies share an object, and the object is modified.

Access Policy Group specifications

Access Policy Group policies are listed together in the preview window under Access Policy Group when you click Show or Hide Policy (Show or Hide Policy icon).

The scenarios and the expected behavior for Access Policy Group policies are:

  • If the access control policy is out-of-date, all other out-of-date policies under this group, except file policy and intrusion policy, are selected when the access control policy is selected for deployment.

    However, if the access control policy is out-of-date, intrusion and file policies can be individually selected or deselected irrespective of whether the access control policy is selected or not, unless there are any dependent changes. For example, if a new intrusion policy is assigned to an access control rule, it indicates that there are dependent changes, then both the access control policy and the intrusion policy will be automatically selected when either of them is selected.

  • If no access control policy is out-of-date, other out-of-date policies in this group can be selected and deployed individually.

Deploy Configuration Changes


Caution


Do NOT push the management center deployments over a VPN tunnel that is terminating directly on the threat defense. Pushing the management center deployments can potentially inactivate the tunnel and disconnect the management center and the threat defense.

Recovering the device from this situation can be very disruptive and require executing the disaster recovery procedure. This procedure resets the threat defense configuration to factory defaults by changing manager from management center to local and configuring the device from beginning. For more information, see Deploying the Management Center Policy Configuration over VPN Tunnel.


After you change configurations, deploy them to the affected devices. We strongly recommend that you deploy in a maintenance window or at a time when any interruptions to traffic flow and inspection will have the least impact.


Caution


When you deploy, resource demands may result in a small number of packets dropping without inspection. Additionally, deploying some configurations restarts the Snort process, which interrupts traffic inspection. Whether traffic drops during this interruption or passes without further inspection depends on how the target device handles traffic. See Snort Restart Traffic Behavior and Configurations that Restart the Snort Process When Deployed or Activated.

Before you begin

  • Review the guidelines described in Best Practices for Deploying Configuration Changes.

  • Be sure all managed devices use the same revision of the Security Zones object. If you have edited security zone objects: Do not deploy configuration changes to any device until you edit the zone setting for interfaces on all devices you want to sync. You must deploy to all managed devices at the same time.


Note


Policy deployment process fails if the sensor configuration is being read by the system during deployment. Executing commands such as show running-config from the sensor CLI disturbs the deployment, which results in deployment failure.

Procedure


Step 1

On the management center menu bar, click Deploy check the check box of specific devices and then click Deploy or click Deploy All to deploy all the devices.

The GUI page lists the devices with out-of-date configurations having the pending status.

  • The Modified By column lists the users who have modified the policies or objects. On expanding the device listing, you can view the users who have modified the policies against each policy listing.

    Note


    Usernames are not provided for deleted policies and objects.

  • The Inspect Interruption column indicates if traffic inspection interruption may be caused in the device during deployment.

    See Restart Warnings for the Threat Defense Devices for information to help you identify configurations that interrupt traffic inspection and might interrupt traffic when deployed to the threat defense devices.

    If the entry is blank in this column for a device, then it indicates that there will be no traffic inspection interruptions on that device during deployment.

  • The Last Modified Time column specifies when you last made the configuration changes.

  • The Preview column allows you to preview the changes for the next deployment. For more information, see Deployment Preview.

  • The Status column provides the status for each deployment. For more information, see Deployment Status.

Step 2

Identify and choose the devices on which you want to deploy configuration changes.

  • Search—Search for the device name, type, domain, group, or status in the search box.
  • Expand—Click Expand Arrow (expand arrow icon) to view device-specific configuration changes to be deployed.

    By selecting the device check box, all the changes for the device, which are listed under the device, are pushed for deployment. However, you can use the Policy selection (policy selection icon) to select individual policies or configurations to deploy while withholding the remaining changes without deploying them. For details, see Selective Policy Deployment.

    Optionally, use Show or Hide Policy (Show or Hide Policy icon) to selectively view or hide the associated unmodified policies.

    Note

     
    • When the status in the Inspect Interruption column indicates (Yes) that deploying will interrupt inspection, and perhaps traffic, on the threat defense device, the expanded list indicates the specific configurations causing the interruption with the Inspect Interruption (inspect interruption icon).

    • When there are changes to interface groups, security zones, or objects, the impacted devices are shown as out-of-date on the management center. To ensure that these changes take effect, the policies with these interface groups, security zones, or objects, also need to be deployed along with these changes. The impacted policies are shown as out-of-date on the Preview page on the management center.

Step 3

(Optional) Click Estimate to get a rough estimate of the deployment duration.

For more details, see Deployment Estimate.

Step 4

Click Deploy.

Step 5

If the system identifies errors or warnings in the changes to be deployed, it displays them in the Validation Messages window. To view complete details, click the arrow icon before the warnings or errors.

You have the following choices:

  • Deploy—Continue deploying without resolving warning conditions. You cannot proceed if the system identifies errors.
  • Close—Exit without deploying. Resolve the error and warning conditions, and attempt to deploy the configuration again.

What to do next

  • (Optional) Monitor deployment status; see Viewing Deployment Messages in the Cisco Secure Firewall Management Center Administration Guide.

  • If deploy fails, see Best Practices for Deploying Configuration Changes.

  • During deployment, if there is a deployment failure due to any reason, there is a possibility that the failure may impact traffic. However, it depends on certain conditions. If there are specific configuration changes in the deployment, the deployment failure may lead to traffic being interrupted. See the following table to know what configuration changes may cause traffic interruption when deployment fails.

    Configuration Changes

    Exists?

    Traffic Impacted?

    Threat Defense Service changes in an access control policy

    Yes

    Yes

    VRF

    Yes

    Yes

    Interface

    Yes

    Yes

    QoS

    Yes

    Yes


    Note


    The configuration changes interrupting traffic during deployment is valid only if both the management center and the threat defense are of version 6.2.3 or higher.


Redeploy Existing Configurations to a Device

You can force-deploy existing (unchanged) configurations to a single managed device. We strongly recommend you deploy in a maintenance window or at a time when any interruptions to traffic flow and inspection will have the least impact.


Caution


When you deploy, resource demands may result in a small number of packets dropping without inspection. Additionally, deploying some configurations restarts the Snort process, which interrupts traffic inspection. Whether traffic drops during this interruption or passes without further inspection depends on how the target device handles traffic. See Snort Restart Traffic Behavior and Configurations that Restart the Snort Process When Deployed or Activated.

Before you begin

Review the guidelines described in Best Practices for Deploying Configuration Changes.

Procedure


Step 1

Choose Devices > Device Management.

Step 2

Click Edit (edit icon) next to the device where you want to force deployment.

In a multidomain deployment, if you are not in a leaf domain, the system prompts you to switch.

Step 3

Click Device.

Step 4

Click Edit (edit icon) next to the General section heading.

Step 5

Click Force Deploy (force deploy icon).

Note


Force-deploy takes more time than the regular deployment because it involves the complete generation of the policy rules to be deployed on the threat defense.

Step 6

Click Deploy.

The system identifies any errors or warnings with the configurations you are deploying. You can click Proceed to continue without resolving warning conditions. However, you cannot proceed if the system identifies an error.


What to do next

View Deployment History

Procedure


Step 1

On the Secure Firewall Management Center menu bar, click Deploy and then select Deployment History.

A list of all the previous deployment and rollback jobs is displayed in reverse chronological order.

Step 2

Click Expand Arrow (expand arrow icon) next to the required deployment job to view the devices included in the job and their deployment statuses.

Step 3

(Optional) Click Transcript Details (transcript details icon) to view the commands sent to the device, and the responses received.

The transcript includes the following sections:

  • Snort Apply—If there are any failures or responses from Snort-related policies, then the messages are displayed in this section. Normally, the section is empty.

  • CLI Apply—This section covers features that are configured using commands that are sent to the device.

  • Infrastructure Messages—This section shows the status of different deployment modules.

In the CLI Apply section, the deployment transcript includes commands that are sent to the device, and any responses returned from the device. These responses can be informative messages or error messages. For failed deployments, look for messages that indicate errors with the commands. Examining these errors can be particularly helpful if you are using FlexConfig policies to configure customized features. These errors can help you correct the script in the FlexConfig object that is trying to configure the commands.

Note

 
There is no distinction that is made in the transcript between commands that are sent for managed features and those generated from FlexConfig policies.

For example, the following sequence shows that management center sent commands to configure GigabitEthernet0/0 with the logical name outside. The device responded that it automatically set the security level to 0. Threat Defense does not use the security level for anything.


========= CLI APPLY =========

FMC >> interface GigabitEthernet0/0
FMC >>  nameif outside
FTDv 192.168.0.152 >> [info] : INFO: Security level for "outside" set to 0 by default.

Step 4

(Optional) Click Preview (preview icon) to view the policy and object changes deployed on the device versus the previously deployed version.

The Modified By column lists the users who have modified the policies or objects. At the policy level, management center displays all the user names who have modified the policy. At the rule level, management center displays the last user who has modified the rule.

Additionally, to compare any two versions and view the change log, choose the required versions in the drop-down boxes and click the Show button. Click the Download as PDF button to download a copy of the change log.

Note


Deployment history preview is not supported for certificate enrollments, HA operations, and failed deployments.

Step 5

(Optional) Against each deployment job, click the More (more icon) icon and execute other actions:

  • Bookmark—To bookmark the deployment job.

  • Edit Deployment Notes—To edit your custom deployment notes that you added for a deployment job.

  • Generate Report—To generate a deployment report, which can be used for auditing. This report includes job properties with preview and transcript information, and the report can be downloaded as a PDF file.

    1. Click Generate Report to generate a deployment report.

      Figure 1. Generate Report
    2. In the Generate Report popup window, check the Email checkbox.

    3. The report can also be sent through email if mail relay host is configured. If the mail relay host in not configured, use the Edit (edit icon) icon to configure or modify the mail relay host. For more information, see Configuring a Mail Relay Host and Notification Address in the Cisco Secure Firewall Management Center Administration Guide.

    4. In the Recipient List, you can enter multiple email adddresses, separated by semicolons.

    5. Click Generate to generate the report, and this report is emailed to the recipients.

    6. In the Notifications task tab, you can track the progress. After the report generation is complete, click the link in the notification task tab to download the PDF report.


View Deployment History Preview

If you see a banner about an auto rolled back deployment, see Edit Deployment Settings for more information.

Procedure


Step 1

On the Secure Firewall Management Center menu bar, click Deploy and then select Deployment History.

A list of all the previous deployment and rollback jobs is displayed in reverse chronological order.

Step 2

Click Expand Arrow (expand arrow icon) next to the required deployment job to view the devices included in the job and their deployment statuses.

Step 3

(Optional) Click Preview (preview icon) to view the policy and object changes deployed on the device versus the previously deployed version.

  1. To compare any two versions and view the change log, choose the required versions in the drop-down boxes and click the Show button. The drop-down boxes show the deployment job name and the end time of the deployment.

    Note


    The drop-down boxes also show failed deployments.

  2. The Modified By column lists the users who have modified the policies or objects.

    1. At the policy level, management center displays all the user names who have modified the policy.

    2. At the rule level, management center displays the last user who has modified the rule.

  3. You can also download a copy of the change log by clicking the Download as PDF button.

The Modified By column lists the users who have modified the policies or objects. At the policy level, management center displays all the user names who have modified the policy. At the rule level, management center displays the last user who has modified the rule.

Additionally, to compare any two versions and view the change log, choose the required versions in the drop-down boxes and click the Show button. Click the Download as PDF button to download a copy of the change log.

Note


Deployment history preview is not supported for certificate enrollments, HA operations, and failed deployments.

Note

 
  • Deployment history preview is supported for all the deployments done in the management center 7.0 release only. Preview is not supported for deployments done prior to 7.0.

  • When a device is registered, preview is not supported for the job history record that is created.

  • In the deployment history, the last 10 successful deployments, the last 5 failed deployments, and last 5 rollback deployments are captured.


HA Scenarios where Preview is not Supported

Preview is not supported in the following HA scenarios:

  • If a device was in standalone mode and if a chain is made, then an auto-deployment is triggered. For that particular job, preview is not supported. On hover over the Preview (preview icon), a message is displayed that it is a HA bootstrap deployment, and no preview is supported.

  • Configuration groups - Consider a flow in which a device was initially standalone. Subsequently, three deployments took place. In the fourth deployment, the device was a HA bootstrap deployement. After these, the user deploys devices 5, 6, and 7. The deployment 7 is an HA break deployment, and the user deploys devices 8, 9, and 10.

    In this flow, the preview between 3 and 5 is not supported because 4 was a HA deployment. Similarly, the preview between 8 and 3 is also not supported. Preview is supported only from 3 to 1, 7,6, 5, 4, and 10, 9, and 8.

  • If a device is broken (HA is broken) then the new device is considered as a fresh device.

Snort Restart Scenarios

When the traffic inspection engine referred to as the Snort process on a managed device restarts, inspection is interrupted until the process resumes. Whether traffic drops during this interruption or passes without further inspection depends on how the target device handles traffic. See Snort Restart Traffic Behavior for more information. Additionally, resource demands may result in a small number of packets dropping without inspection when you deploy, regardless of whether the Snort process restarts.

Any of the scenarios in the following table cause the Snort process to restart.

Table 3. Snort Restart Scenarios

Restart Scenario

More Information

Deploying a specific configuration that requires the Snort process to restart.

Configurations that Restart the Snort Process When Deployed or Activated

Modifying a configuration that immediately restarts the Snort process.

Changes that Immediately Restart the Snort Process

Traffic-activation of the currently deployed Automatic Application Bypass (AAB) configuration.

Configure Automatic Application Bypass

Enabling or disabling "Logging connection events to RAM disk" feature.

See the section Log to Ramdisk in Troubleshoot Drain of FMC Unprocessed Events.

Inspect Traffic During Policy Apply

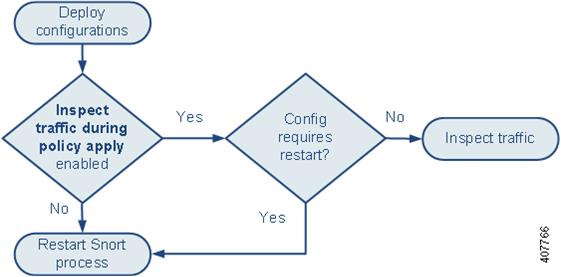
Inspect traffic during policy apply is an advanced access control policy general setting that allows managed devices to inspect traffic while deploying configuration changes; this is the case unless a configuration that you deploy requires the Snort process to restart. You can configure this option as follows:

  • Enabled — Traffic is inspected during the deployment unless certain configurations require the Snort process to restart.

    When the configurations you deploy do not require a Snort restart, the system initially uses the currently deployed access control policy to inspect traffic, and switches during deployment to the access control policy you are deploying.

  • Disabled — Traffic is not inspected during the deployment. The Snort process always restarts when you deploy.

The following graphic illustrates how Snort restarts can occur when you enable or disable Inspect traffic during policy apply.


Caution


When you deploy, resource demands may result in a small number of packets dropping without inspection. Additionally, deploying some configurations restarts the Snort process, which interrupts traffic inspection. Whether traffic drops during this interruption or passes without further inspection depends on how the target device handles traffic. See Snort Restart Traffic Behavior and Configurations that Restart the Snort Process When Deployed or Activated.


Snort Restart Traffic Behavior

The following tables explain how different devices handle traffic when the Snort process restarts.

Table 4. The Threat Defense and the Threat Defense Virtual Restart Traffic Effects

Interface Configuration

Restart Traffic Behavior

inline: Snort Fail Open: Down: disabled

dropped

inline: Snort Fail Open: Down: enabled

passed without inspection

Some packets can be delayed in buffer for several seconds before the system recognizes that Snort is down. This delay can vary depending upon the load distribution. However, the buffered packets are eventually passed.

routed, transparent (including EtherChannel, redundant, subinterface): preserve-connection enabled (configure snort preserve-connection enable ; default)

For more information, see Cisco Secure Firewall Threat Defense Command Reference.

existing TCP/UDP flows: passed without inspection so long as at least one packet arrives while Snort is down

new TCP/UDP flows and all non-TCP/UDP flows: dropped

Note that the following traffic drops even when preserve-connection is enabled:

  • plaintext, passthrough prefilter tunnel traffic that matches an Analyze rule action or an Analyze all tunnel traffic default policy action

  • connections that do not match an access control rule and are instead handled by the default action.

  • decrypted TLS/SSL traffic

  • a safe search flow

  • a captive portal flow

routed, transparent (including EtherChannel, redundant, subinterface): preserve-connection disabled (configure snort preserve-connection disable )

dropped

inline: tap mode

egress packet immediately, copy bypasses Snort

passive

uninterrupted, not inspected


Note


In addition to traffic handling when the Snort process is down while it restarts, traffic can also pass without inspection or drop when the Snort process is busy, depending on the configuration of the Snort Fail Open Busy option (see Configure an Inline Set). A device supports either the Failsafe option or the Snort Fail Open option, but not both.

Note


When the Snort process is busy but not down during configuration deployment, some packets may drop on routed, switched, or transparent interfaces if the total CPU load exceeds 60 percent.

Warning


Do not reboot the system while the Snort Rule Update is in progress.

Snort-busy drops happen when snort is not able to process the packets fast enough. Lina does not know whether Snort is busy due to processing delay, or if is stuck or due to call blocking. When transmission queue is full, snort-busy drops occur. Based on Transmission queue utilization, Lina will try to access if the queue is being serviced smoothly.

Configurations that Restart the Snort Process When Deployed or Activated

Deploying any of the following configurations except AAB restarts the Snort process as described. Deploying AAB does not cause a restart, but excessive packet latency activates the currently deployed AAB configuration, causing a partial restart of the Snort process.

Access Control Policy Advanced Settings
  • Deploy when Inspect Traffic During Policy Apply is disabled.

  • Add or remove an SSL policy.

File Policy

Deploy the first or last of any one of the following configurations; note that while otherwise deploying these file policy configurations does not cause a restart, deploying non-file-policy configurations can cause restarts.

  • Take either of the following actions:

    • Enable or disable Inspect Archives when the deployed access control policy includes at least one file policy.

    • Add the first or remove the last file policy rule when Inspect Archives is enabled (note that at least one rule is required for Inspect Archives to be meaningful).

  • Enable or disable Store files in a Detect Files or Block Files rule.

  • Add the first or remove the last active file rule that combines the Malware Cloud Lookup or Block Malware rule action with an analysis option (Spero Analysis or MSEXE, Dynamic Analysis, or Local Malware Analysis) or a store files option (Malware, Unknown, Clean, or Custom).

Note that access control rules that deploy these file policy configurations to security zones or tunnel zones cause a restart only when your configuration meets the following conditions:

  • Source or destination security zones in your access control rule must match the security zones associated with interfaces on the target devices.

  • Unless the destination zone in you access control rule is any, a source tunnel zone in the rule must match a tunnel zone assigned to a tunnel rule in the prefilter policy.

Identity Policy
  • When SSL decryption is disabled (that is, when the access control policy does not include an SSL policy), add the first or remove the last active authentication rule.

    An active authentication rule has either an Active Authentication rule action, or a Passive Authentication rule action with Use active authentication if passive or VPN identity cannot be established selected.

Network Discovery
  • Enable or disable non-authoritative, traffic-based user detection over the HTTP, FTP, or MDNS protocols, using the network discovery policy.

Device Management
  • MTU: Change the highest MTU value among all non-management interfaces on a device.

  • Automatic Application Bypass (AAB): The currently deployed AAB configuration activates when a malfunction of the Snort process or a device misconfiguration causes a single packet to use an excessive amount of processing time. The result is a partial restart of the Snort process to alleviate extremely high latency or prevent a complete traffic stall. This partial restart causes a few packets to pass without inspection, or drop, depending on how the device handles traffic.

Updates
  • System update: Deploy configurations the first time after a software update that includes a new version of the Snort binary or data acquisition library (DAQ).

  • VDB: For managed devices running Snort 2, deploying configurations the first time after installing a vulnerability database (VDB) update that includes changes applicable to managed devices will require a detection engine restart and may result in a temporary traffic interruption. For these, a message warns you when you select the management center to begin installing. The deploy dialog provides additional warnings for the threat defense devices when VDB changes are pending. VDB updates that apply only to the management center do not cause detection engine restarts, and you cannot deploy them.

    For managed devices running Snort 3, deploying configurations the first time after installing a vulnerability database (VDB) update may temporarily interrupt application detection, but there will be no traffic interruptions.

Changes that Immediately Restart the Snort Process

The following changes immediately restart the Snort process without going through the deploy process. How the restart affects traffic depends on how the target device handles traffic. See Snort Restart Traffic Behavior for more information.

  • Take any of the following actions involving applications or application detectors:

    • Activate or deactivate a system or custom application detector.

    • Delete an activated custom detector.

    • Save and Reactivate an activated custom detector.

    • Create a user-defined application.

    A message warns you that continuing restarts the Snort process, and allows you to cancel; the restart occurs on any managed device in the current domain or in any of its child domains.

  • Create or break a threat defense high availability pair—A message warns you that continuing to create a high availability pair restarts the Snort process on the primary and secondary devices and allows you to cancel.

Policy Comparison

To review policy changes for compliance with your organization's standards or to optimize system performance, you can examine the differences between two policies or between a saved policy and the running configuration.

You can compare the following policy types:

  • DNS

  • File

  • Health

  • Identity

  • Intrusion (Only Snort 2 policies)

  • Network Analysis

  • SSL

The comparison view displays both policies in a side-by-side format. Differences between the two policies are highlighted:

  • Blue indicates that the highlighted setting is different in the two policies, and the difference is noted in red text.

  • Green indicates that the highlighted setting appears in one policy but not the other.

Comparing Policies

You can compare policies only if you have access rights and any required licenses for the specific policy, and you are in the correct domain for configuring the policy.

Procedure


Step 1

Access the management page for the policy you want to compare:

  • DNS—Policies > Access Control > DNS
  • File—Policies > Access Control > Malware & File
  • Health—System (system gear icon) > Health > Policy
  • Identity—Policies > Access Control > Identity
  • Intrusion—Policies > Access Control > Intrusion

    Note


    You can compare only Snort 2 policies.

  • Network Analysis—Policies > Access Control, then click Network Analysis Policy or Policies > Access Control > Intrusion, then click Network Analysis Policies

    Note


    If your custom user role limits access to the first path listed here, use the second path to access the policy.

  • SSL—Policies > Access Control > Decryption

Step 2

Click Compare Policies.

Step 3

From the Compare Against drop-down list, choose the type of comparison you want to make:

  • To compare two different policies, choose Other Policy.
  • To compare two revisions of the same policy, choose Other Revision.
  • To compare another policy to the currently active policy, choose Running Configuration.

Step 4

Depending on the comparison type you choose, you have the following choices:

  • If you are comparing two different policies, choose the policies you want to compare from the Policy A and Policy B drop-down lists.
  • If you are comparing the running configuration to another policy, choose the second policy from the Policy B drop-down list.

Step 5

Click OK.

Step 6

Review the comparison results:

  • Comparison Viewer—To use the comparison viewer to navigate individually through policy differences, click Previous or Next above the title bar.
  • Comparison Report—To generate a PDF report that lists the differences between the two policies, click Comparison Report.


Policy Reports

For most policies, you can generate two kinds of reports. A report on a single policy provides details on the policy's current saved configuration, while a comparison report lists only the differences between two policies. You can generate a single-policy report for all policy types except health.


Note


Intrusion policy reports combine the settings in the base policy with the settings of the policy layers, and make no distinction between which settings originated in the base policy or policy layer.


Generating Current Policy Reports

You can generate policy reports only if you have access rights and any required licenses for the specific policy, and you are in the correct domain for configuring the policy.

Procedure


Step 1

Access the management page for the policy for which you want to generate a report:

  • Access Control—Policies > Access Control
  • DNS—Policies > Access Control > DNS
  • File—Policies > Access Control > Malware & File
  • Health—System (system gear icon) > Health > Policy
  • Identity—Policies > Access Control > Identity
  • Intrusion—Policies > Access Control > Intrusion
  • NAT—Devices > NAT
  • Network Analysis—Policies > Access Control, then click Network Analysis Policy or Policies > Access Control > Intrusion, then click Network Analysis Policies

    Note


    If your custom user role limits access to the first path listed here, use the second path to access the policy.

  • SSL—Policies > Access Control > Decryption

Step 2

Click Report (Report icon) next to the policy for which you want to generate a report.


Out-of-Date Policies

The system marks out-of-date policies with red status text that indicates how many of its targeted devices need a policy update. To clear this status, you must re-deploy the policy to the devices.

Configuration changes that require a policy re-deploy include:

  • Modifying an access control policy: any changes to access control rules, the default action, policy targets, Security Intelligence filtering, advanced options including preprocessing, and so on.

  • Modifying any of the policies that the access control policy invokes: the SSL policy, network analysis policies, intrusion policies, file policies, identity policies, or DNS policies.

  • Changing any reusable object or configuration used in an access control policy or policies it invokes:

    • network, port, VLAN tag, URL, and geolocation objects

    • Security Intelligence lists and feeds

    • application filters or detectors

    • intrusion policy variable sets

    • file lists

    • decryption-related objects and security zones

  • Updating the system software, intrusion rules, or the vulnerability database (VDB).

Keep in mind that you can change some of these configurations from multiple places in the web interface. For example, you can modify security zones using the object manager (Objects > Object Management), but modifying an interface type in a device’s configuration (Devices > Device Management) can also change a zone and require a policy re-deploy.

Note that the following updates do not require policy re-deploy:

  • automatic updates to Security Intelligence feeds and additions to the Security Intelligence global Block or Do Not Block list using the context menu

  • automatic updates to URL filtering data

  • scheduled geolocation database (GeoDB) updates

Performance Considerations for Limited Deployments

Host, application, and user discovery data allow the system to create a complete, up-to-the-minute profile of your network. The system can also act as an intrusion detection and prevention system (IPS), analyzing network traffic for intrusions and exploits and, optionally, dropping offending packets.

Combining discovery and IPS gives context to your network activity and allows you to take advantage of many features, including:

  • impact flags and indications of compromise, which can tell you which of your hosts are vulnerable to a particular exploit, attack, or piece of malware

  • adaptive profile updates and Cisco recommendations, which allow you to examine traffic differently depending on the destination host

  • correlation, which allows you to respond to intrusions (and other events) differently depending on the affected host

However, if your organization is interested in performing only IPS, or only discovery, there are a few configurations that can optimize the performance of the system.

Discovery Without Intrusion Prevention

The discovery feature allows you to monitor network traffic and determine the number and types of hosts (including network devices) on your network, as well as the operating systems, active applications, and open ports on those hosts. You can also configure managed devices to monitor user activity on your network. You can use discovery data to perform traffic profiling, assess network compliance, and respond to policy violations.

In a basic deployment (discovery and simple, network-based access control only), you can improve a device’s performance by following a few important guidelines when configuring its access control policy.


Note


You must use an access control policy, even if it simply allows all traffic. The network discovery policy can only examine traffic that the access control policy allows to pass.


First, make sure your access control policy does not require complex processing and uses only simple, network-based criteria to handle network traffic. You must implement all of the following guidelines; misconfiguring any one of these options eliminates the performance benefit:

  • Do not use the Security Intelligence feature. Remove any populated global Block or Do Not Block list from the policy’s Security Intelligence configuration.

  • Do not include access control rules with Monitor or Interactive Block actions. Use only Allow, Trust, and Block rules. Keep in mind that allowed traffic can be inspected by discovery; trusted and blocked traffic cannot.

  • Do not include access control rules with application, user, URL, ISE attribute, or geolocation-based network conditions. Use only simple network-based conditions: zone, IP address, VLAN tag, and port.

  • Do not include access control rules that perform file, malware, or intrusion inspection. In other words, do not associate a file policy or intrusion policy with any access control rule.

  • In the Advanced settings for the access control policy, make sure that Intrusion Policy used before Access Control rule is determined is set to No Rules Active.

  • Select Network Discovery Only as the policy’s default action. Do not choose a default action for the policy that performs intrusion inspection.

In conjunction with the access control policy, you can configure and deploy the network discovery policy, which specifies the network segments, ports, and zones that the system examines for discovery data, as well as whether hosts, applications, and users are discovered on the segments, ports, and zones.

Intrusion Prevention Without Discovery

Disabling discovery if you don't need it (for example, in an IPS-only deployment) can improve performance. To disable discovery you must implement all of these changes:

  • Delete all rules from your network discovery policy.

  • Use only simple network-based conditions to perform access control: zone, IP address, VLAN tag, and port.

    Do not perform any kind of Security Intelligence, application, user, URL, or geolocation control. Although you can disable storage of discovery data, the system still must collect and examine it to implement those features.

  • Disable network and URL-based Security Intelligence by deleting all Block and Do Not Block lists from your access control policy's Security Intelligence configuration, including the default Global lists.

  • Disable DNS-based Security Intelligence by deleting or disabling all rules in the associated DNS policy, including the default Global Do-Not-Block List for DNS and Global Block List for DNS rules.

After you deploy, new discovery halts on target devices. The system gradually deletes information in the network map according to your timeout preferences. Or, you can purge all discovery data immediately.

History for Configuration Deployment