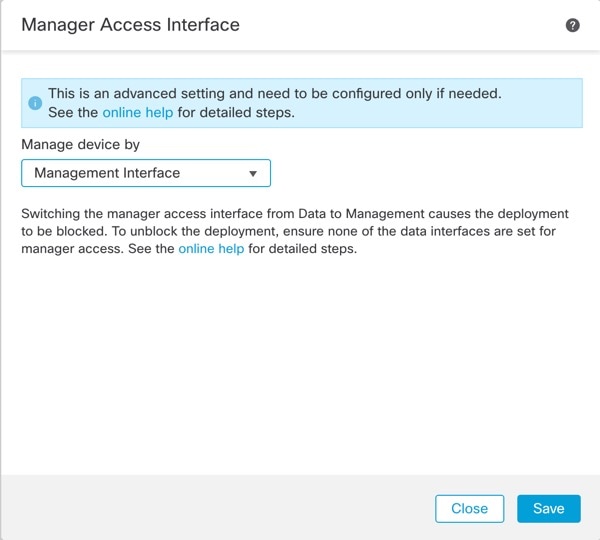
When you use a data interface for manager access instead of using the dedicated
Management interface, you must be careful about changing the interface and network
settings for the threat
defense in the management center so you do not disrupt the connection. If you change the management interface type
after you add the threat
defense to the management center (from data to Management, or from Management to data), if the interfaces and
network settings are not configured correctly, you can lose management
connectivity.
This topic helps you troubleshoot the loss of management connectivity.
- View management connection status
-
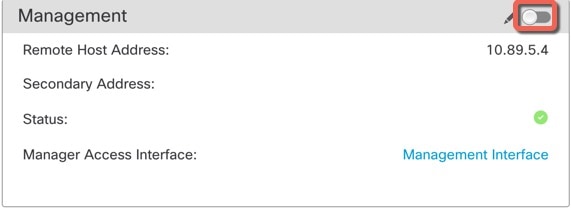
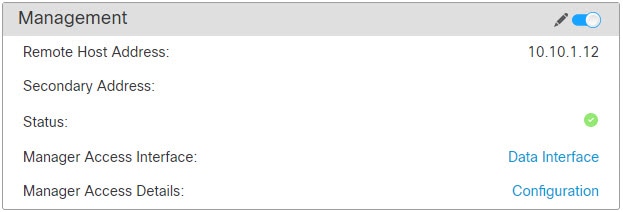
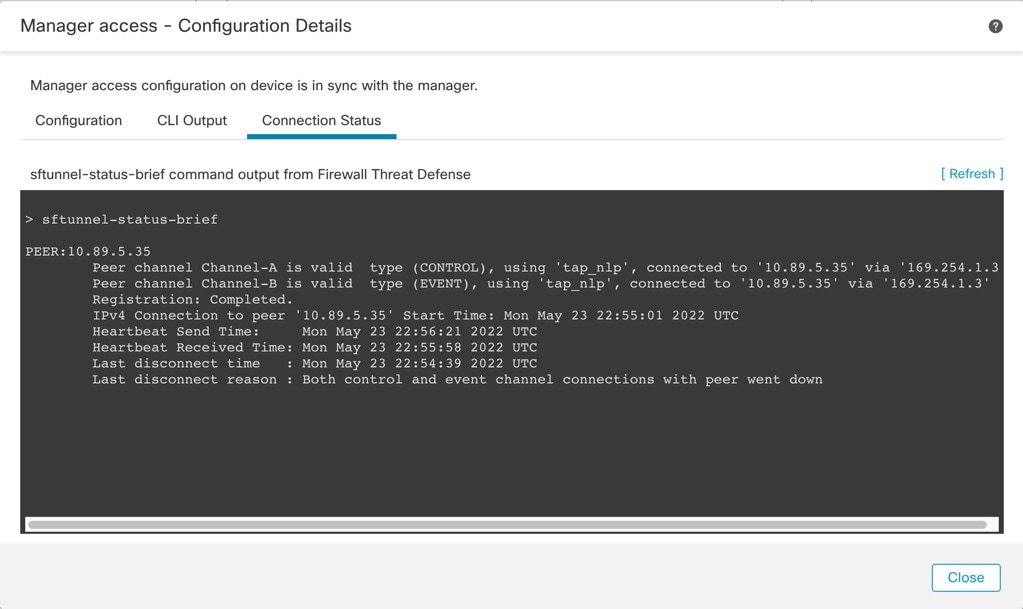
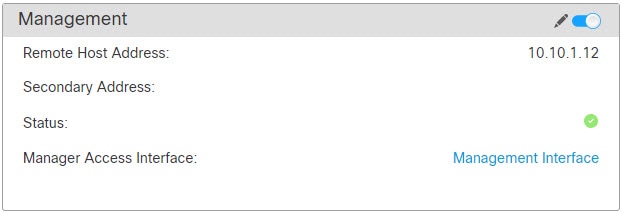
In the management center, check the management connection status on the page.
At the threat
defense CLI, enter the sftunnel-status-brief
command to view the management connection status. You can also use
sftunnel-status to view more complete
information.
See the following sample output for a connection that is down; there is
no peer channel "connected to" information, nor heartbeat information
shown:
> sftunnel-status-brief
PEER:10.10.17.202
Registration: Completed.
Connection to peer '10.10.17.202' Attempted at Mon Jun 15 09:21:57 2020 UTC
Last disconnect time : Mon Jun 15 09:19:09 2020 UTC
Last disconnect reason : Both control and event channel connections with peer went down
See the following sample output for a connection that is up, with peer
channel and heartbeat information shown:
> sftunnel-status-brief
PEER:10.10.17.202
Peer channel Channel-A is valid type (CONTROL), using 'eth0', connected to '10.10.17.202' via '10.10.17.222'
Peer channel Channel-B is valid type (EVENT), using 'eth0', connected to '10.10.17.202' via '10.10.17.222'
Registration: Completed.
IPv4 Connection to peer '10.10.17.202' Start Time: Wed Jun 10 14:27:12 2020 UTC
Heartbeat Send Time: Mon Jun 15 09:02:08 2020 UTC
Heartbeat Received Time: Mon Jun 15 09:02:16 2020 UTC
- View the threat
defense network information
-
At the threat
defense CLI, view the Management and manager access data interface network
settings:
show network
> show network
===============[ System Information ]===============
Hostname                  : 5516X-4
DNS Servers               : 208.67.220.220,208.67.222.222
Management port           : 8305
IPv4 Default route
  Gateway                 : data-interfaces
IPv6 Default route
  Gateway                 : data-interfaces

======================[ br1 ]=======================
State                     : Enabled
Link                      : Up
Channels                  : Management & Events
Mode                      : Non-Autonegotiation
MDI/MDIX                  : Auto/MDIX
MTU                       : 1500
MAC Address               : 28:6F:7F:D3:CB:8D
----------------------[ IPv4 ]----------------------
Configuration             : Manual
Address                   : 10.99.10.4
Netmask                   : 255.255.255.0
Gateway                   : 10.99.10.1
----------------------[ IPv6 ]----------------------
Configuration             : Disabled

===============[ Proxy Information ]================
State                     : Disabled
Authentication            : Disabled

======[ System Information - Data Interfaces ]======
DNS Servers               :
Interfaces                : GigabitEthernet1/1

===============[ GigabitEthernet1/1 ]===============
State                     : Enabled
Link                      : Up
Name                      : outside
MTU                       : 1500
MAC Address               : 28:6F:7F:D3:CB:8F
----------------------[ IPv4 ]----------------------
Configuration             : Manual
Address                   : 10.89.5.29
Netmask                   : 255.255.255.192
Gateway                   : 10.89.5.1
----------------------[ IPv6 ]----------------------
Configuration             : Disabled
- Check that the threat
defense registered with the management center
-
At the threat
defense CLI, check that the management center registration was completed. Note that this command will not show the
current status of the management connection.
show managers
> show managers
Type                      : Manager
Host                      : 10.10.1.4
Display name              : 10.10.1.4
Identifier                : f7ffad78-bf16-11ec-a737-baa2f76ef602
Registration              : Completed
Management type           : Configuration
- Ping the management center
-
At the threat
defense CLI, use the following command to ping the management center from the data interfaces:
ping
fmc_ip
At the threat
defense CLI, use the following command to ping the management center from the Management interface, which should route over the backplane
to the data interfaces:
ping system
fmc_ip
- Capture packets on the threat
defense internal interface
-
At the threat
defense CLI, capture packets on the internal backplane interface
(nlp_int_tap) to see if management packets are being sent:
capture
name
interface nlp_int_tap trace detail match ip any
any
show capturename
trace detail
- Check the internal interface status, statistics, and packet count
-
At the threat
defense CLI, see information about the internal backplane interface,
nlp_int_tap:
show interace detail
> show interface detail
[...]
Interface Internal-Data0/1 "nlp_int_tap", is up, line protocol is up
  Hardware is en_vtun rev00, BW Unknown Speed-Capability, DLY 1000 usec
	(Full-duplex), (1000 Mbps)
	Input flow control is unsupported, output flow control is unsupported
	MAC address 0000.0100.0001, MTU 1500
	IP address 169.254.1.1, subnet mask 255.255.255.248
	37 packets input, 2822 bytes, 0 no buffer
	Received 0 broadcasts, 0 runts, 0 giants
	0 input errors, 0 CRC, 0 frame, 0 overrun, 0 ignored, 0 abort
	0 pause input, 0 resume input
	0 L2 decode drops
	5 packets output, 370 bytes, 0 underruns
	0 pause output, 0 resume output
	0 output errors, 0 collisions, 0 interface resets
	0 late collisions, 0 deferred
	0 input reset drops, 0 output reset drops
	input queue (blocks free curr/low): hardware (0/0)
	output queue (blocks free curr/low): hardware (0/0)
  Traffic Statistics for "nlp_int_tap":
	37 packets input, 2304 bytes
	5 packets output, 300 bytes
	37 packets dropped
      1 minute input rate 0 pkts/sec,  0 bytes/sec
      1 minute output rate 0 pkts/sec,  0 bytes/sec
      1 minute drop rate, 0 pkts/sec
      5 minute input rate 0 pkts/sec,  0 bytes/sec
      5 minute output rate 0 pkts/sec,  0 bytes/sec
      5 minute drop rate, 0 pkts/sec
  Control Point Interface States:
	Interface number is 14
	Interface config status is active
	Interface state is active
- Check routing and NAT
-
At the threat
defense CLI, check that the default route (S*) was added and that internal
NAT rules exist for the Management interface (nlp_int_tap).
show route
> show route

Codes: L - local, C - connected, S - static, R - RIP, M - mobile, B - BGP
       D - EIGRP, EX - EIGRP external, O - OSPF, IA - OSPF inter area
       N1 - OSPF NSSA external type 1, N2 - OSPF NSSA external type 2
       E1 - OSPF external type 1, E2 - OSPF external type 2, V - VPN
       i - IS-IS, su - IS-IS summary, L1 - IS-IS level-1, L2 - IS-IS level-2
       ia - IS-IS inter area, * - candidate default, U - per-user static route
       o - ODR, P - periodic downloaded static route, + - replicated route
       SI - Static InterVRF
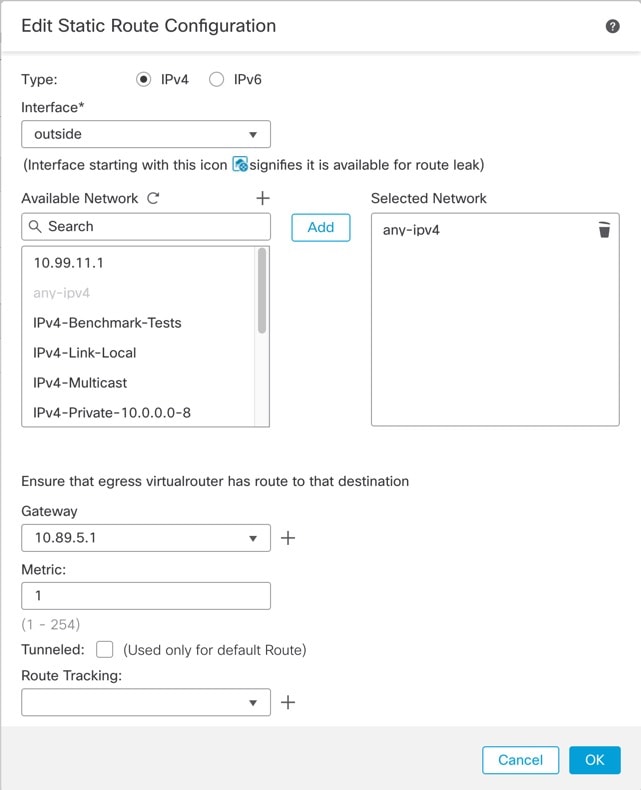
Gateway of last resort is 10.89.5.1 to network 0.0.0.0

S*       0.0.0.0 0.0.0.0 [1/0] via 10.89.5.1, outside
C        10.89.5.0 255.255.255.192 is directly connected, outside
L        10.89.5.29 255.255.255.255 is directly connected, outside

>
show nat
> show nat

Auto NAT Policies (Section 2)
1 (nlp_int_tap) to (outside) source static nlp_server_0_sftunnel_intf3 interface  service tcp 8305 8305
    translate_hits = 0, untranslate_hits = 6
2 (nlp_int_tap) to (outside) source static nlp_server_0_ssh_intf3 interface  service tcp ssh ssh
    translate_hits = 0, untranslate_hits = 73
3 (nlp_int_tap) to (outside) source static nlp_server_0_sftunnel_ipv6_intf3 interface ipv6  service tcp 8305 8305
    translate_hits = 0, untranslate_hits = 0
4 (nlp_int_tap) to (outside) source dynamic nlp_client_0_intf3 interface
    translate_hits = 174, untranslate_hits = 0
5 (nlp_int_tap) to (outside) source dynamic nlp_client_0_ipv6_intf3 interface ipv6
    translate_hits = 0, untranslate_hits = 0
>
- Check other settings
-
See the following commands to check that all other settings are present.
You can also see many of these commands on the management center's page.
show running-config sftunnel
> show running-config sftunnel
sftunnel interface outside
sftunnel port 8305
show running-config ip-client
> show running-config ip-client
ip-client outside
show conn address
fmc_ip
> show conn address 10.89.5.35
5 in use, 16 most used
Inspect Snort:
        preserve-connection: 0 enabled, 0 in effect, 0 most enabled, 0 most in effect

TCP nlp_int_tap  10.89.5.29(169.254.1.2):51231 outside  10.89.5.35:8305, idle 0:00:04, bytes 86684, flags UxIO
TCP nlp_int_tap  10.89.5.29(169.254.1.2):8305 outside  10.89.5.35:52019, idle 0:00:02, bytes 1630834, flags UIO
>
- Check for a successful DDNS update
-
At the threat
defense CLI, check for a successful DDNS update:
debug ddns
> debug ddns
DDNS update request = /v3/update?hostname=domain.example.org&myip=209.165.200.225
Successfuly updated the DDNS sever with current IP addresses
DDNS: Another update completed, outstanding = 0
DDNS: IDB SB total = 0
If the update failed, use the debug http and
debug ssl commands. For certificate
validation failures, check that the root certificates are installed on
the device:
show crypto ca certificates
trustpoint_name
To check the DDNS operation:
show ddns update interface
fmc_access_ifc_name
> show ddns update interface outside

Dynamic DNS Update on outside:
    Update Method Name Update Destination
    RBD_DDNS not available

Last Update attempted on 04:11:58.083 UTC Thu Jun 11 2020
Status : Success
FQDN : domain.example.org
IP addresses : 209.165.200.225
- Check management center log files
-
See https://cisco.com/go/fmc-reg-error.

 )
) )
) )
) )
) )
) )
) )
) )
)




 )
)

 )
)


 )
)


 )
)
 )
)


 Feedback