Introduction to Event Viewer Capabilities
Event Viewer monitors your network for syslog (system log) events from ASA and FWSM devices and security contexts and SDEE (Secure Device Event Exchange) events from IPS devices and virtual sensors. Event Viewer collects these events and provides an interface by which you can view them, group them, and examine their details.
 Note |
Beginning with version 4.5, Security Manager enables you to forward syslogs to one local collector and two remote collectors. For more information, see Event Management Page. |
 Tip |
Event Viewer and its related applications, Report Manager and Health and Performance Monitor, are useful for operational monitoring and troubleshooting of certain types of Cisco devices in your network. These applications do not provide extensive event correlation, compliance reporting, long-term forensics, or the integrated monitoring of both Cisco and non-Cisco devices. |
When working with IPS events, the Report Manager component of Cisco Security Manager reports events individually; the Event Viewer component of Cisco Security Manager displays alerts. In the Event Viewer component, the IPS Summarizer groups events into a single alert, thus decreasing the number of alerts that the IPS sensor sends out.
Tip |
Cisco IPS Manager Express (IME) and Cisco Security Manager do not summarize events in precisely the same way. |
This section briefly describes some key activities that Event Viewer facilitates:
Historical View
An historical view is one that displays events from a selected period of time (for example, the last 10 minutes) and does not automatically update as new events are collected. You must refresh the view to see newer events.
Consider the following activities among the many possibilities for employing Event Viewer with an historical view:
-
Troubleshoot Connectivity—When a report comes in that a user cannot reach a particular server, you can set an historical view (for example, the last 10 minutes) that displays all events that affect that user’s IP address as a source or destination. Then, you can go from a particular displayed event to the policy denying that user’s access to the resource.
-
Tune Signatures—After setting a view of all IPS messages, or all IPS messages of a given category, you might decide that an event is actually a false positive. You can then cross launch into the associated policy and either tune the signature to exclude the host or lessen the reported severity of the particular event.
Also consider creating an event action filter to modify how the alert is handled. Frequently, event action filters are a better way of dealing with false positives than editing the actual signature. For more information, see Tips for Managing Event Action Filter Rules.
-
Validate Policy Deployment—After deploying a new or changed policy, you might want to confirm that it is operating effectively by selecting events corresponding to the given policy. For example, you could identify firewall-deny messages triggered by the new policy.
Real-Time View
A real-time view displays events as they are received and automatically updates the Event Table in waterfall fashion. Keep in mind that the term “real-time” is not precise. System latency and other factors prevent true real-time system response.
Note |
There might be a drop of events or slowness in processing events when you use filters in a real-time view and when the event flow is more than 10K EPS. |
Consider the following activities among the many possibilities for employing Event Viewer with a real-time view:
-
Investigate Attacks in Near Real-time—By isolating details of a particular source IP address, or a source/destination pair, Event Viewer can provide details about attacks on your monitored devices, or attacks that are going through those devices.
-
Validate Device Activity—You can examine a device in your network and determine whether it is present and whether it is sending events.
-
View High Threat IPS Events—You can filter a view to display all events that exceed a certain threat level. On a properly tuned IPS sensor, this should be a manageable flow of events to watch in a real-time view.
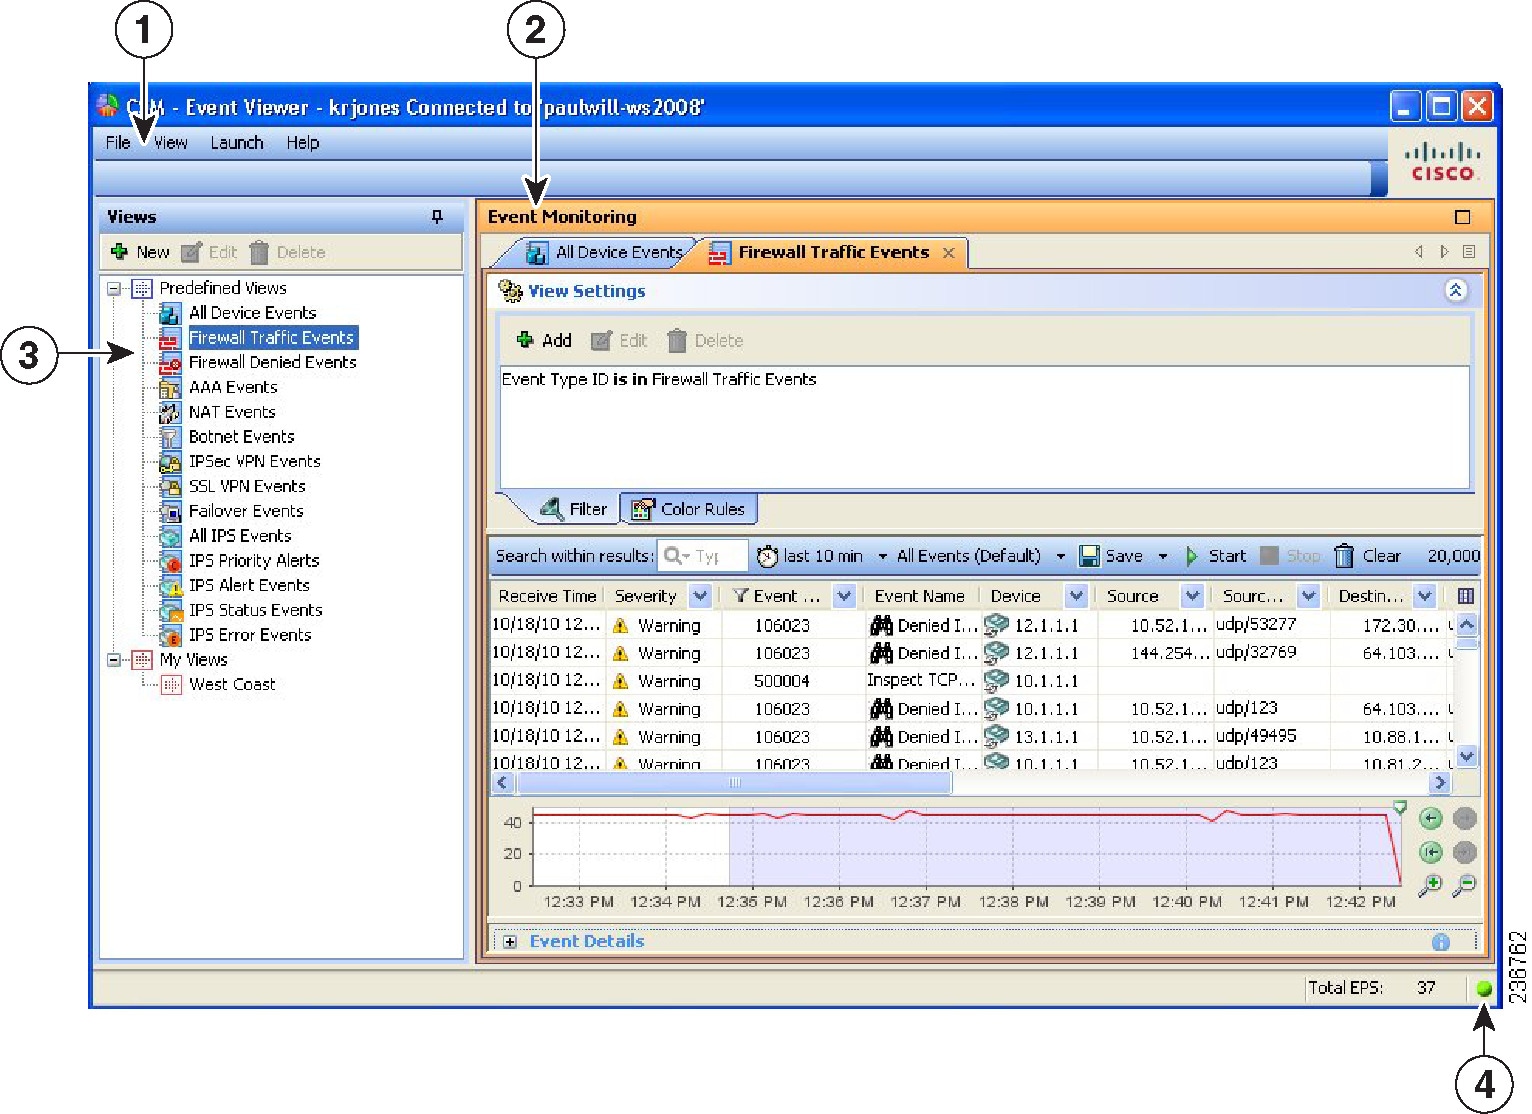
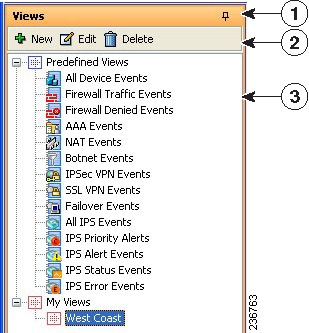
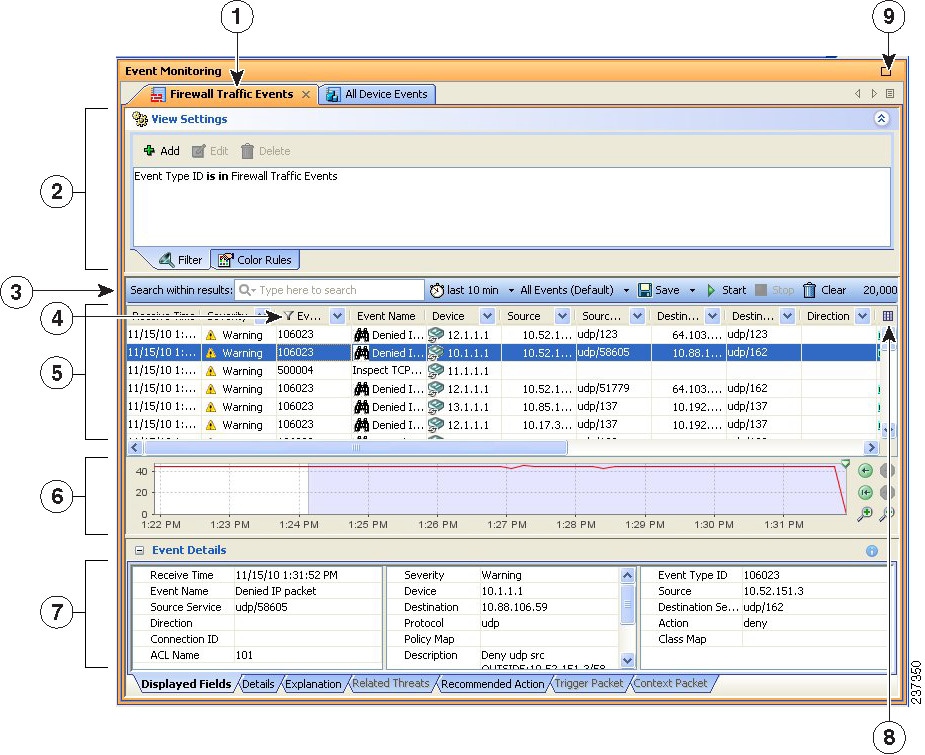
Views and Filters
When you view events in Event Viewer, you open a view. A view is a set of filters and other properties, including color rules, selected columns and their positions and widths, and the default time window, that let you define a subset of events. Views help to limit the scope of the events list so that you can more easily find what you are looking for.
Event Viewer includes a number of predefined views. Although you cannot change the filter rules for these views, you can create copies of the views and change the filter rules in your copy. Views you create are called custom views. For more information, see Creating Custom Views.
Using filters is key to getting the most from Event Viewer. You can distill from all the events being received a view of only the information that you need or want. You can use the various methods of filtering to reduce the events list, filtering lists that have already been filtered. The following list explains the general filtering features; for more information, see Filtering and Querying Events.
-
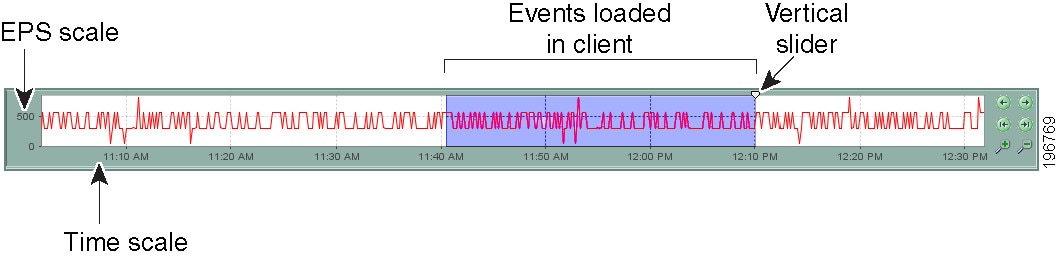
Time filters—You can use time filters to limit the events that are loaded into your client as well as to limit the events displayed in the Event Table. With time filtering you can select predefined values, such as the last hour, or specify a particular time range by dates and times. For more information, see Selecting the Time Range for Events.
-
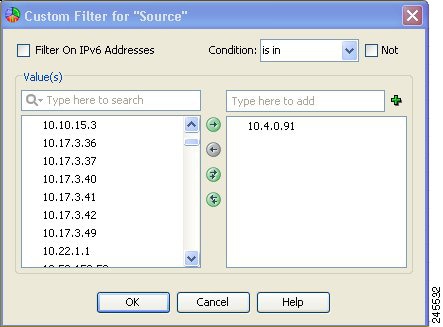
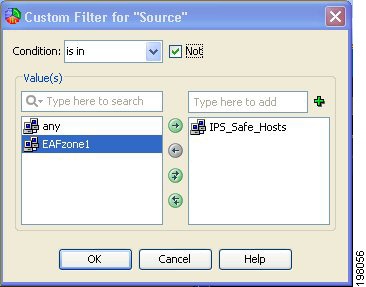
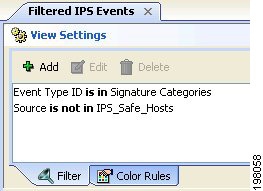
Column filters—You can use column filters to filter events based on a particular value of an event. For example, you could filter on a particular source or destination, or both. For certain columns you can also filter on a range of values or on a policy object. Column filters are part of the view settings for a view. For more information, see Creating Column-Based Filters.
-
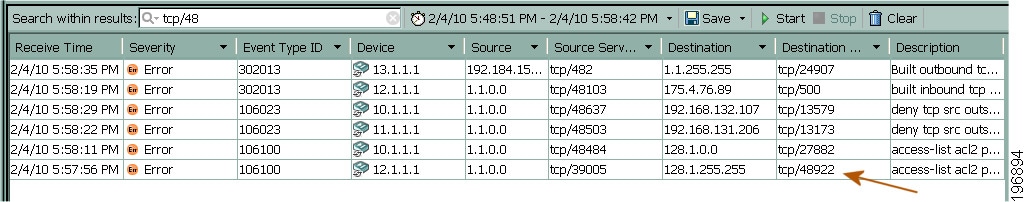
Quick filters—You can use quick filters to execute a text-based filter on events listed in the event table. The search is not column-sensitive, showing all events in which the string appears in any column. You can use the Quick Filter drop-down list (shown as a magnifier) to modify the scope of the filter. For more information, see Filtering on a Text String.
-
Drilling down with filters—Aggregating additional filters allows you to become more and more selective, to “drill down” until you can view a particular event or set of events that meet your requirements. The View Settings pane at the top of the Event Monitoring window updates with each additional filter choice you make to show the current aggregate filter definition of the view selected.
Policy Navigation
You can navigate from a particular event to the policy within Security Manager that governs that event. You can also navigate from certain policies to events associated with those policies. For more information, see Looking Up a Security Manager Policy from Event Viewer and Looking Up Events for a Security Manager Policy.
Understanding Event Viewer Access Control
The user privileges assigned to your username control what you can do in Event Viewer. If you use local users, or other types of non-ACS access control, then all users have access to Event Viewer. However, the following access limits are imposed:
-
You must have system administrator, network administrator, or approver privileges to select or deselect devices for monitoring. See Selecting Devices to Monitor.
-
You must have system administrator privileges to change the Event Management administrative settings page, where you enable or disable the service and configure storage location and other settings, as described in Starting, Stopping, and Configuring the Event Manager Service and Event Management Page
If you use ACS to control access to Security Manager, you can also control the following:
-
You can control access to the Event Viewer application using the View Event Viewer privilege. Using this privilege, you could prevent certain users from accessing Event Viewer, or create roles that allow access to Event Viewer without allowing access to Report Manager. All default ACS roles are permitted to use Event Viewer.
-
You can control which users can enable or disable monitoring for devices using the Modify > Manage Event Monitoring privilege. A user must have this privilege to select devices for monitoring as described in Selecting Devices to Monitor. The default ACS roles that have this permission are system administrator, network administrator, approver, security administrator, and security approver.
-
You can control the use of the policy lookup feature. Users must have View Device privileges to the device, and also View privileges to the firewall or IPS policy, to perform policy lookup. If users do not have all permissions, they will get an “Unable to Find Matching Rule” error if they try to look up a matching rule. For more information about policy lookup, see Looking Up a Security Manager Policy from Event Viewer.
-
Users can view events on devices only if they have at least View privileges to the device.
-
You can control access to the Event Management administrative settings page, where you enable or disable the service and configure storage location and other settings, as described in Starting, Stopping, and Configuring the Event Manager Service and Event Management Page. The user must have Admin privileges to access this page (or any other administrative settings page). All default ACS roles except help desk can view the page, but only system administrators can change settings.
-
You can control the use of network/host and service policy objects for column filters (such as the Device, Source, Destination, Source Service, and Destination Service columns). Users must have the appropriate View Object permissions for network/host, network/host-IPv6, and service objects to use them in filters. For more information on creating column filters, see Creating Column-Based Filters.
For information on integrating Security Manager with Cisco Secure ACS, see the Installation Guide for Cisco Security Manager .
Scope and Limits of Event Viewer
The following table provides details on the functional scope and limits of Event Viewer:
|
Item |
Description |
||
|---|---|---|---|
|
Device Support |
You can view events collected from the following types of devices. Although Event Viewer has been tested with the indicated software releases, you might be able to use it with older software releases.
IPS support does not include IOS IPS. |
||
|
Event Data Store Size and Location |
You can control the location and disk space allocated to holding events collected from monitored devices. After the Event Data Store is 90 percent filled, newest events replace oldest events. You can also configure an extended storage, or archive, location on attached storage devices. Security Manager automatically copies events into the extended storage; when you view historical events, they are automatically retrieved from extended storage if they no longer reside on the local disk. For more information on configuring these settings, see the Event Management Page. |
||
|
Event Limit |
You can control the maximum number of events that can be viewed at one time in the events table using the Event Data Pagination Size option. For information on configuring the option, see Event Management Page. |
||
|
Policy Objects |
You can use some types of policy objects, such as network/host and services objects, when creating column filters. You can also view host object names instead of IP addresses in the source and destination columns by selecting View > Show Network Host Objects. This option is selected by default. IP address to host name mapping is supported only for the source and destination of events. Also, the mapping applies to Host objects only; Event Viewer will not show an object name when the source or destination of an event matches a Network object, Group object, or Address Range object.
|
||
|
Views |
A single Event Viewer client can open at most four historical views and one real-time view at a time. |
||
|
Clients |
For a single Security Manager server, a maximum of 5 Security Manager clients can open Event Viewer at one time, and a Security Manager client can open one copy of Event Viewer. |
Deeply Parsed Syslogs
The structure and contents of standard syslogs and the elements comprised by each are detailed in the System Logs documentation for the device and software version you are using.
You can find the documentation on Cisco.com at these locations:
-
ASA Devices: http://www.cisco.com/en/US/products/ps6120/products_system_message_guides_list.html
-
FWSM Devices: http://www.cisco.com/en/US/products/hw/modules/ps2706/products_system_message_guides_list.html
Syslogs other than those listed here are presented as raw syslogs. Only deeply parsed syslogs present the full content carried by the syslog.
The deeply parsed syslogs in Security Manager are detailed in the following table.
|
Syslog Category |
Syslog ID |
Total Number of Syslogs |
||||
|---|---|---|---|---|---|---|
|
Flow, Session Syslogs |
110002-110003, 209003-209005, 302003-302004, 302009-302010, 302012-302018, 302020-302021, 302035-302036, 302303-302306, 302033-302034, 303002-302005, 313001, 313004, 313005, 313008, 324000-324006, 337001-337009, 431001-431002, 407001-407002, 416001, 418001-418002, 419001-419003, 424001-424002, 450001, 448001, 609001-609002
|
66 |
||||
|
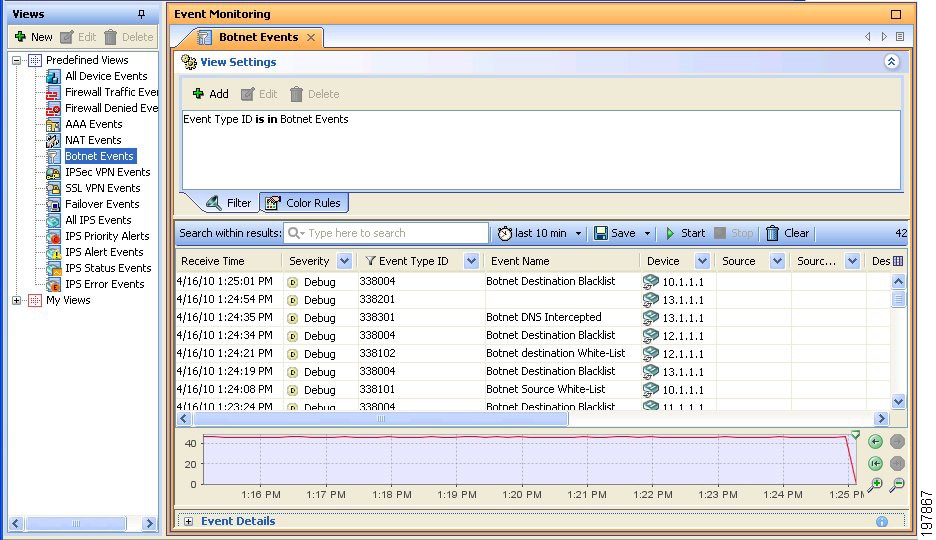
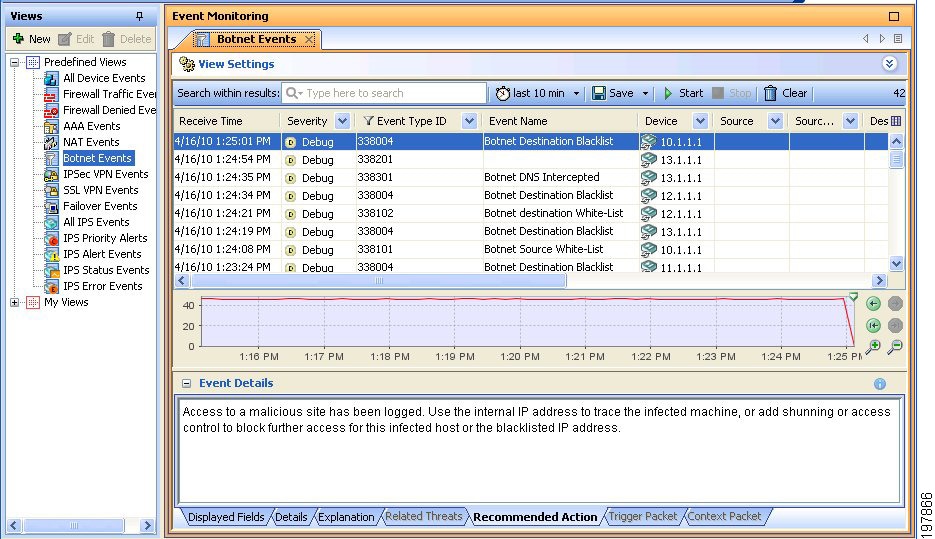
Botnet |
338001-338004, 338101-338104, 338201-338202, 338301 |
11 |
||||
|
ACL |
106100, 106023, 106002, 106006, 106018 |
5 |
||||
|
Denied Firewall |
106001, 106007, 106008, 106010-106017, 106020-106022, 106025-106027 |
17 |
||||
|
Identity Firewall |
746003, 746005, 746010, 746016 |
4 |
||||
|
AAA |
109001-109010, 109012, 109016-109020, 109023-109029, 109031-109035, 113001-113025 |
53 |
||||
|
Inspect |
108002-108007, 303004-303005, 400000-400050, 406001-406002, 415001-415020, 500001-500005, 508001-508002, 608001-608005, 607001- 607003, 703001-703002, 726001 |
99 |
||||
|
NAT |
201002-201006, 201009-201013, 202005, 202011, 305005-305012 |
20 |
||||
|
IPSec VPN |
402114-402122, 602103-602104, 602303-602304, 702305, 702307 |
15 |
||||
|
Failover (HA) |
101001-101005, 102001, 103001-103007, 104001-104004, 311001-311004, 709001-709007, 210001-210022 (except 210008, 210010) |
48 |
||||
|
SSL VPN |
725001-725009, 725012-725013, 716001-716020, 716023 -716039, 716041-716060, 722001-722023, 722026-722044, 722046-722051, 723001-723002, 723009-723012, 723014, 724001-724004 |
128 |
||||
|
Etherchannel |
426001-426003 |
3 |
||||
|
Cluster |
302022- 302027 |
6 |


 Feedback